Some people might want to use multiple color schemas in a single heatmap to highlight group-wise patterns. If groups are also separated in heatmap, then actually each group can be treated as a single heatmap with its own color theme, later these heatmaps can be concatenated into the final heatmap.
In the following example, we assume there are two groups on columns. Colors for group A use the theme “green-black-red” and colors for group B use “purple-white-orange”.
set.seed(123)
mat = cbind(rbind(matrix(rnorm(20*20, mean = 1, sd = 0.5), nr = 20),
              matrix(rnorm(20*20, mean = 0, sd = 0.5), nr = 20),
              matrix(rnorm(20*20, mean = 0, sd = 0.5), nr = 20)),
       rbind(matrix(rnorm(20*20, mean = 0, sd = 0.5), nr = 20),
              matrix(rnorm(20*20, mean = 1, sd = 0.5), nr = 20),
              matrix(rnorm(20*20, mean = 0, sd = 0.5), nr = 20)),
       rbind(matrix(rnorm(20*20, mean = 0.5, sd = 0.5), nr = 20),
              matrix(rnorm(20*20, mean = 0.5, sd = 0.5), nr = 20),
              matrix(rnorm(20*20, mean = 1, sd = 0.5), nr = 20))
       ) + matrix(rnorm(60*60, sd = 0.5), nr = 60)
group = rep(c("A", "B"), times = c(40, 20))
group = sample(group, length(group))

library(circlize)
library(ComplexHeatmap)

col1 = colorRamp2(c(-2, 0, 2), c("green", "black", "red"))
col2 = colorRamp2(c(-2, 0, 2), c("purple", "white", "orange"))

ht1 = Heatmap(mat[, group == "A"], col = col1, name = "Group_A")
ht2 = Heatmap(mat[, group == "B"], col = col2, name = "Group_B")
ht1 + ht2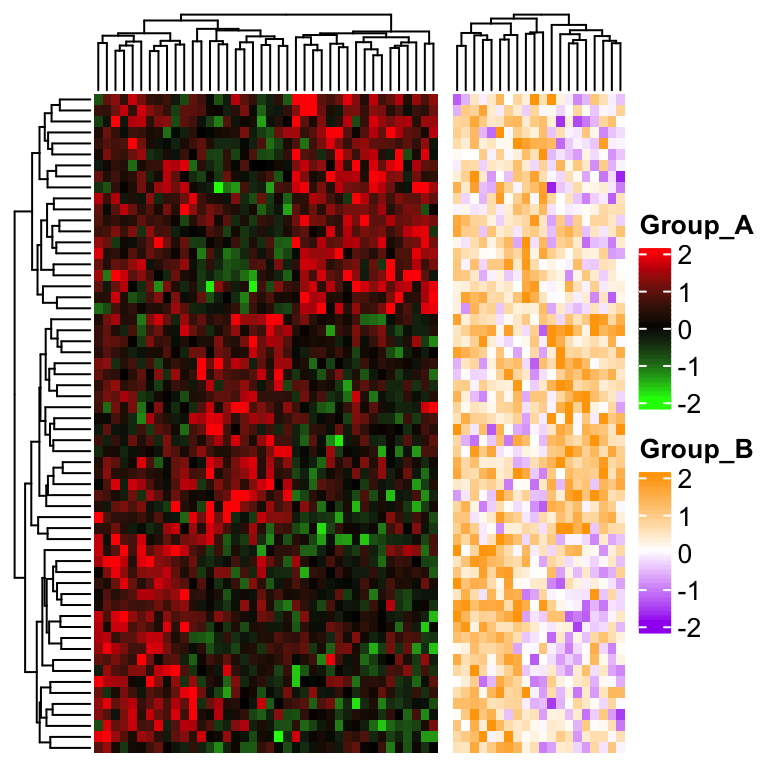
The problem here is row clustering is only calculated from the “main heatmap” which corresponds to the submatrix in group A.
This problem can be solved by calculating the row clustering from the complete matrix in advance, later
assign to cluster_rows in draw() function to change it globally (you can also assign to cluster_rows in
the main heatmap).
row_hlust = hclust(dist(mat))
draw(ht1 + ht2, cluster_rows = row_hlust)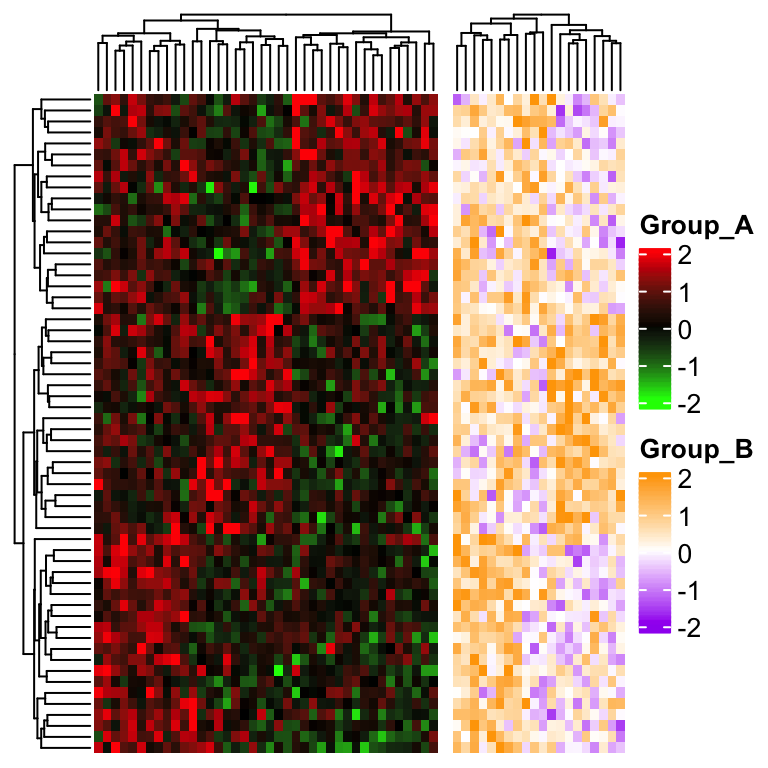
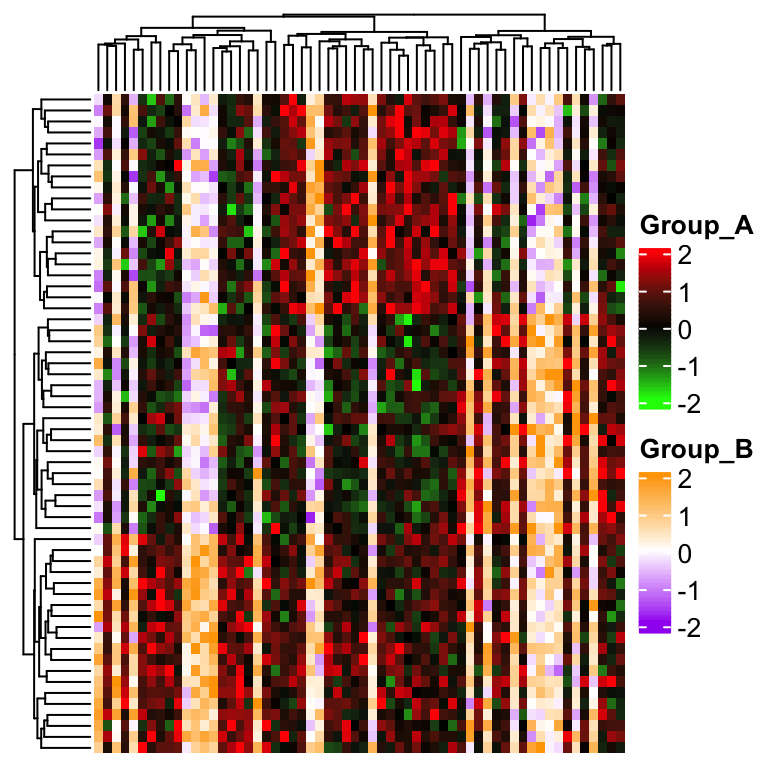
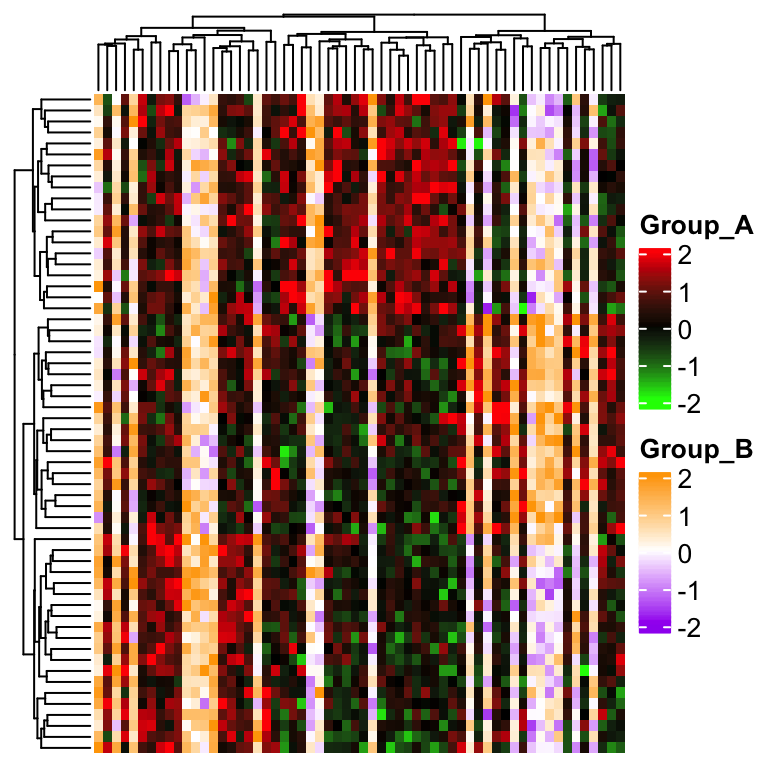
Now people want to say, no, I want to mix the two groups in a single heatmap while not separating them.
This time the single heatmap really contains two color themes and we need to draw the heatmap grids manually
with the argument cell_fun or layer_fun.
First we need to turn off the heatmap grids by setting rect_gp = gpar(type = "none"), also the legend should
be turned off by setting show_heatmap_legend = FALSE because later we will add the two color legends manually. Here
the heatmap grids are added by self-defining a cell_fun. See the code below.
ht = Heatmap(mat, rect_gp = gpar(type = "none"), show_heatmap_legend = FALSE,
    cell_fun = function(j, i, x, y, w, h, fill) {
        if(group[j] == "A") {
            grid.rect(x, y, w, h, gp = gpar(fill = col1(mat[j, i]), col = NA))
        } else {
            grid.rect(x, y, w, h, gp = gpar(fill = col2(mat[j, i]), col = NA))
        }
    })
And we manually define two color legends and send to heatmap_legend_list argument.
draw(ht, heatmap_legend_list = list(
    Legend(title = "Group_A", col_fun = col1),
    Legend(title = "Group_B", col_fun = col2)
))
cell_fun draws heatmap cells on after the other. It might be slow when there are large number
of cells to draw. layer_fun is a vectorized version of cell_fun, which improves the speed quite a lot.
For explanation of layer_fun as well as the usage of function pindex(), please refer to https://jokergoo.github.io/ComplexHeatmap-reference/book/a-single-heatmap.html#layer-fun.
ht = Heatmap(mat, rect_gp = gpar(type = "none"), show_heatmap_legend = FALSE,
    layer_fun = function(j, i, x, y, w, h, fill) {
        l = group[j] == "A"
        grid.rect(x[l], y[l], w[l], h[l],
            gp = gpar(fill = col1(pindex(mat, i[l], j[l])), col = NA))
        l = group[j] == "B"
        grid.rect(x[l], y[l], w[l], h[l],
            gp = gpar(fill = col2(pindex(mat, i[l], j[l])), col = NA))
    })
draw(ht, heatmap_legend_list = list(
    Legend(title = "Group_A", col_fun = col1),
    Legend(title = "Group_B", col_fun = col2)
))
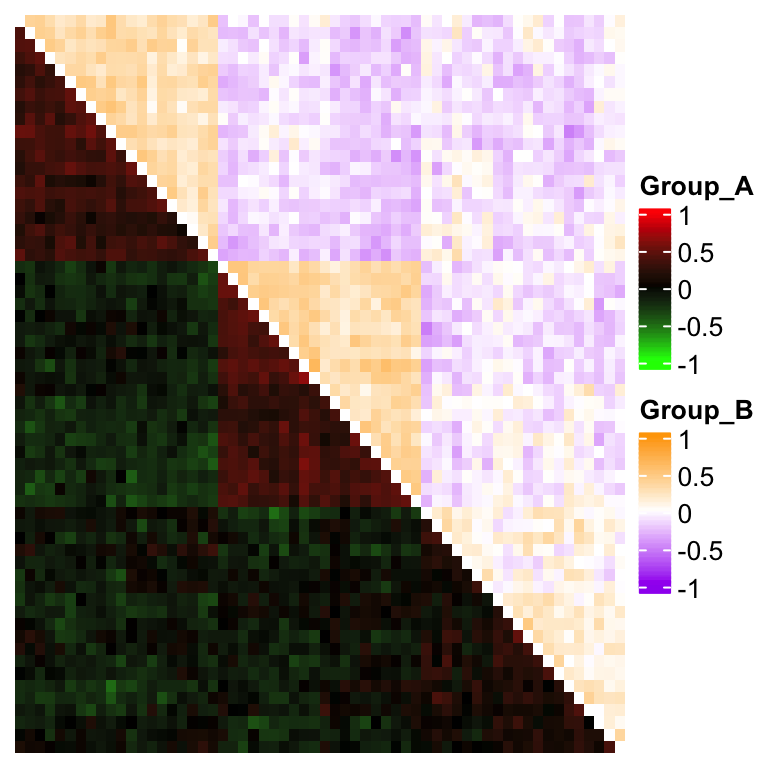
The method is the same if you want to use two color themes for a symmetric matrix:
corm = cor(mat)
col1 = colorRamp2(c(-1, 0, 1), c("green", "black", "red"))
col2 = colorRamp2(c(-1, 0, 1), c("purple", "white", "orange"))

# here reordering the symmetric matrix is necessary
od = hclust(dist(corm))$order
corm = corm[od, od]

ht = Heatmap(corm, rect_gp = gpar(type = "none"), show_heatmap_legend = FALSE,
    cluster_rows = FALSE, cluster_columns = FALSE,
    layer_fun = function(j, i, x, y, w, h, fill) {
        l = i > j
        grid.rect(x[l], y[l], w[l], h[l],
            gp = gpar(fill = col1(pindex(corm, i[l], j[l])), col = NA))
        l = i < j
        grid.rect(x[l], y[l], w[l], h[l],
            gp = gpar(fill = col2(pindex(corm, i[l], j[l])), col = NA))
    })
draw(ht, heatmap_legend_list = list(
    Legend(title = "Group_A", col_fun = col1),
    Legend(title = "Group_B", col_fun = col2)
))