Constructor Method for the Enriched Heatmap
EnrichedHeatmap.RdConstructor Method for the Enriched Heatmap
EnrichedHeatmap(mat,
    col,
    top_annotation = HeatmapAnnotation(enriched = anno_enriched()),
    row_order = order(enriched_score(mat), decreasing = TRUE),
    pos_line = TRUE,
    pos_line_gp = gpar(lty = 2),
    axis_name = NULL,
    axis_name_rot = 0,
    axis_name_gp = gpar(fontsize = 10),
    border = TRUE,
    cluster_rows = FALSE,
    row_dend_reorder = -enriched_score(mat),
    show_row_dend = FALSE,
    show_row_names = FALSE,
    heatmap_legend_param = list(),
    ...)
Arguments
| mat | A matrix which is returned by |
|---|---|
| col | Color settings. If the signals are categorical, color should be a vector with category levels as names. |
| top_annotation | A special annotation which is always put on top of the enriched heatmap and is constructed by |
| row_order | Row order. Default rows are ordered by enriched scores calculated from |
| pos_line | Whether draw vertical lines which represent the positions of |
| pos_line_gp | Graphic parameters for the position lines. |
| axis_name | Names for axis which is below the heatmap. If the targets are single points, |
| axis_name_rot | Rotation for axis names. |
| axis_name_gp | Graphic parameters for axis names. |
| border | Whether show the border of the heatmap? |
| cluster_rows | Clustering on rows are turned off by default. |
| show_row_dend | Whether show dendrograms on rows if hierarchical clustering is applied on rows? |
| row_dend_reorder | Weight for reordering the row dendrogram. It is reordered by enriched scores by default. |
| show_row_names | Whether show row names? |
| heatmap_legend_param | A list of settings for heatmap legends. |
| ... | Other arguments passed to |
Details
The enriched heatmap is essentially a normal heatmap but with several special settings. Following parameters are set with pre-defined values:
cluster_columnsenforced to be
FALSEshow_column_namesenforced to be
FALSEbottom_annotationenforced to be
NULL
EnrichedHeatmap calls Heatmap, thus, most of the
arguments in Heatmap are usable in EnrichedHeatmap such as
to apply clustering on rows, or to split rows by a data frame or k-means clustering. Users can also
add more than one heatmaps by + operator. Enriched heatmaps and normal heatmaps can be
concatenated mixed.
For detailed demonstration, please go to the vignette.
Value
A Heatmap-class object.
Examples
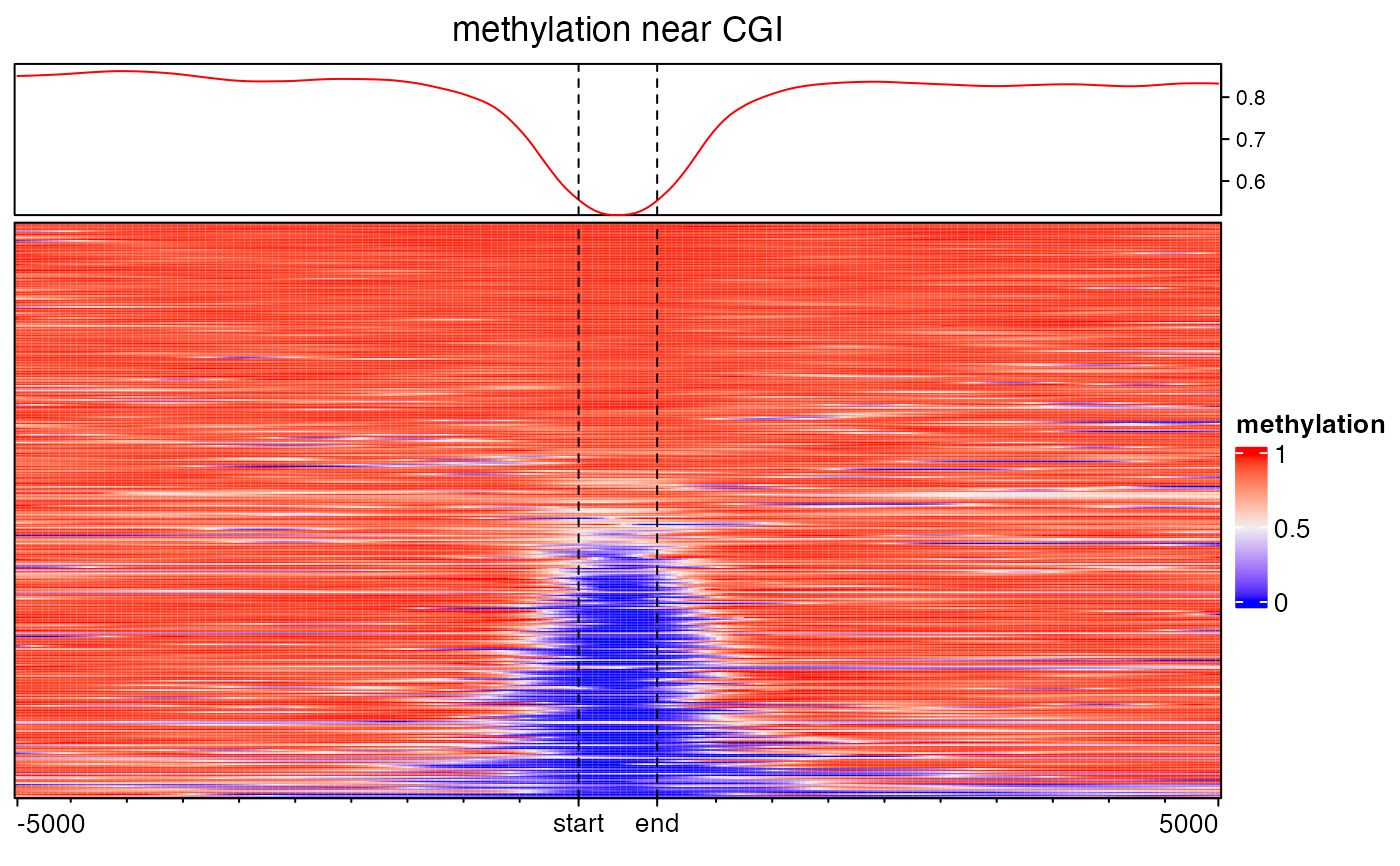
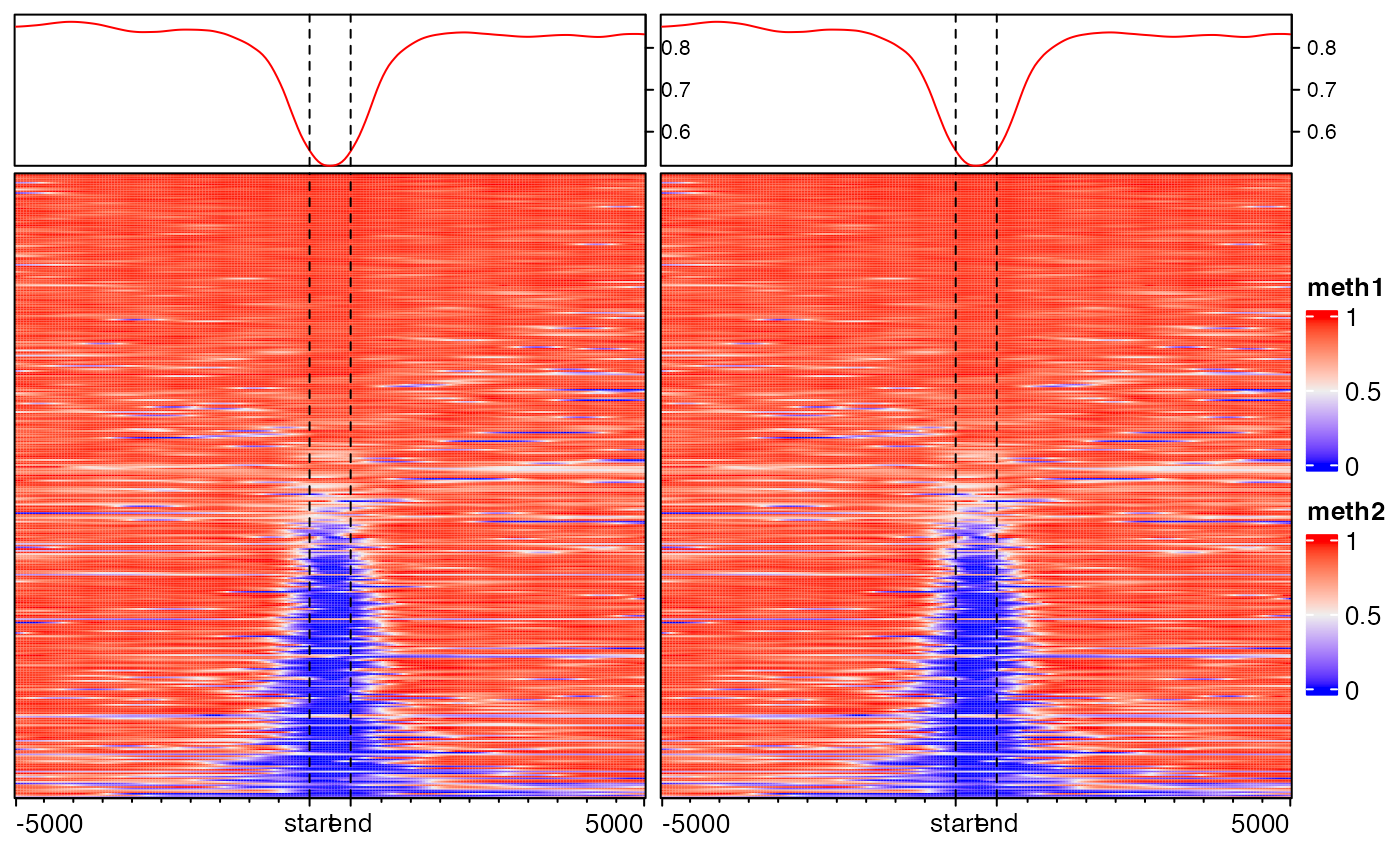
load(system.file("extdata", "chr21_test_data.RData", package = "EnrichedHeatmap"))
mat3 = normalizeToMatrix(meth, cgi, value_column = "meth", mean_mode = "absolute",
    extend = 5000, w = 50, smooth = TRUE)
EnrichedHeatmap(mat3, name = "methylation", column_title = "methylation near CGI")EnrichedHeatmap(mat3, name = "meth1") + EnrichedHeatmap(mat3, name = "meth2")# for more examples, please go to the vignette