Draw barplots
circos.barplot.RdDraw barplots
circos.barplot(value, pos, bar_width = 0.6,
    col = NA, border = "black", lwd = par("lwd"), lty = par("lty"),
    sector.index = get.current.sector.index(),
    track.index = get.current.track.index())
Arguments
| value | A numeric vector or a matrix. If it is a matrix, columns correspond to the height of bars. |
|---|---|
| pos | Positions of the bars. |
| bar_width | Width of bars. It assumes the bars locating at |
| col | Filled color of bars. |
| border | Color for the border. |
| lwd | Line width. |
| lty | Line style. |
| sector.index | Index of sector. |
| track.index | Index of track. |
Details
If the input variable is a matrix, it draws a stacked barplot.
Please note, the x-values of barplots are normally integer indices. Just be careful when initializing the circular layout.
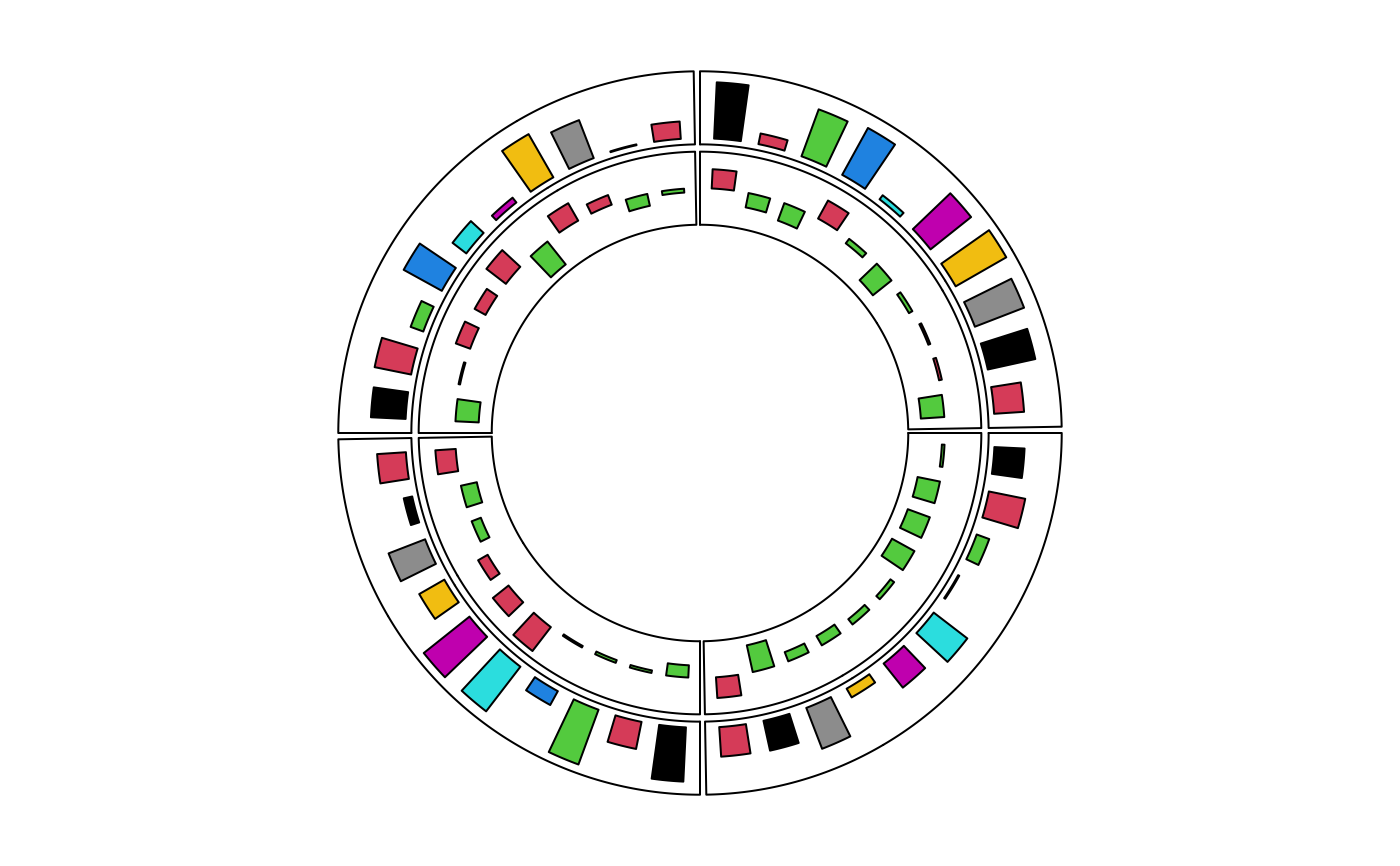
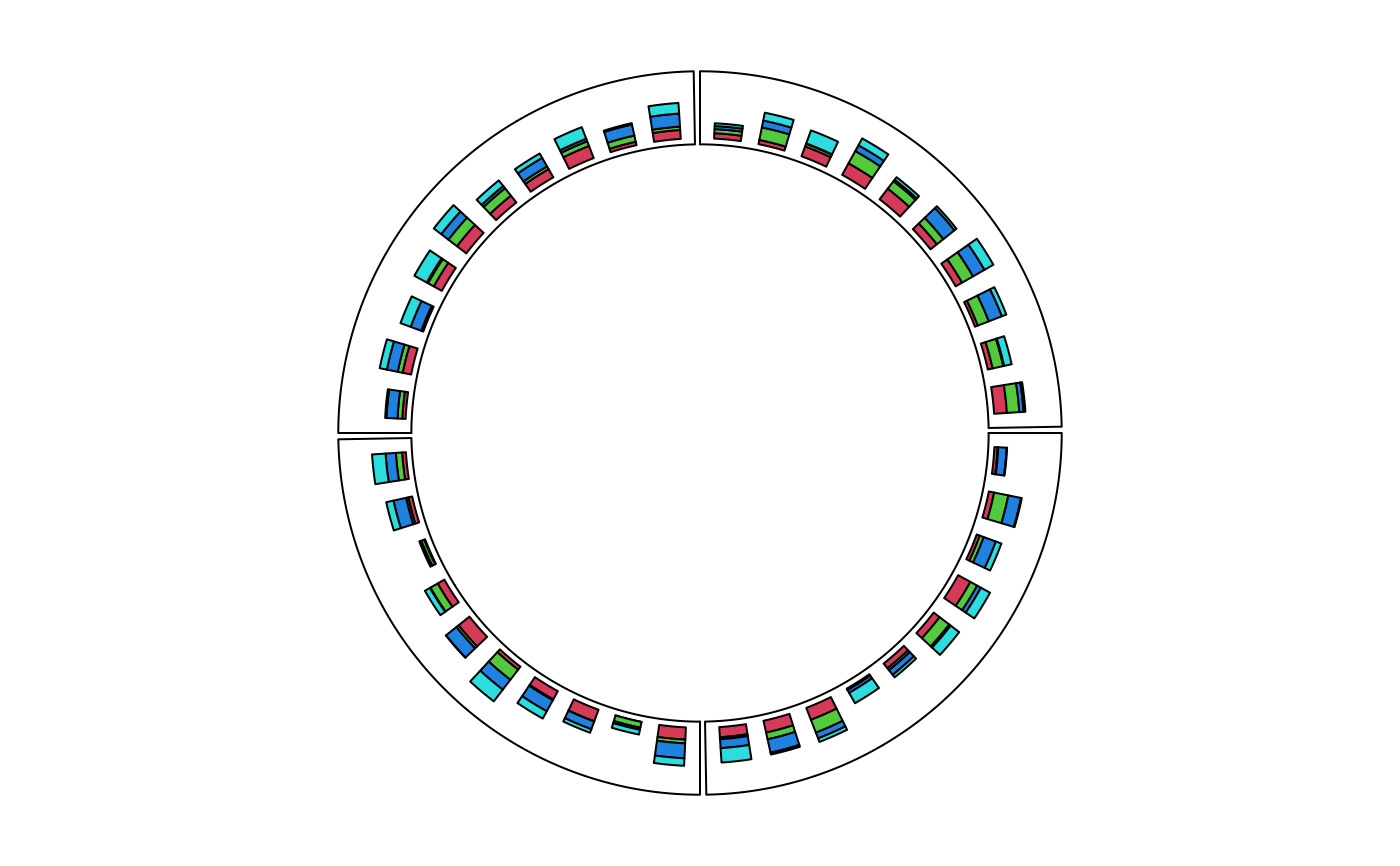
Examples
circos.track(ylim = c(0, 1), panel.fun = function(x, y) { value = runif(10) circos.barplot(value, 1:10 - 0.5, col = 1:10) })circos.track(ylim = c(-1, 1), panel.fun = function(x, y) { value = runif(10, min = -1, max = 1) circos.barplot(value, 1:10 - 0.5, col = ifelse(value > 0, 2, 3)) })circos.track(ylim = c(0, 4), panel.fun = function(x, y) { value = matrix(runif(10*4), ncol = 4) circos.barplot(value, 1:10 - 0.5, col = 2:5) })