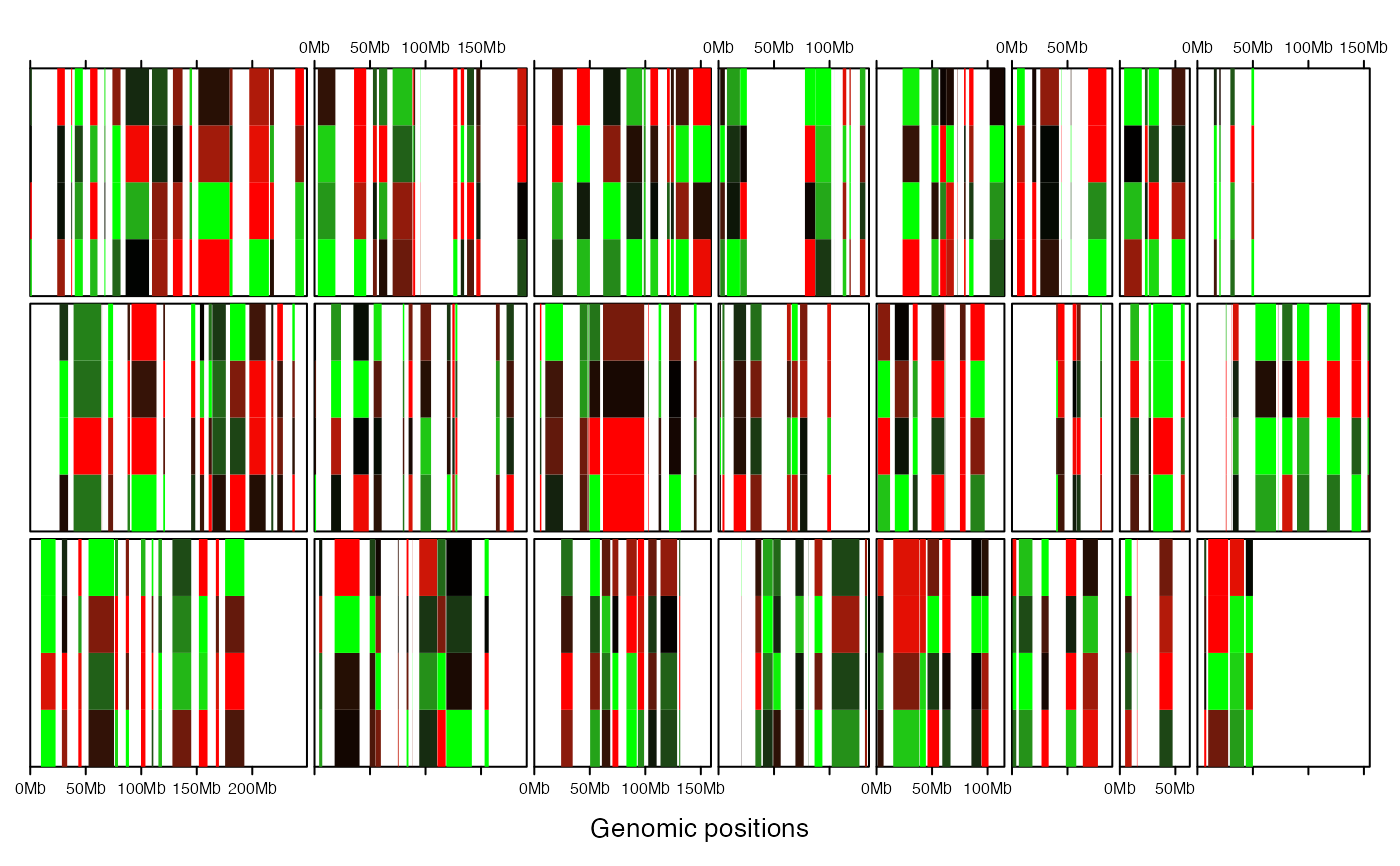
add heatmap to a new track
add_heatmap_track.Rdadd heatmap to a new track
add_heatmap_track(gr, mat, fill, border = NA, track = current_track() + 1, ...)
Arguments
| gr | genomic regions, it can be a data frame or a |
|---|---|
| mat | matrix in which rows correspond to intervals in |
| fill | a color mapping function which maps values to colors. Users can consider |
| border | border of the grids in heatmap |
| track | which track the graphics will be added to. By default it is the next track. The value should only be a scalar. |
| ... | other arguments passed to |
Value
No value is returned.
See also
Examples
require(circlize)#>#> #> #> #> #> #> #> #> #> #>bed = generateRandomBed(200) col_fun = colorRamp2(c(-1, 0, 1), c("green", "black", "red")) gtrellis_layout(nrow = 3, byrow = FALSE, track_axis = FALSE)