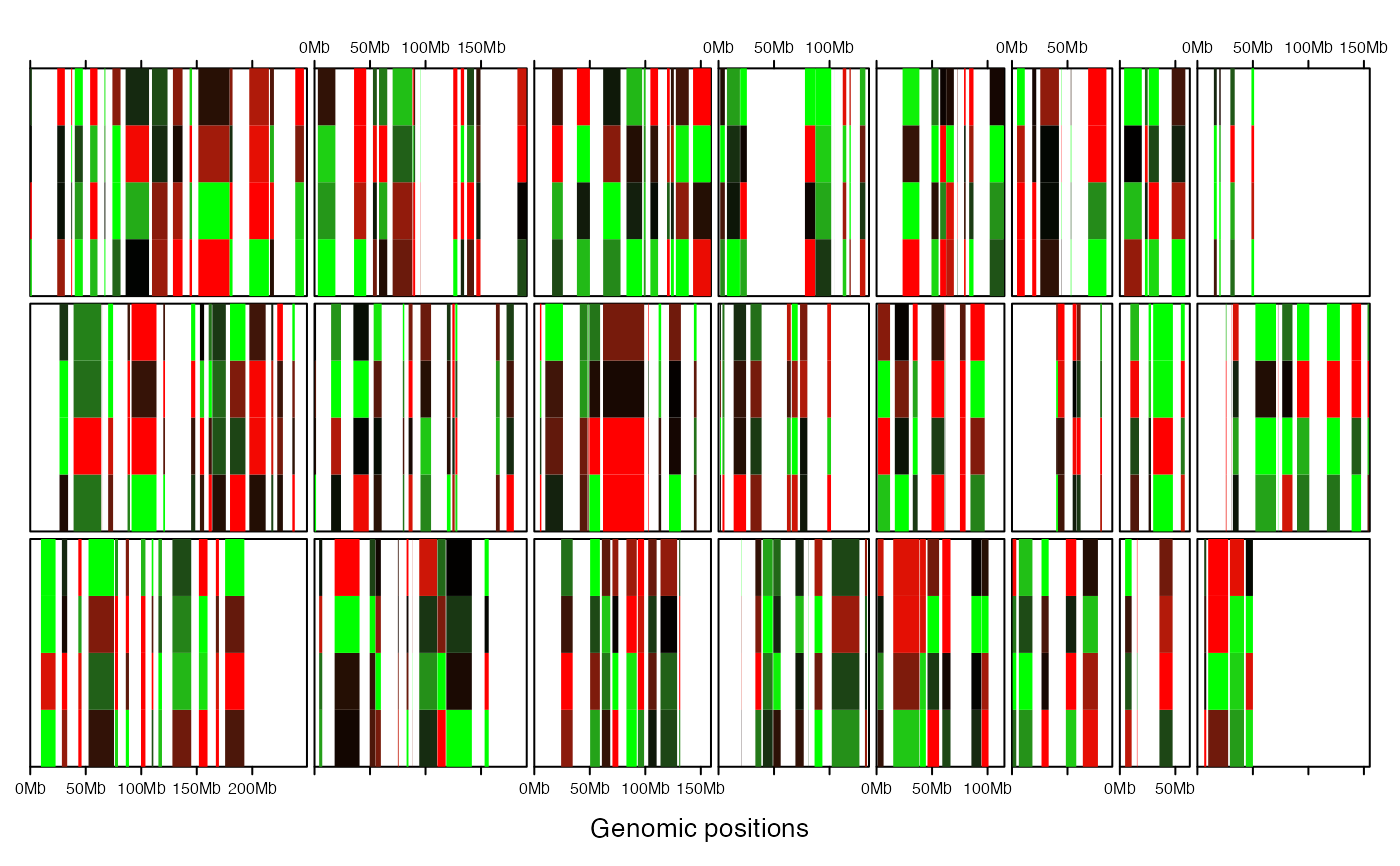
add heatmap to a new track
add_heatmap_track.rdadd heatmap to a new track
add_heatmap_track(gr, mat, fill, border = NA, track = current_track() + 1, ...)Arguments
- gr
genomic regions, it can be a data frame or a
GRangesobject- mat
matrix in which rows correspond to intervals in
gr- fill
a color mapping function which maps values to colors. Users can consider
colorRamp2to generate a color mapping function.- border
border of the grids in heatmap
- track
which track the graphics will be added to. By default it is the next track. The value should only be a scalar.
- ...
other arguments passed to
add_track
Value
No value is returned.
See also
Examples
require(circlize)
#> Loading required package: circlize
#> ========================================
#> circlize version 0.4.15
#> CRAN page: https://cran.r-project.org/package=circlize
#> Github page: https://github.com/jokergoo/circlize
#> Documentation: https://jokergoo.github.io/circlize_book/book/
#>
#> If you use it in published research, please cite:
#> Gu, Z. circlize implements and enhances circular visualization
#>   in R. Bioinformatics 2014.
#>
#> This message can be suppressed by:
#>   suppressPackageStartupMessages(library(circlize))
#> ========================================
bed = generateRandomBed(200)
col_fun = colorRamp2(c(-1, 0, 1), c("green", "black", "red"))
gtrellis_layout(nrow = 3, byrow = FALSE, track_axis = FALSE)
mat = matrix(rnorm(nrow(bed)*4), ncol = 4)
add_heatmap_track(bed, mat, fill = col_fun)