Make a Single Legend
Legend.RdMake a Single Legend
Legend(at, labels = at, col_fun, nrow = NULL, ncol = 1, by_row = FALSE,
    grid_height = unit(4, "mm"), grid_width = unit(4, "mm"), gap = unit(2, "mm"),
    labels_gp = gpar(fontsize = 10), labels_rot = 0,
    border = NULL, background = "#EEEEEE",
    type = "grid", legend_gp = gpar(),
    pch = 16, size = unit(2, "mm"),
    legend_height = NULL, legend_width = NULL,
    direction = c("vertical", "horizontal"),
    title = "", title_gp = gpar(fontsize = 10, fontface = "bold"),
    title_position = c("topleft", "topcenter", "leftcenter", "lefttop", "leftcenter-rot", "lefttop-rot"),
    title_gap = unit(1.5, "mm"))
Arguments
| at | Breaks of the legend. The values can be either numeric or character. If it is not specified, the values of |
|---|---|
| labels | Labels corresponding to |
| col_fun | A color mapping function which is used to make a continuous legend. Use |
| nrow | For legend which is represented as grids, |
| ncol | Similar as |
| by_row | Are the legend grids arranged by rows or by columns? |
| grid_height | The height of legend grid. It can also control the height of the continuous legend if it is horizontal. |
| grid_width | The width of legend grid. It can also control the width of the continuous legend if it is vertical. |
| gap | If legend grids are put into multiple rows or columns, this controls the gap between neighbouring rows or columns, measured as a |
| labels_gp | Graphic parameters for labels. |
| labels_rot | Text rotation for labels. It should only be used for horizontal continuous legend. |
| border | Color of legend grid borders. It also works for the ticks in the continuous legend. |
| background | Background colors for the grids. It is used when points and lines are the legend graphics. |
| type | Type of legends. The value can be one of |
| legend_gp | Graphic parameters for the legend grids. You should control the filled color of the legend grids by |
| pch | Type of points if points are used as legend. Note you can use single-letter as pch, e.g. |
| size | Size of points. |
| legend_height | Height of the whole legend body. It is only used for vertical continous legend. |
| legend_width | Width of the whole legend body. It is only used for horizontal continous legend. |
| direction | Direction of the legend, vertical or horizontal? |
| title | Title of the legend. |
| title_gp | Graphic parameters of the title. |
| title_position | Position of title relative to the legend. |
| title_gap | Gap between title and the legend body. |
Details
Most of the argument can also be set in heatmap_legend_param argument in Heatmap or annotation_legend_param
argument in HeatmapAnnotation to configure legend styles for heatmap and annotations.
See also
packLegend packs multiple legends into one Legends-class object.
See examples of configuring legends: https://jokergoo.github.io/ComplexHeatmap-reference/book/legends.html
Value
A Legends-class object.
Examples
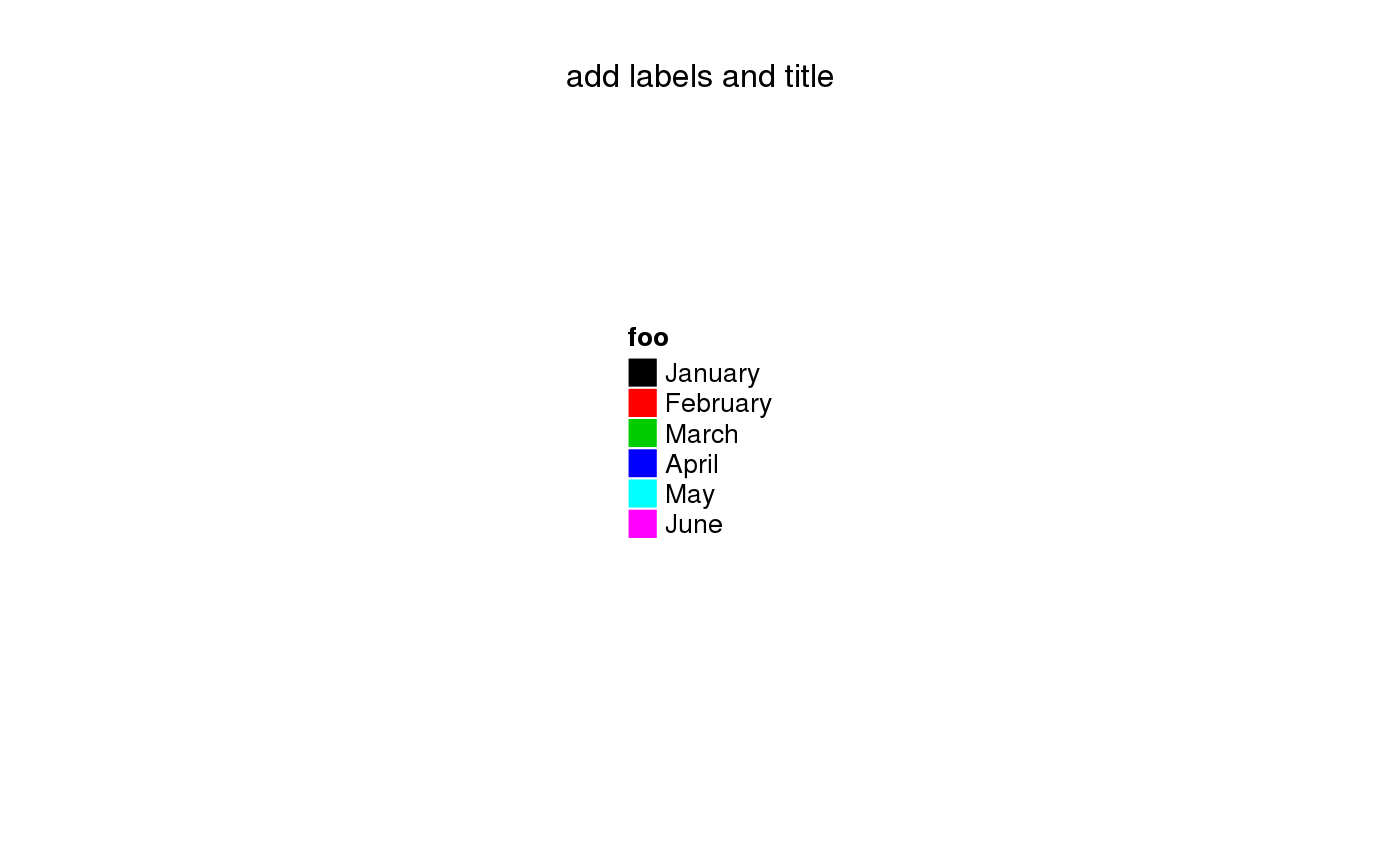
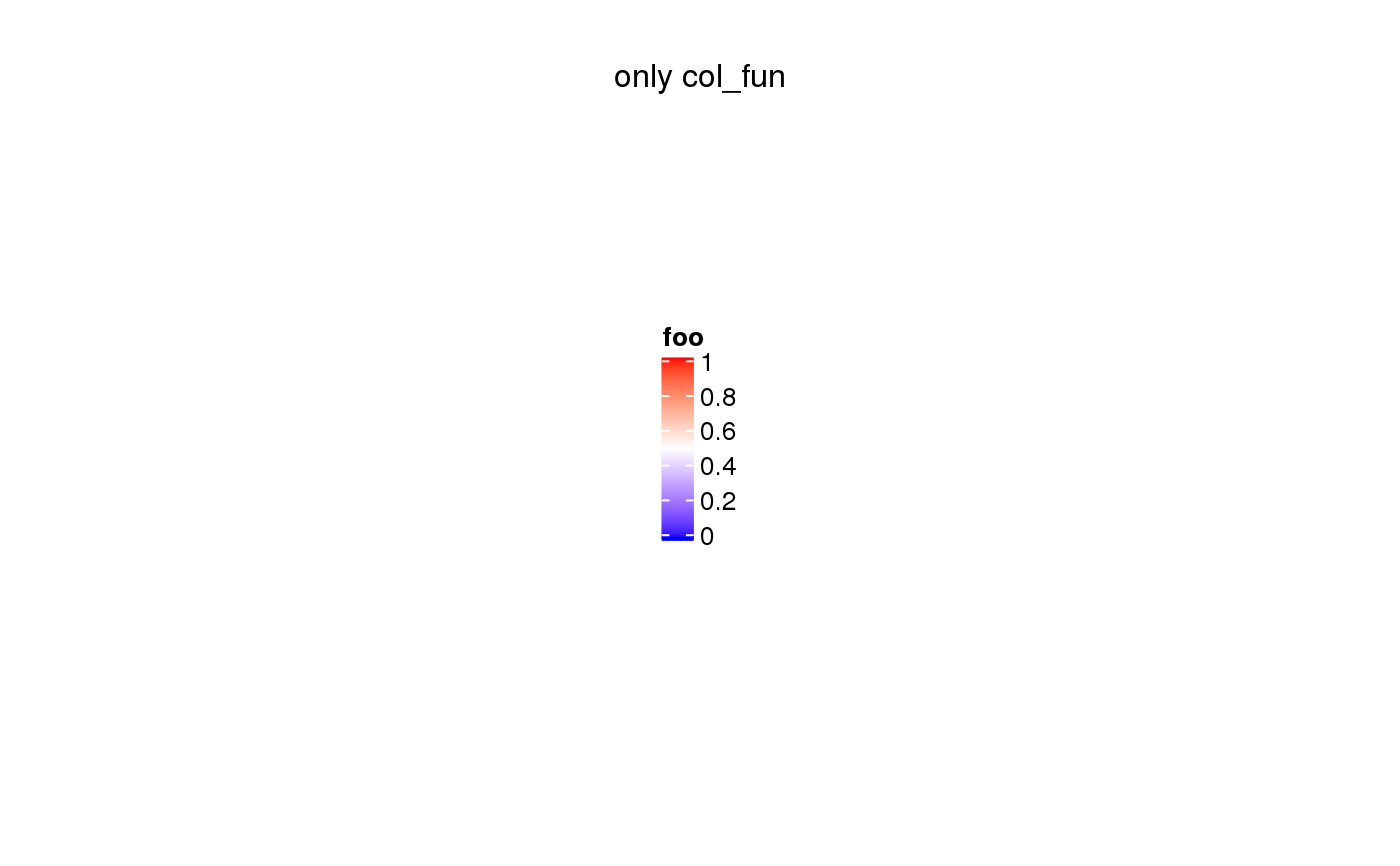
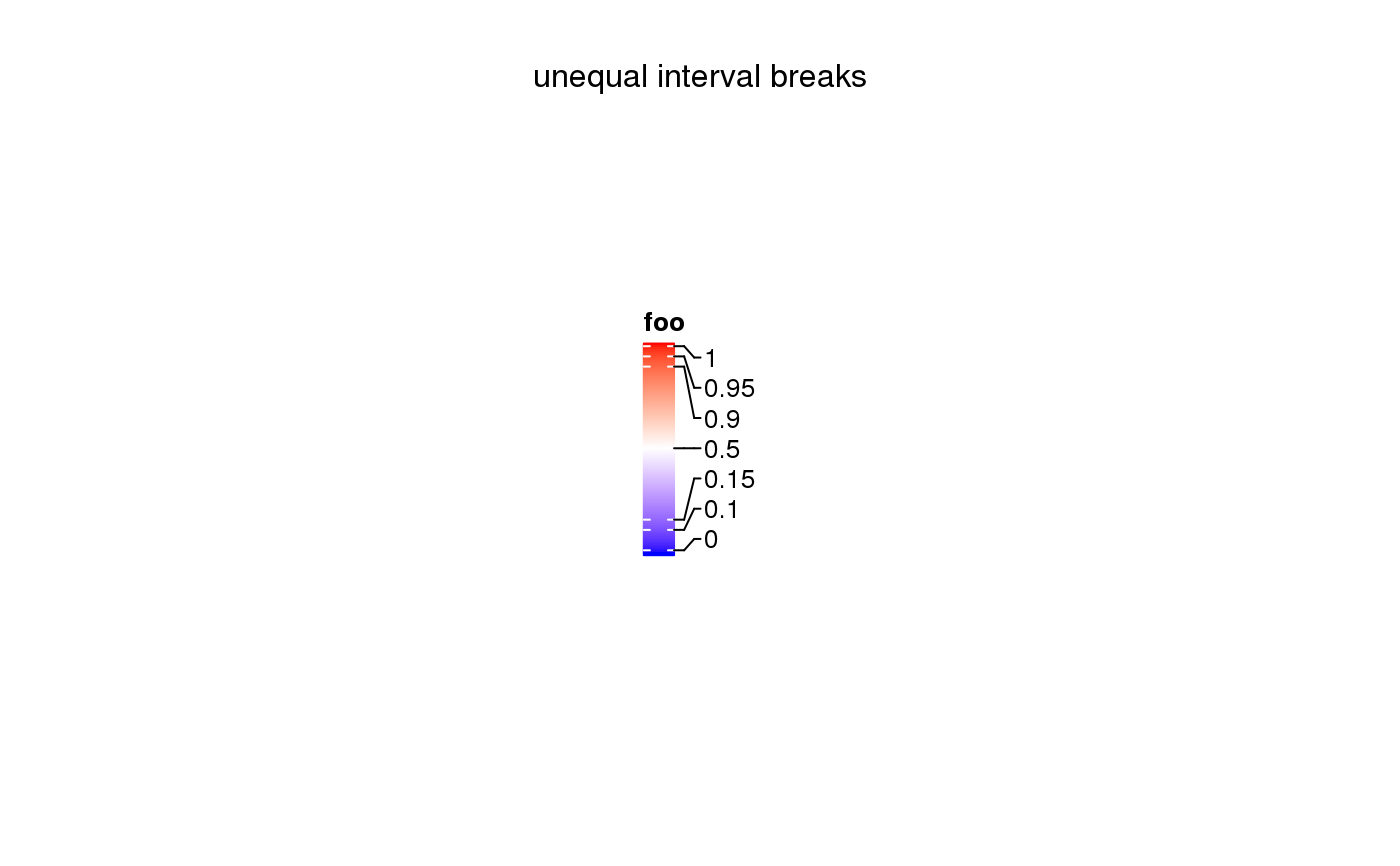
lgd = Legend(labels = month.name[1:6], title = "foo", legend_gp = gpar(fill = 1:6)) draw(lgd, test = "add labels and title")require(circlize) col_fun = colorRamp2(c(0, 0.5, 1), c("blue", "white", "red")) lgd = Legend(col_fun = col_fun, title = "foo") draw(lgd, test = "only col_fun")col_fun = colorRamp2(c(0, 0.5, 1), c("blue", "white", "red")) lgd = Legend(col_fun = col_fun, title = "foo", at = c(0, 0.1, 0.15, 0.5, 0.9, 0.95, 1)) draw(lgd, test = "unequal interval breaks")