Make the UpSet plot
UpSet.RdMake the UpSet plot
UpSet(m,
    comb_col = "black",
    pt_size = unit(3, "mm"), lwd = 2,
    bg_col = "#F0F0F0", bg_pt_col = "#CCCCCC",
    set_order = order(set_size(m), decreasing = TRUE),
    comb_order = if(attr(m, "set_on_rows")) {
    order.comb_mat(m[set_order, ], decreasing = TRUE)
    } else {
    order.comb_mat(m[, set_order], decreasing = TRUE)
    },
    top_annotation = upset_top_annotation(m),
    right_annotation = upset_right_annotation(m),
    row_names_side = "left",
    ...)
Arguments
| m | A combination matrix returned by |
|---|---|
| comb_col | The color for the dots representing combination sets. |
| pt_size | The point size for the dots representing combination sets. |
| lwd | The line width for the combination sets. |
| bg_col | Color for the background rectangles. |
| bg_pt_col | Color for the dots representing the set is not selected. |
| set_order | The order of sets. |
| comb_order | The order of combination sets. |
| top_annotation | A |
| right_annotation | A |
| row_names_side | The side of row names. |
| ... | Other arguments passed to |
Details
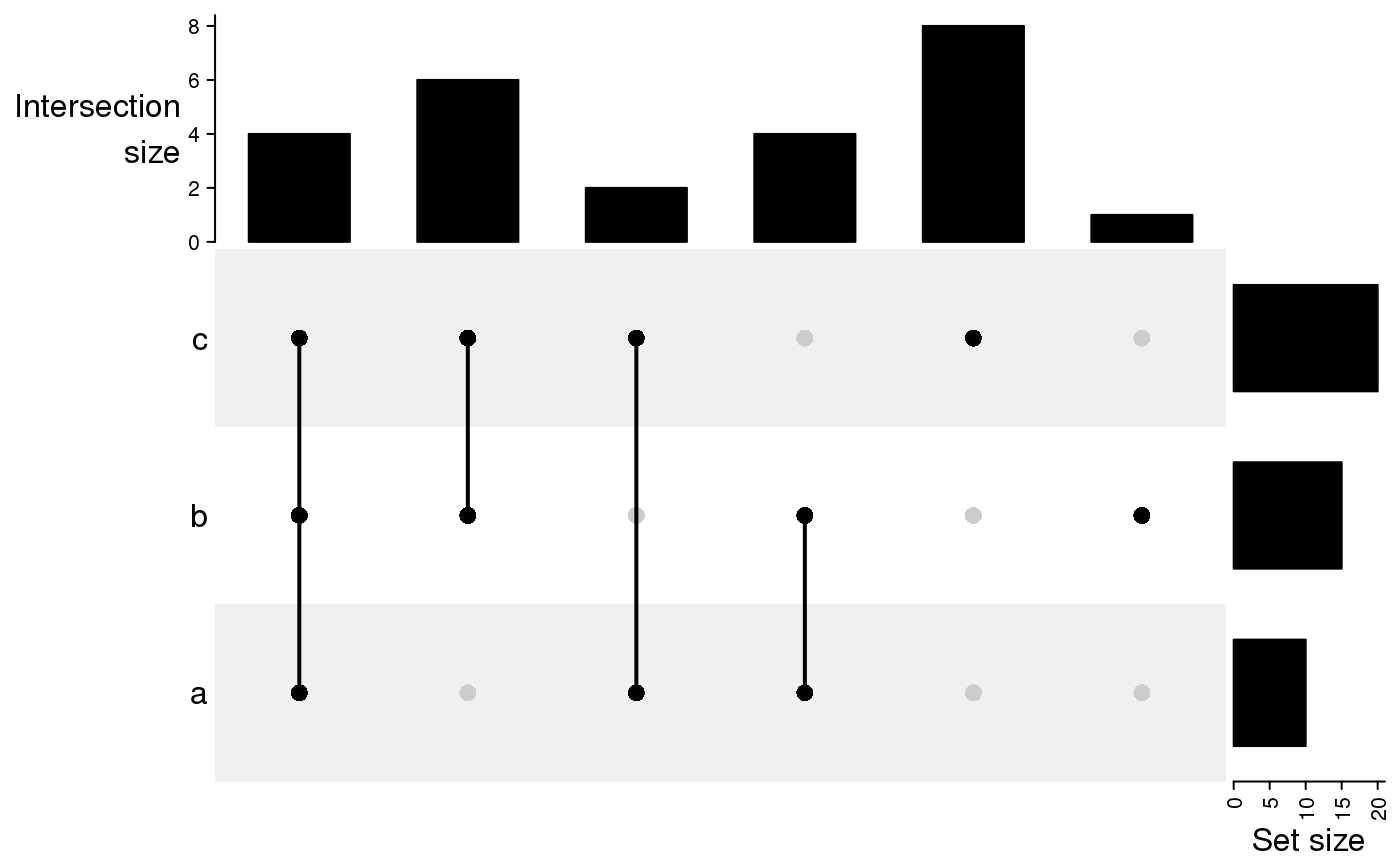
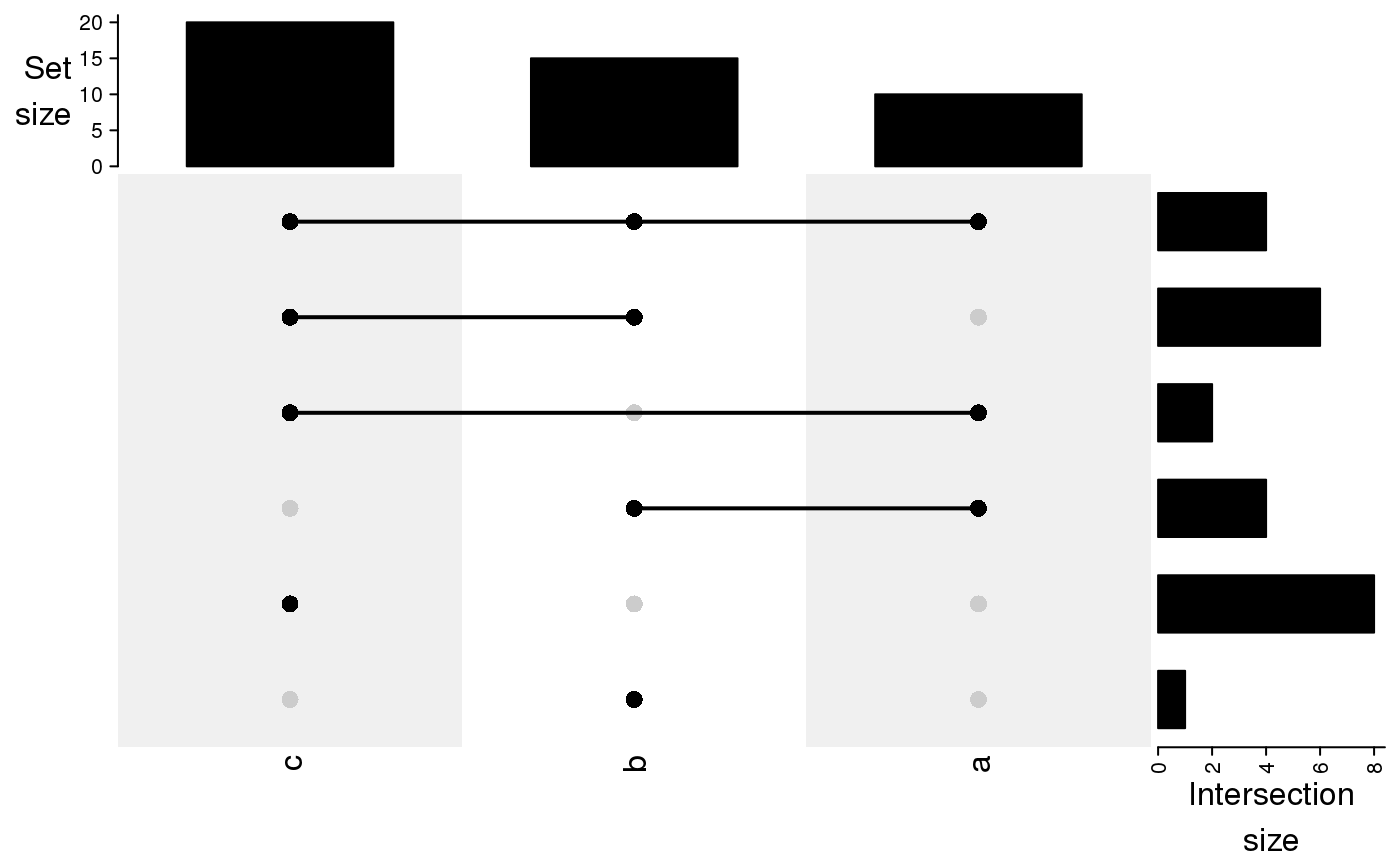
By default, the sets are on rows and combination sets are on columns. The positions of the two types of sets can be switched by transposing the matrix.
When sets are on rows, the default top annotation is the barplot showing the size of each
combination sets and the default right annotation is the barplot showing the size of the sets.
The annotations are simply constructed by HeatmapAnnotation and anno_barplot with some
parameters pre-set. Users can check the source code of upset_top_annotation and
upset_right_annotation to find out how the annotations are defined.
To change or to add annotations, users just need to define a new HeatmapAnnotation object.
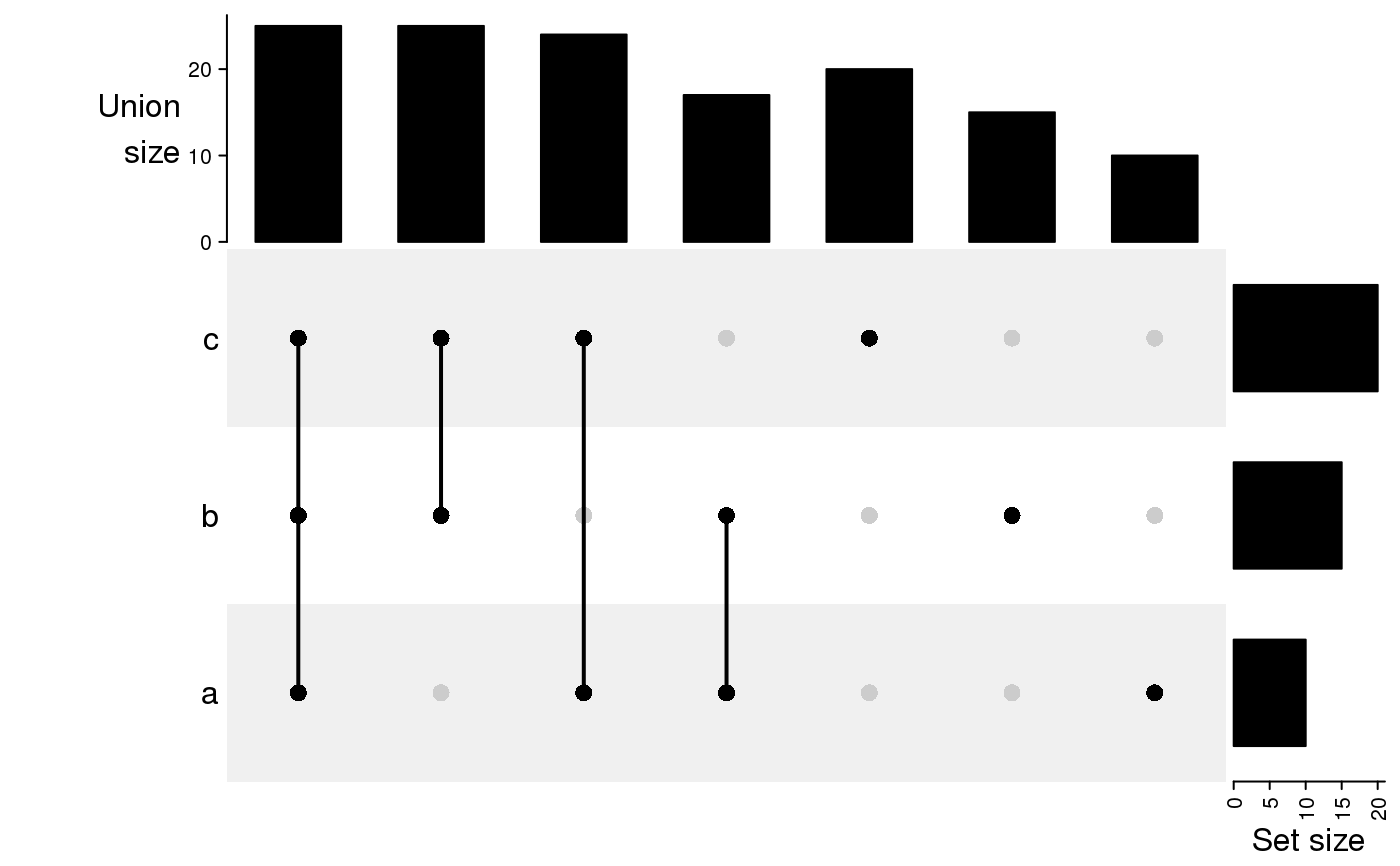
E.g. if we want to change the side of the axis and name on top annotation:
    Upset(..., top_annotation =
        HeatmapAnnotation(
           "Intersection size" = anno_barplot(
               comb_size(m),
               border = FALSE,
               gp = gpar(fill = "black"),
               height = unit(2, "cm"),
               axis_param = list(side = "right")
           ),
           annotation_name_side = "right",
           annotation_name_rot = 0)
    )
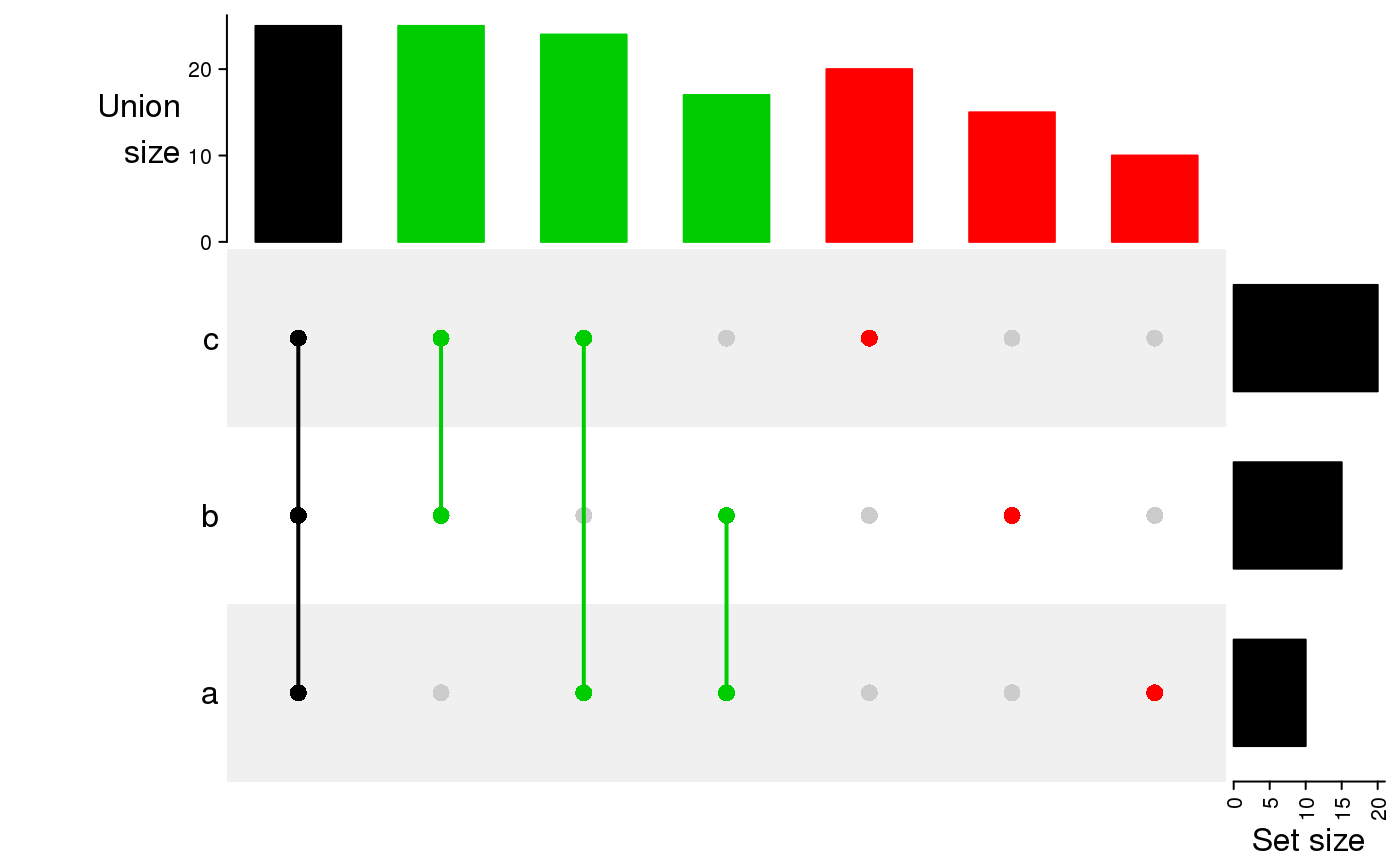
To add more annotations on top, users just add it in HeatmapAnnotation:
    Upset(..., top_annotation =
        HeatmapAnnotation(
           "Intersection size" = anno_barplot(
               comb_size(m),
               border = FALSE,
               gp = gpar(fill = "black"),
               height = unit(2, "cm"),
               axis_param = list(side = "right")
           ),
           "anno1" = anno_points(...),
           "anno2" = some_vector,
           annotation_name_side = "right",
           annotation_name_rot = 0)
    )
And so is for the right annotations.
UpSet returns a Heatmap-class object, which means, you can add it with other heatmaps and annotations
by + or %v%.
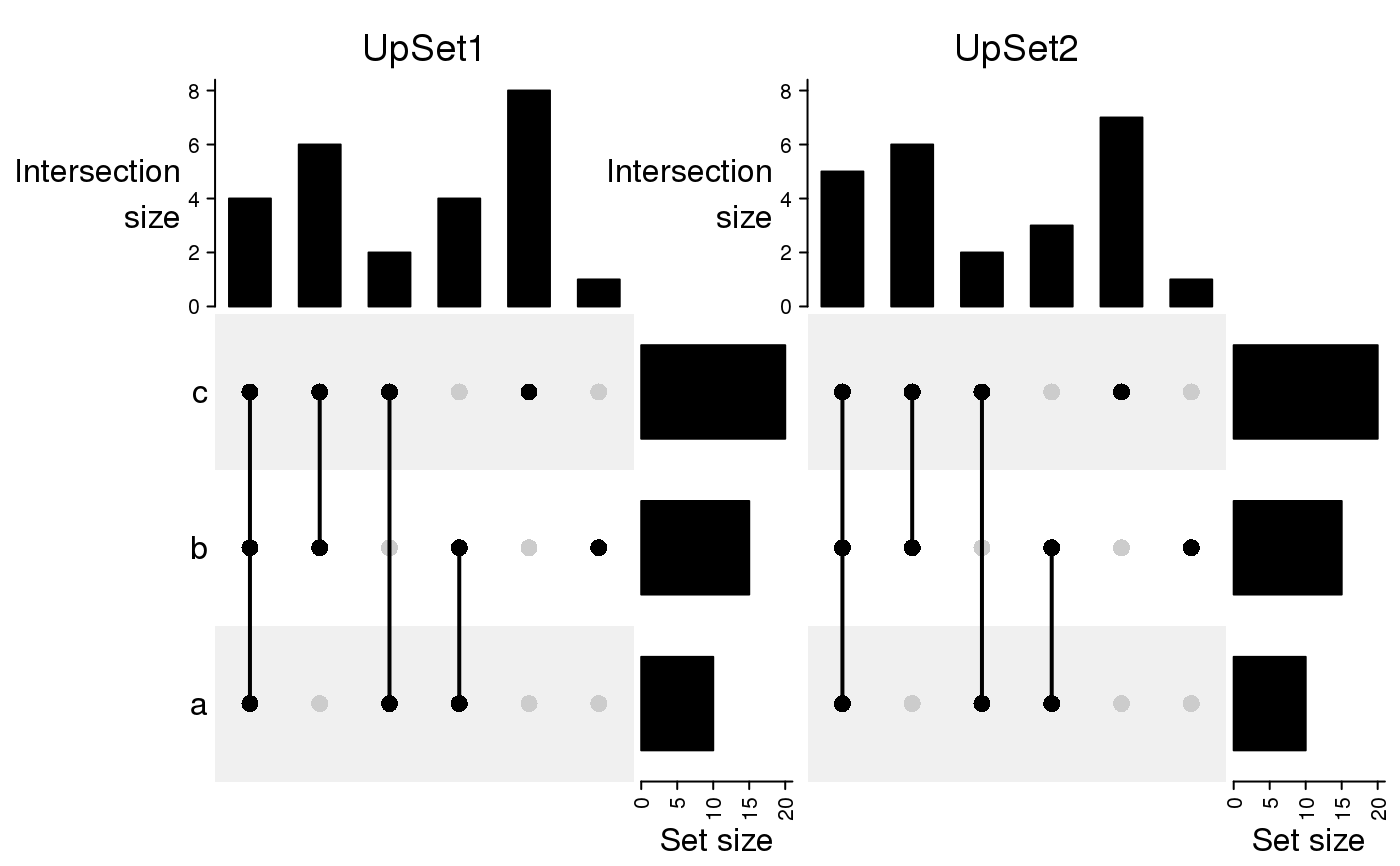
Examples
set.seed(123) lt = list(a = sample(letters, 10), b = sample(letters, 15), c = sample(letters, 20)) m = make_comb_mat(lt) UpSet(m)# compare two UpSet plots set.seed(123) lt1 = list(a = sample(letters, 10), b = sample(letters, 15), c = sample(letters, 20)) m1 = make_comb_mat(lt1) set.seed(456) lt2 = list(a = sample(letters, 10), b = sample(letters, 15), c = sample(letters, 20)) m2 = make_comb_mat(lt2) max1 = max(c(set_size(m1), set_size(m2))) max2 = max(c(comb_size(m1), comb_size(m2))) UpSet(m1, top_annotation = upset_top_annotation(m1, ylim = c(0, max2)), right_annotation = upset_right_annotation(m1, ylim = c(0, max1)), column_title = "UpSet1") + UpSet(m2, top_annotation = upset_top_annotation(m2, ylim = c(0, max2)), right_annotation = upset_right_annotation(m2, ylim = c(0, max1)), column_title = "UpSet2")