Decorate Heatmap Annotation
decorate_annotation.RdDecorate Heatmap Annotation
decorate_annotation(annotation, code, slice = 1, envir = new.env(parent = parent.frame()))
Arguments
| annotation | Name of the annotation. |
|---|---|
| code | Code that adds graphics in the selected heatmap annotation. |
| slice | Index of the row slices or the column slice in the heatmap. |
| envir | Where to look for variables inside |
Details
There is a viewport for every column annotation and row annotation.
This function contructs the name of the viewport,
goes to the viewport by seekViewport, runs code
to that viewport, and finally goes back to the original viewport.
Value
The function returns no value.
See also
Examples
set.seed(123)
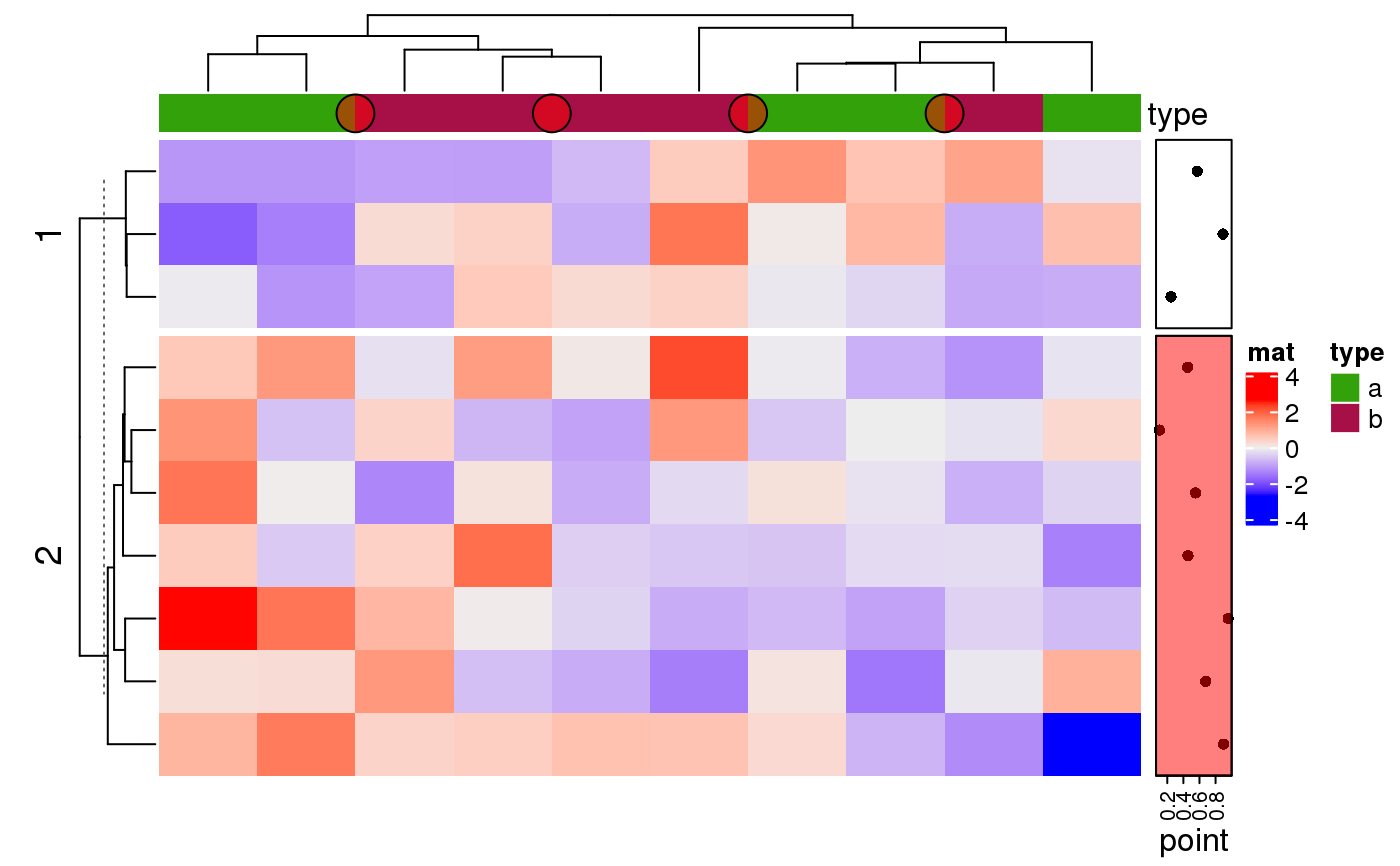
ha1 = HeatmapAnnotation(df = data.frame(type = rep(letters[1:2], 5)))
ha2 = rowAnnotation(point = anno_points(runif(10), which = "row"))
Heatmap(matrix(rnorm(100), 10), name = "mat", km = 2,
    top_annotation = ha1) + ha2decorate_annotation("type", {
    grid.circle(x = unit(c(0.2, 0.4, 0.6, 0.8), "npc"),
        gp = gpar(fill = "#FF000080"))
})decorate_annotation("point", {
    grid.rect(gp = gpar(fill = "#FF000080"))
}, slice = 2)
