Draw a Single Boxplot
grid.boxplot.RdDraw a Single Boxplot
grid.boxplot(value, pos, outline = TRUE, box_width = 0.6,
    pch = 1, size = unit(2, "mm"), gp = gpar(fill = "#CCCCCC"),
    direction = c("vertical", "horizontal"))
Arguments
| value | A vector of numeric values. |
|---|---|
| pos | Position of the boxplot. |
| outline | Whether draw outlines? |
| box_width | width of the box. |
| pch | Point type. |
| size | Point size. |
| gp | Graphic parameters. |
| direction | Whether the box is vertical or horizontal. |
Details
All the values are measured with native coordinate.
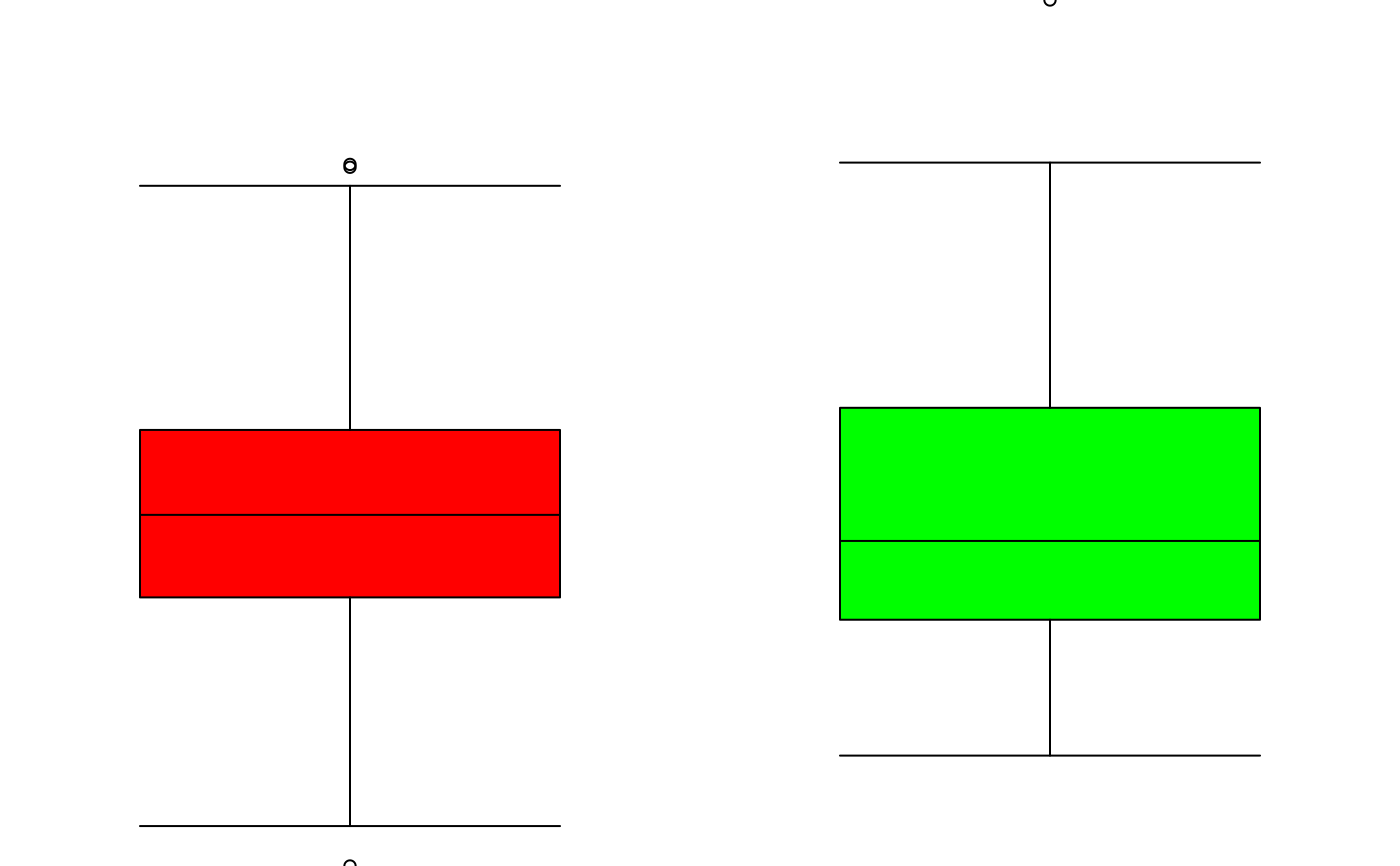
Examples
lt = list(rnorm(100), rnorm(100))
grid.newpage()
pushViewport(viewport(xscale = c(0.5, 2.5), yscale = range(lt)))grid.boxplot(lt[[1]], pos = 1, gp = gpar(fill = "red"))grid.boxplot(lt[[2]], pos = 2, gp = gpar(fill = "green"))popViewport()