Draw the Dendrogram
grid.dendrogram.RdDraw the Dendrogram
grid.dendrogram(dend, ..., test = FALSE)
Arguments
| dend | A |
|---|---|
| ... | Pass to |
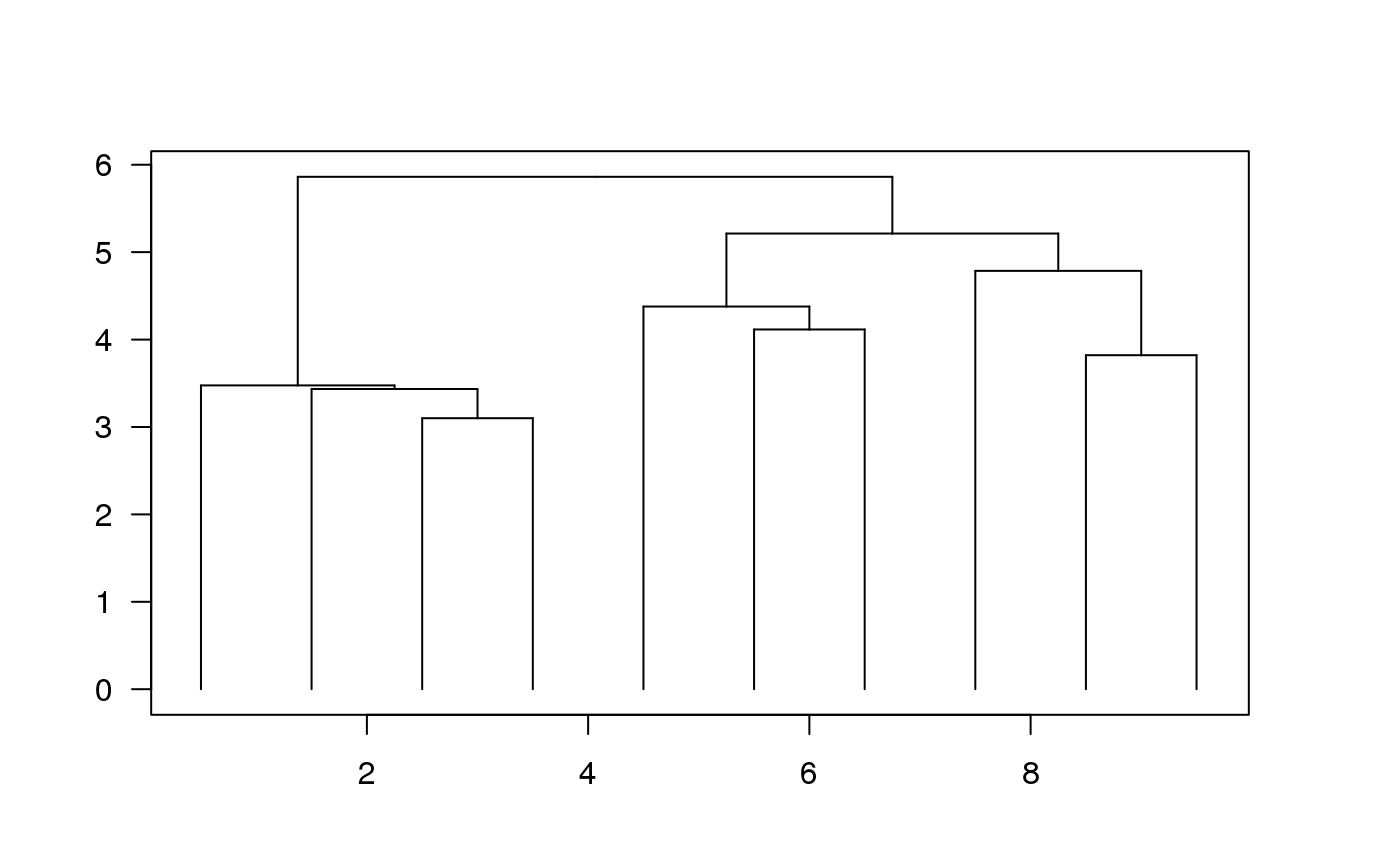
| test | Is it in test mode? If it is in test mode, a viewport is created by calculating proper xlim and ylim. |
Details
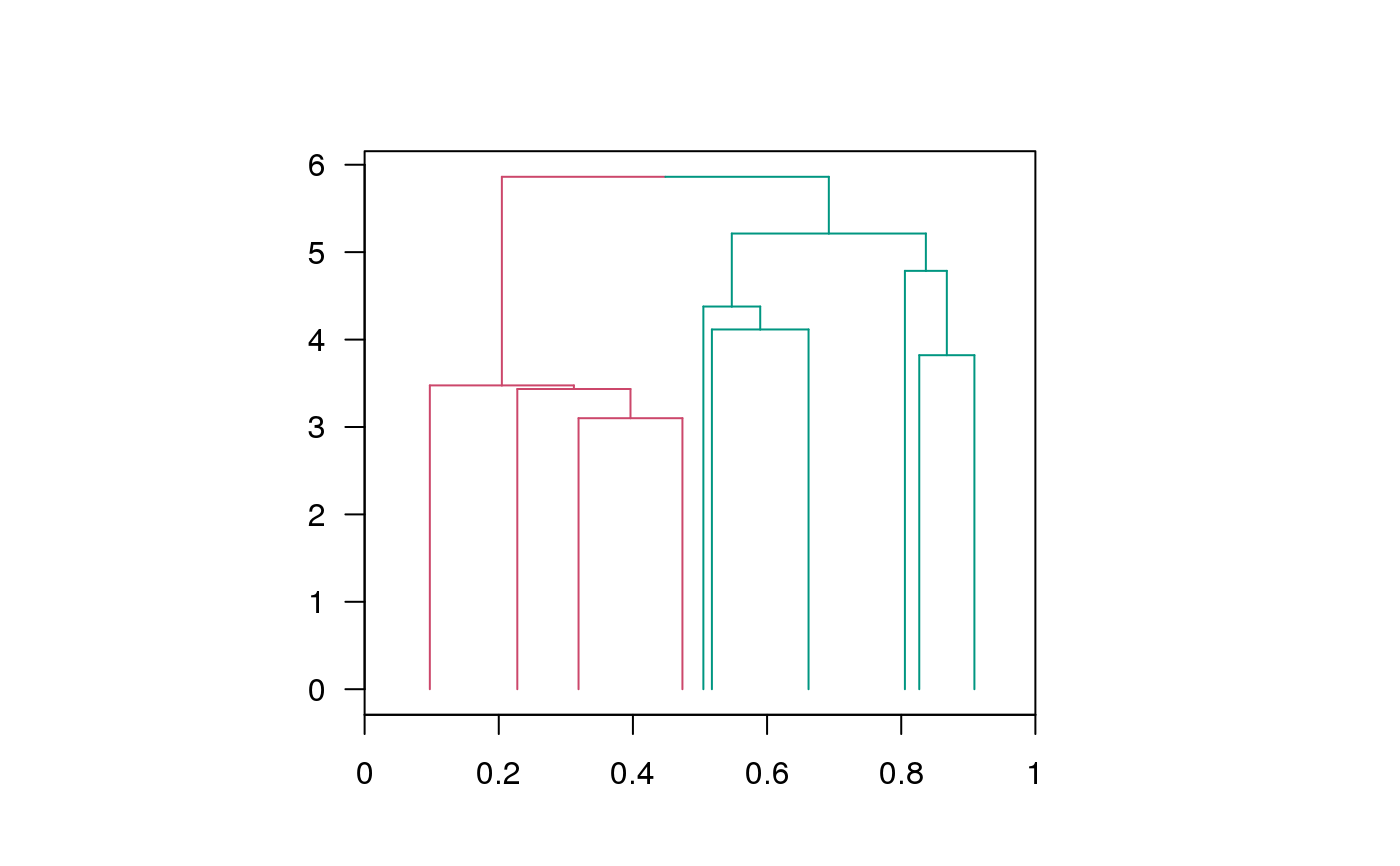
grid.dendrogram supports drawing dendrograms with self-defind leaf positions. The positions
of leaves can be defined by adjust_dend_by_x. Also the dendrogram can be customized by setting
the edgePar attribute for each node (basically for controlling the style of segments), e.g.
by color_branches.
To draw the dendrogram, a viewport should be firstly created. dend_xy can be used to get the
positions of leaves and height of the dendrogram.
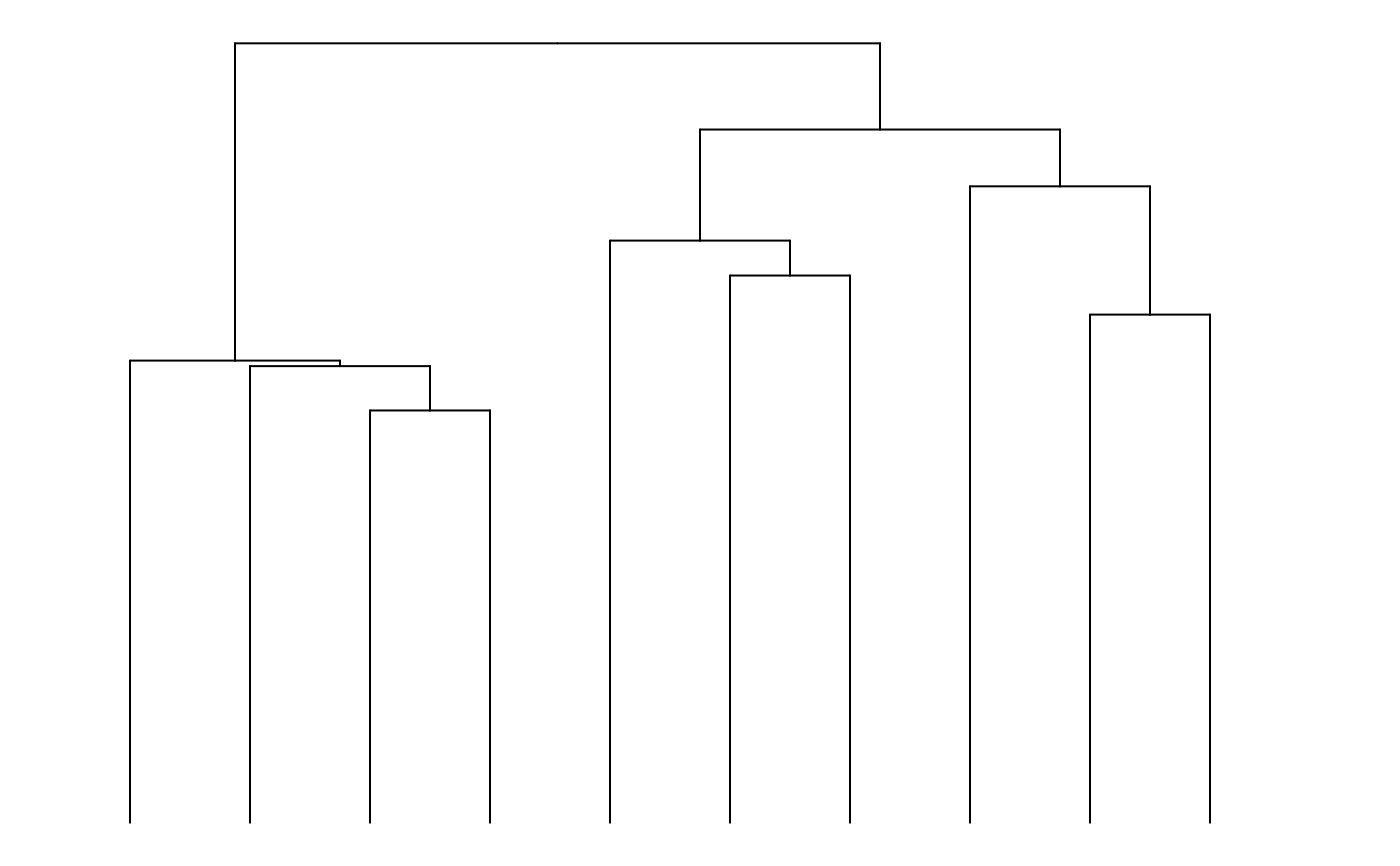
Examples
m = matrix(rnorm(100), 10) dend = as.dendrogram(hclust(dist(m))) grid.newpage() pushViewport(viewport(xscale = c(0, 10.5), yscale = c(0, dend_heights(dend)), width = 0.9, height = 0.9))grid.dendrogram(dend)popViewport()grid.dendrogram(dend, test = TRUE)require(dendextend)#>#> #> #> #> #> #> #> #> #> #> #> #> #>#> #>#> #> #>dend = color_branches(dend, k = 2) dend = adjust_dend_by_x(dend, unit(sort(runif(10)*10), "cm")) grid.dendrogram(dend, test = TRUE)