Adjust positions of rectanglar shapes
smartAlign2.RdAdjust positions of rectanglar shapes
smartAlign2(start, end, range, range_fixed = TRUE)
Arguments
| start | position which corresponds to the start (bottom or left) of the rectangle-shapes. |
|---|---|
| end | position which corresponds to the end (top or right) of the rectanglar shapes. |
| range | data ranges (the minimal and maximal values) |
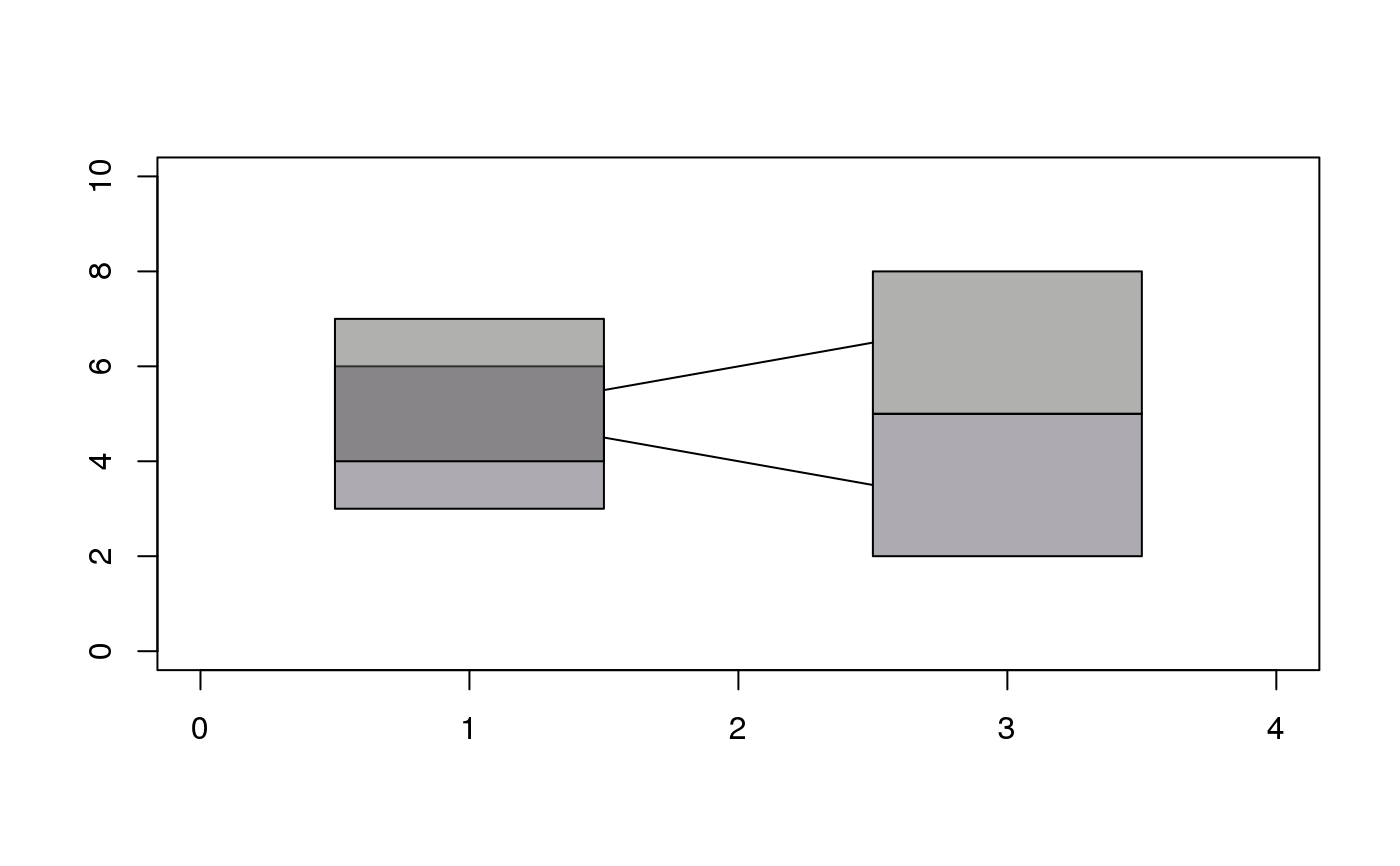
| range_fixed | Whether the range is fixed for |
Details
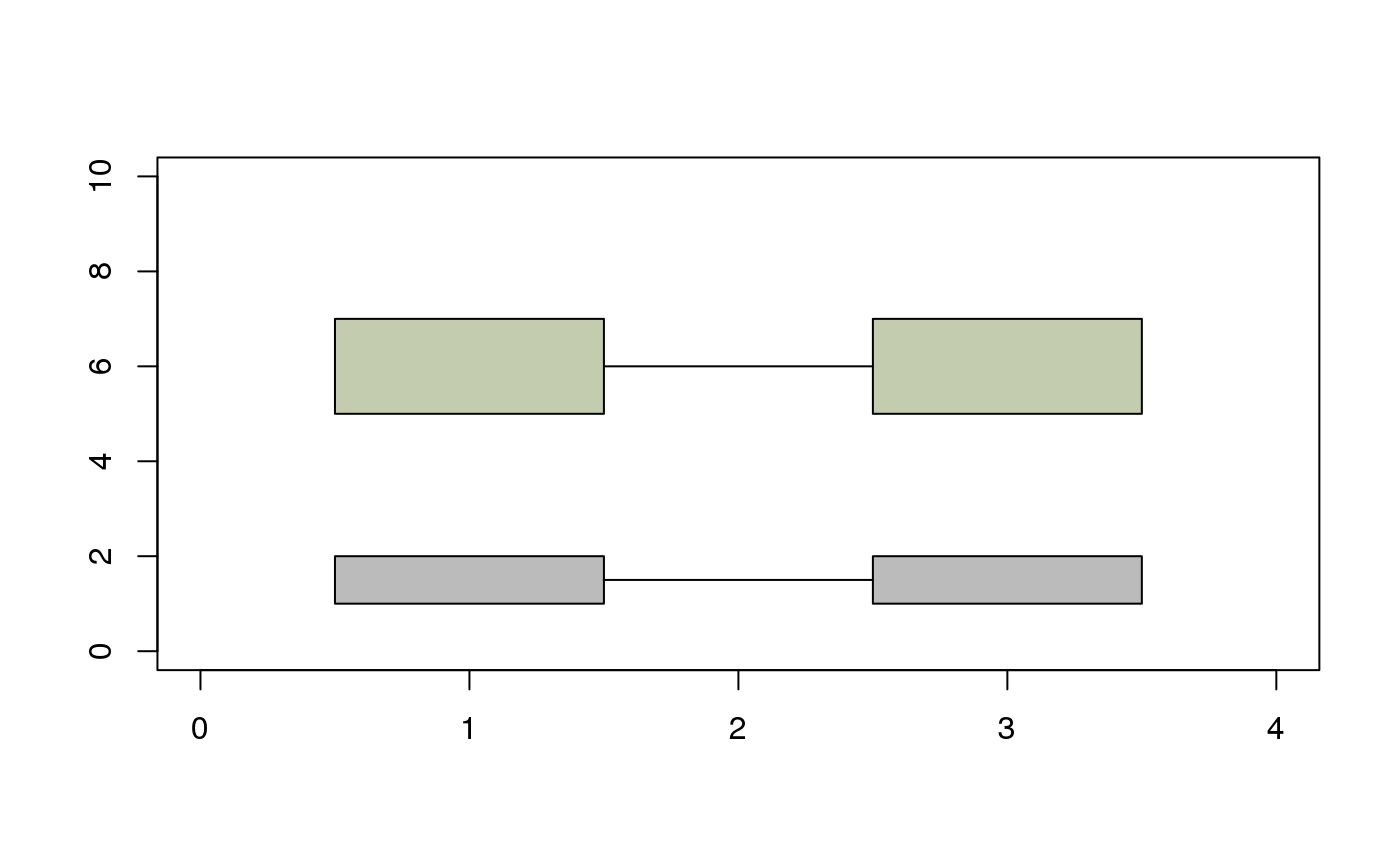
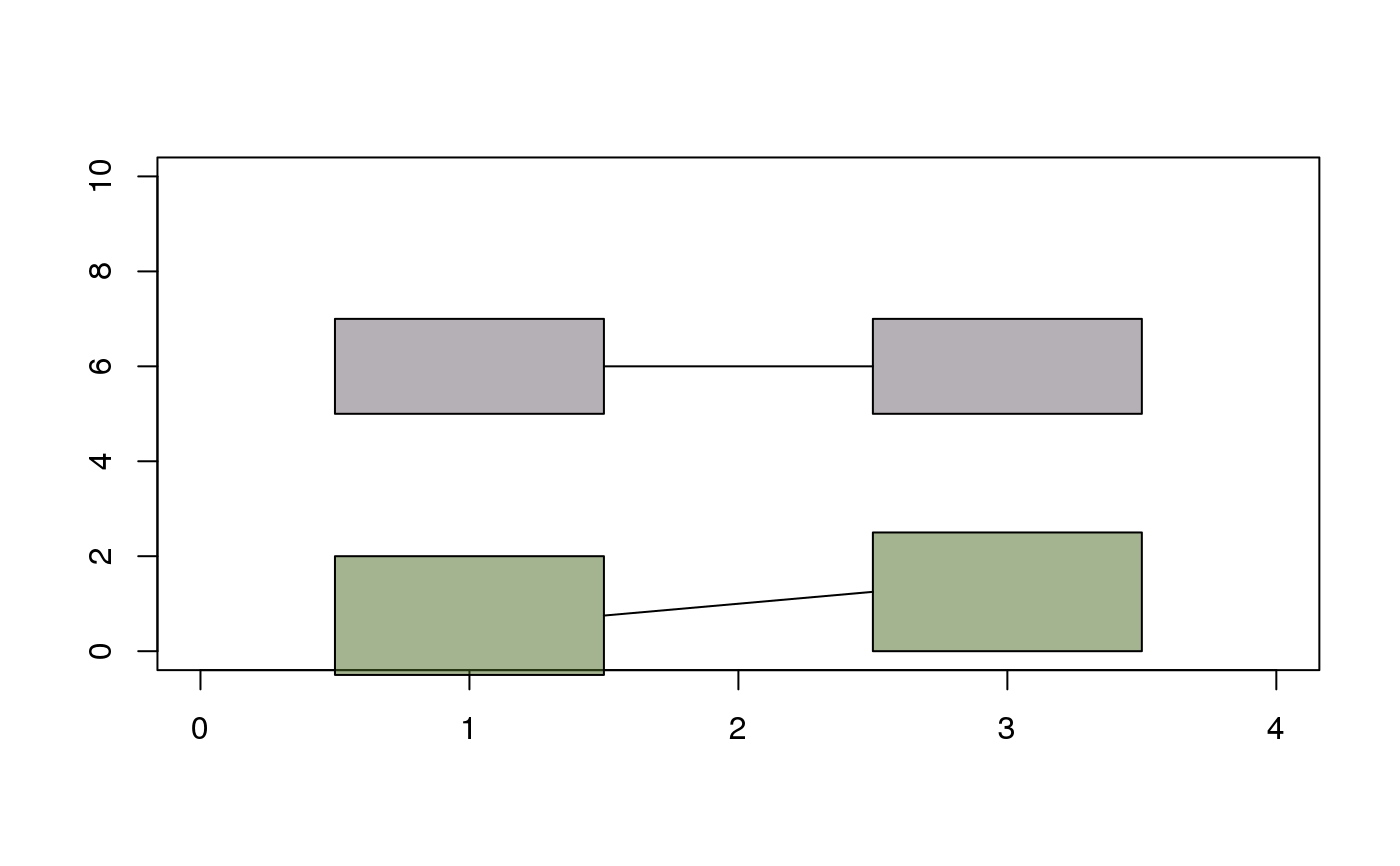
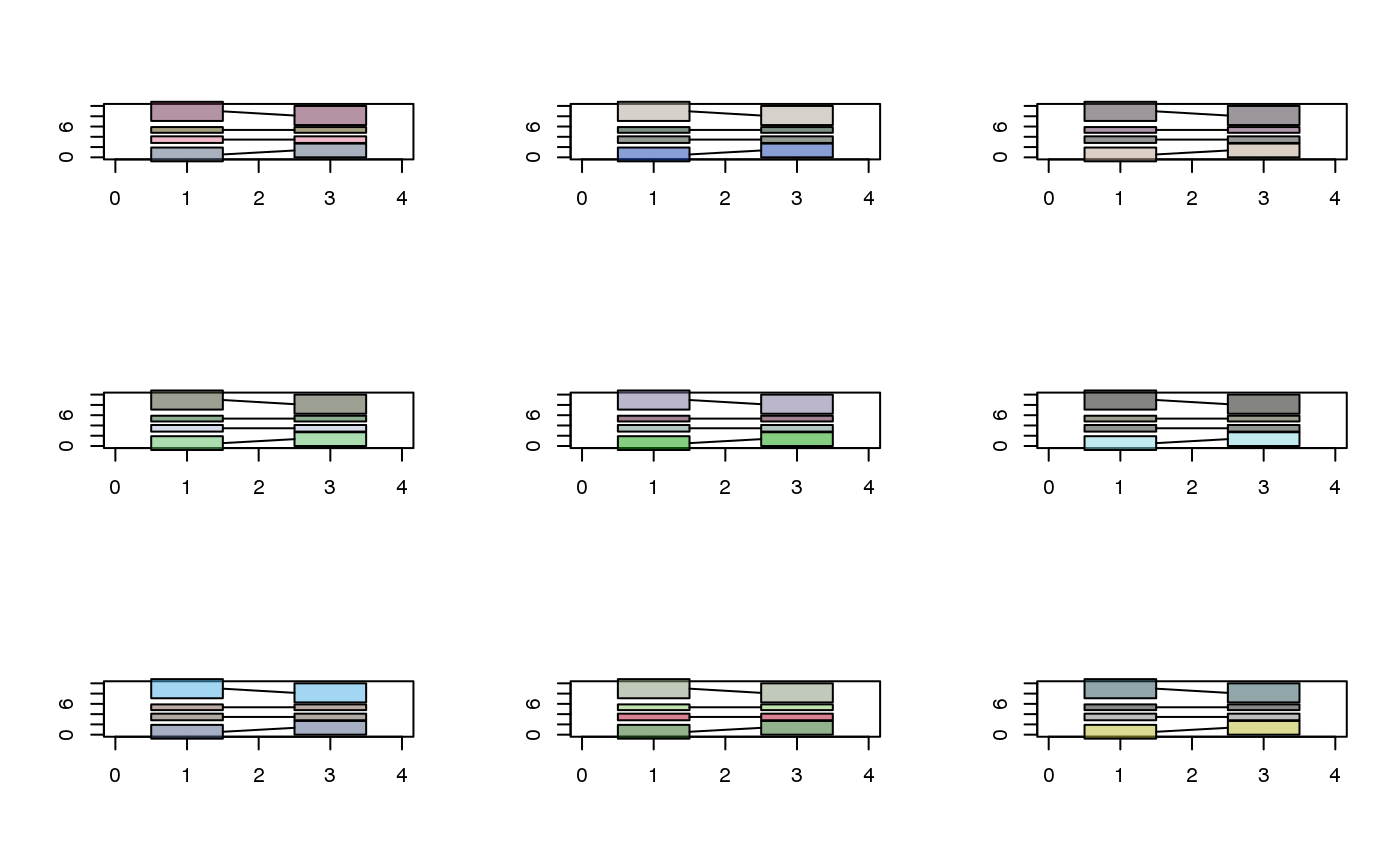
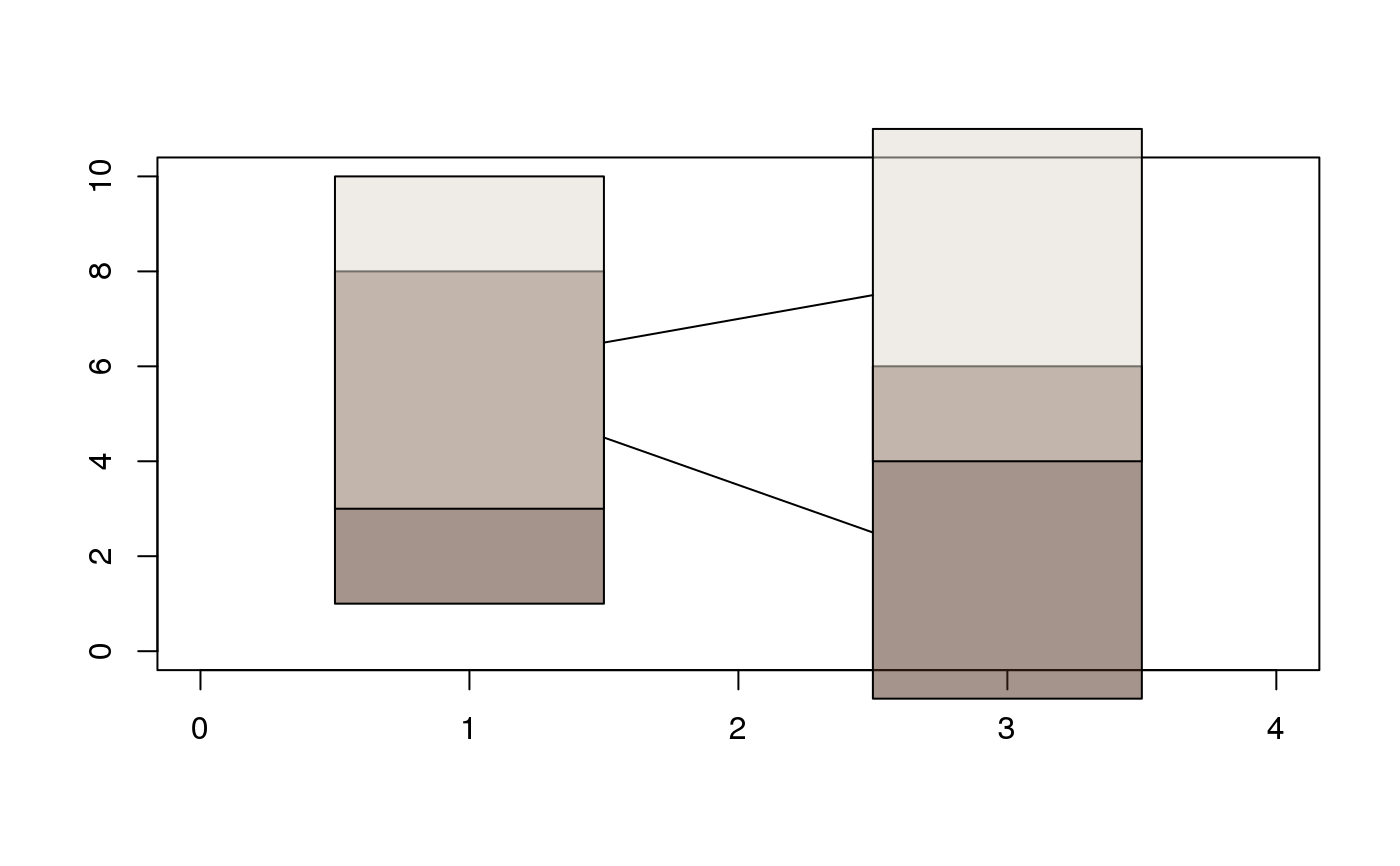
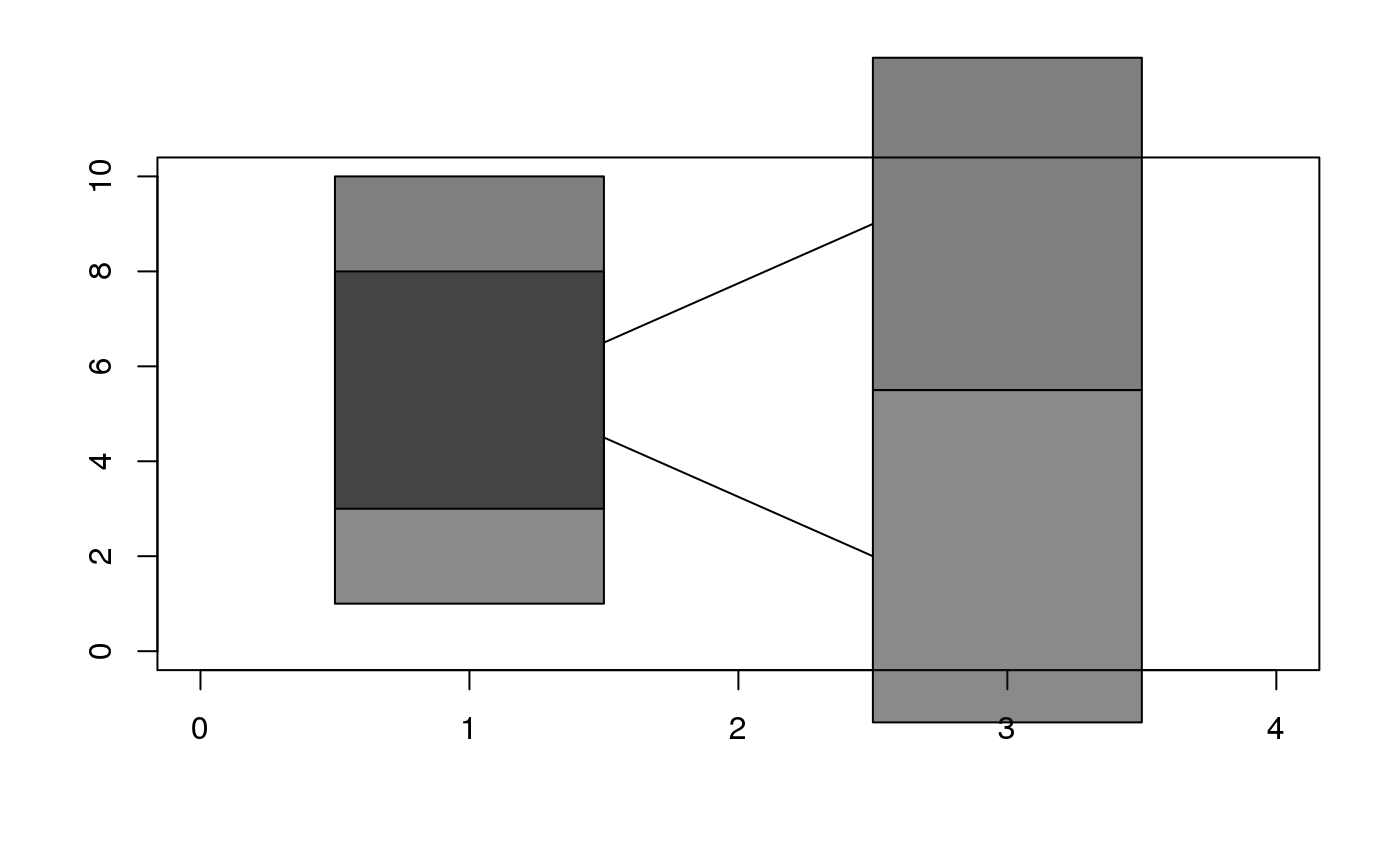
This is an improved version of the smartAlign.
It adjusts the positions of the rectangular shapes to make them do not overlap
Examples
require(circlize) make_plot = function(pos1, pos2, range) { oxpd = par("xpd") par(xpd = NA) plot(NULL, xlim = c(0, 4), ylim = range, ann = FALSE) col = rand_color(nrow(pos1), transparency = 0.5) rect(0.5, pos1[, 1], 1.5, pos1[, 2], col = col) rect(2.5, pos2[, 1], 3.5, pos2[, 2], col = col) segments(1.5, rowMeans(pos1), 2.5, rowMeans(pos2)) par(xpd = oxpd) } range = c(0, 10) pos1 = rbind(c(1, 2), c(5, 7)) make_plot(pos1, smartAlign2(pos1, range = range), range)range = c(0, 10) pos1 = rbind(c(-0.5, 2), c(5, 7)) make_plot(pos1, smartAlign2(pos1, range = range), range)pos1 = rbind(c(-1, 2), c(3, 4), c(5, 6), c(7, 11)) pos1 = pos1 + runif(length(pos1), max = 0.3, min = -0.3) omfrow = par("mfrow") par(mfrow = c(3, 3)) for(i in 1:9) { ind = sample(4, 4) make_plot(pos1[ind, ], smartAlign2(pos1[ind, ], range = range), range) }par(mfrow = omfrow) pos1 = rbind(c(3, 6), c(4, 7)) make_plot(pos1, smartAlign2(pos1, range = range), range)make_plot(pos1, smartAlign2(pos1, range = range, range_fixed = FALSE), range)