Introduction to RNA-seqRNA-seq quantification: from reads to count matrix
RStudio Project and Experimental Data
Figure 1
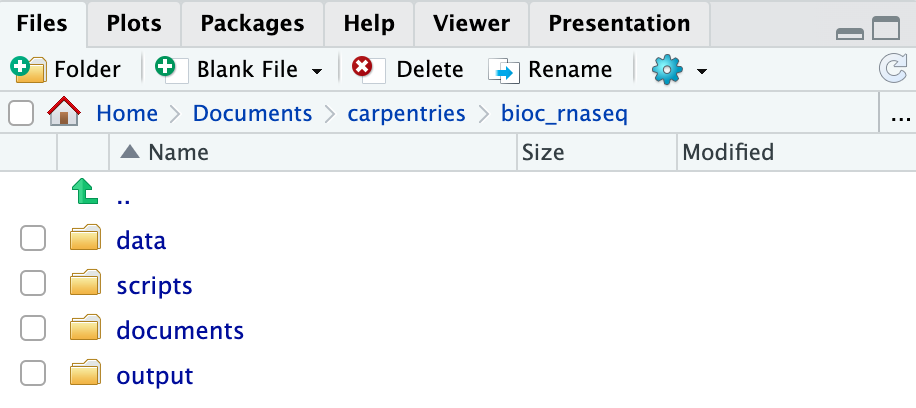
Figure 2
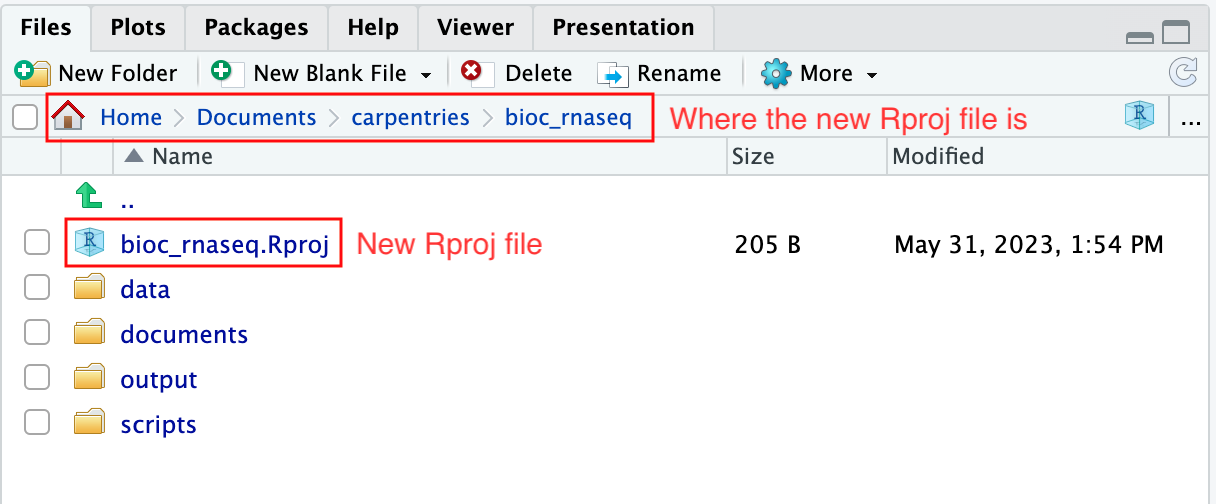
Figure 3
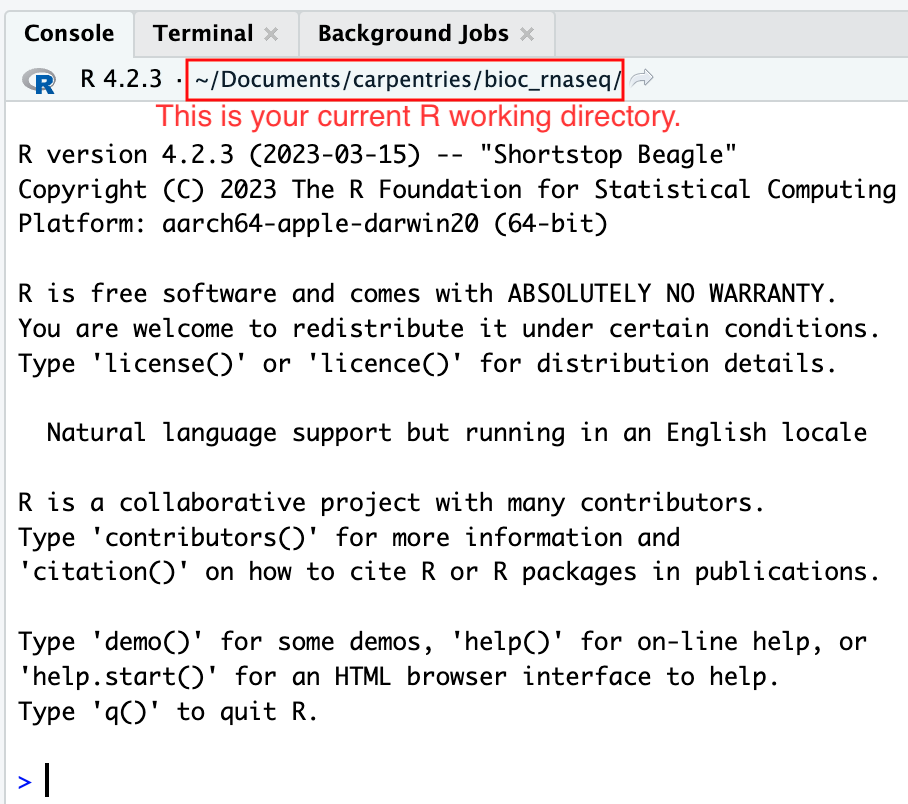
Figure 4
Importing and annotating quantified data into R
Figure 1

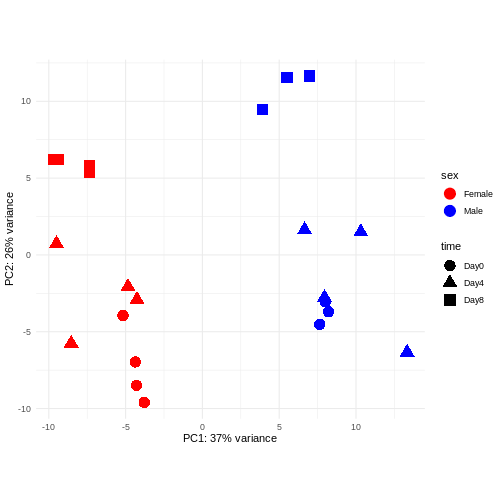
Exploratory analysis and quality control
Figure 1
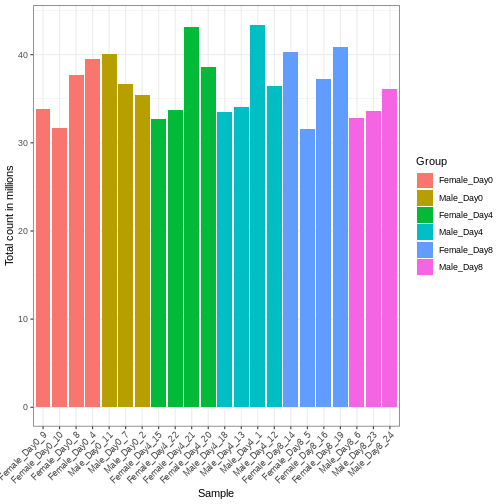
Figure 2
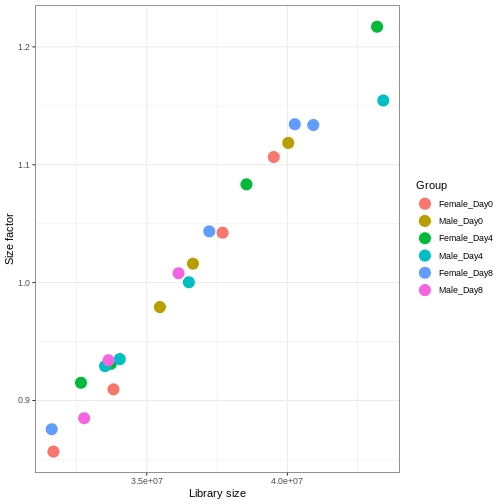
Figure 3
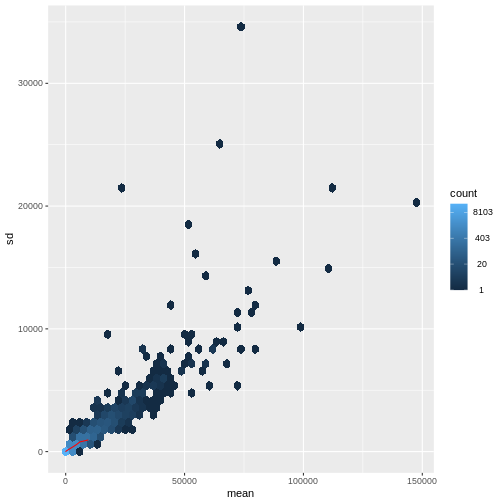
Figure 4
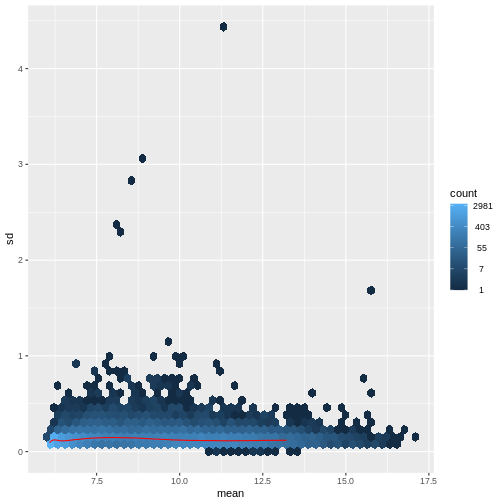
Figure 5
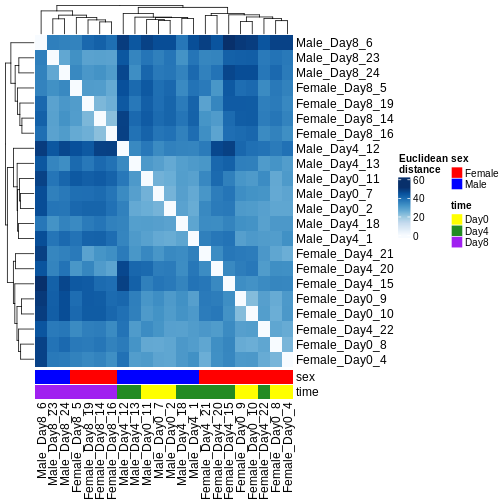
Figure 6
Differential expression analysis
Figure 1
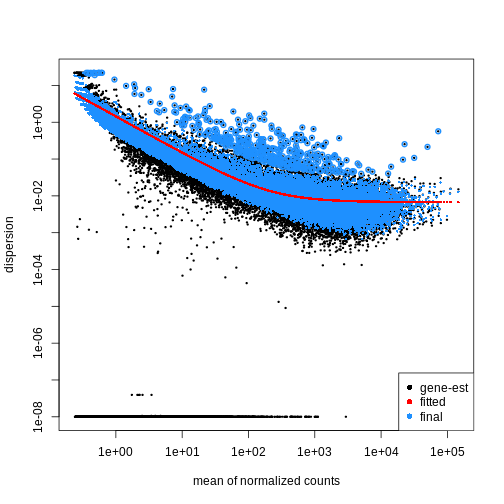
Figure 2
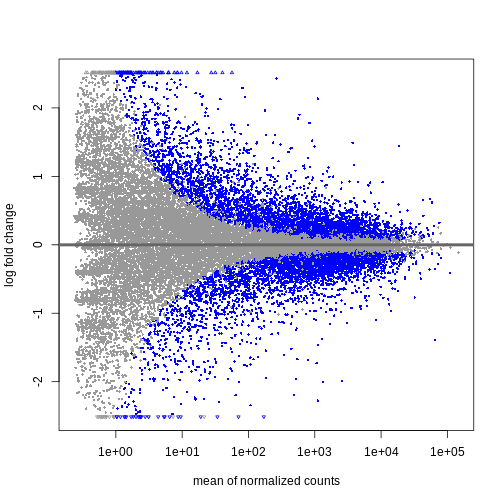
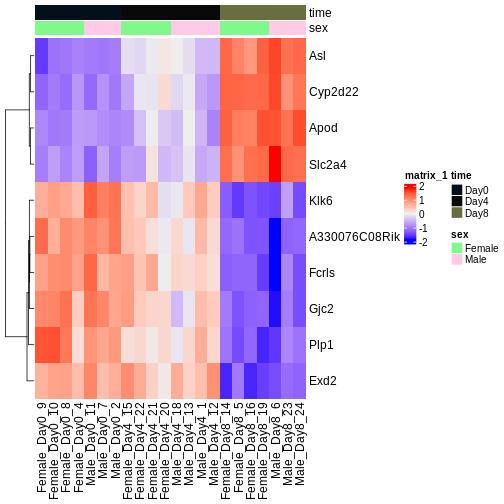
Figure 3
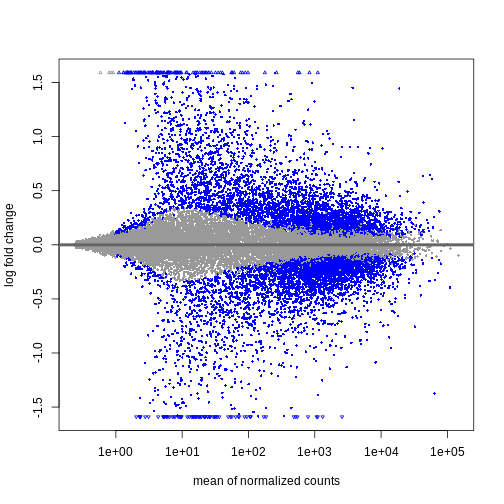 Shrinkage of log fold changes is useful for visualization and ranking of
genes, but for result exploration typically the
Shrinkage of log fold changes is useful for visualization and ranking of
genes, but for result exploration typically the
independentFiltering argument is used to remove lowly
expressed genes.
Figure 4
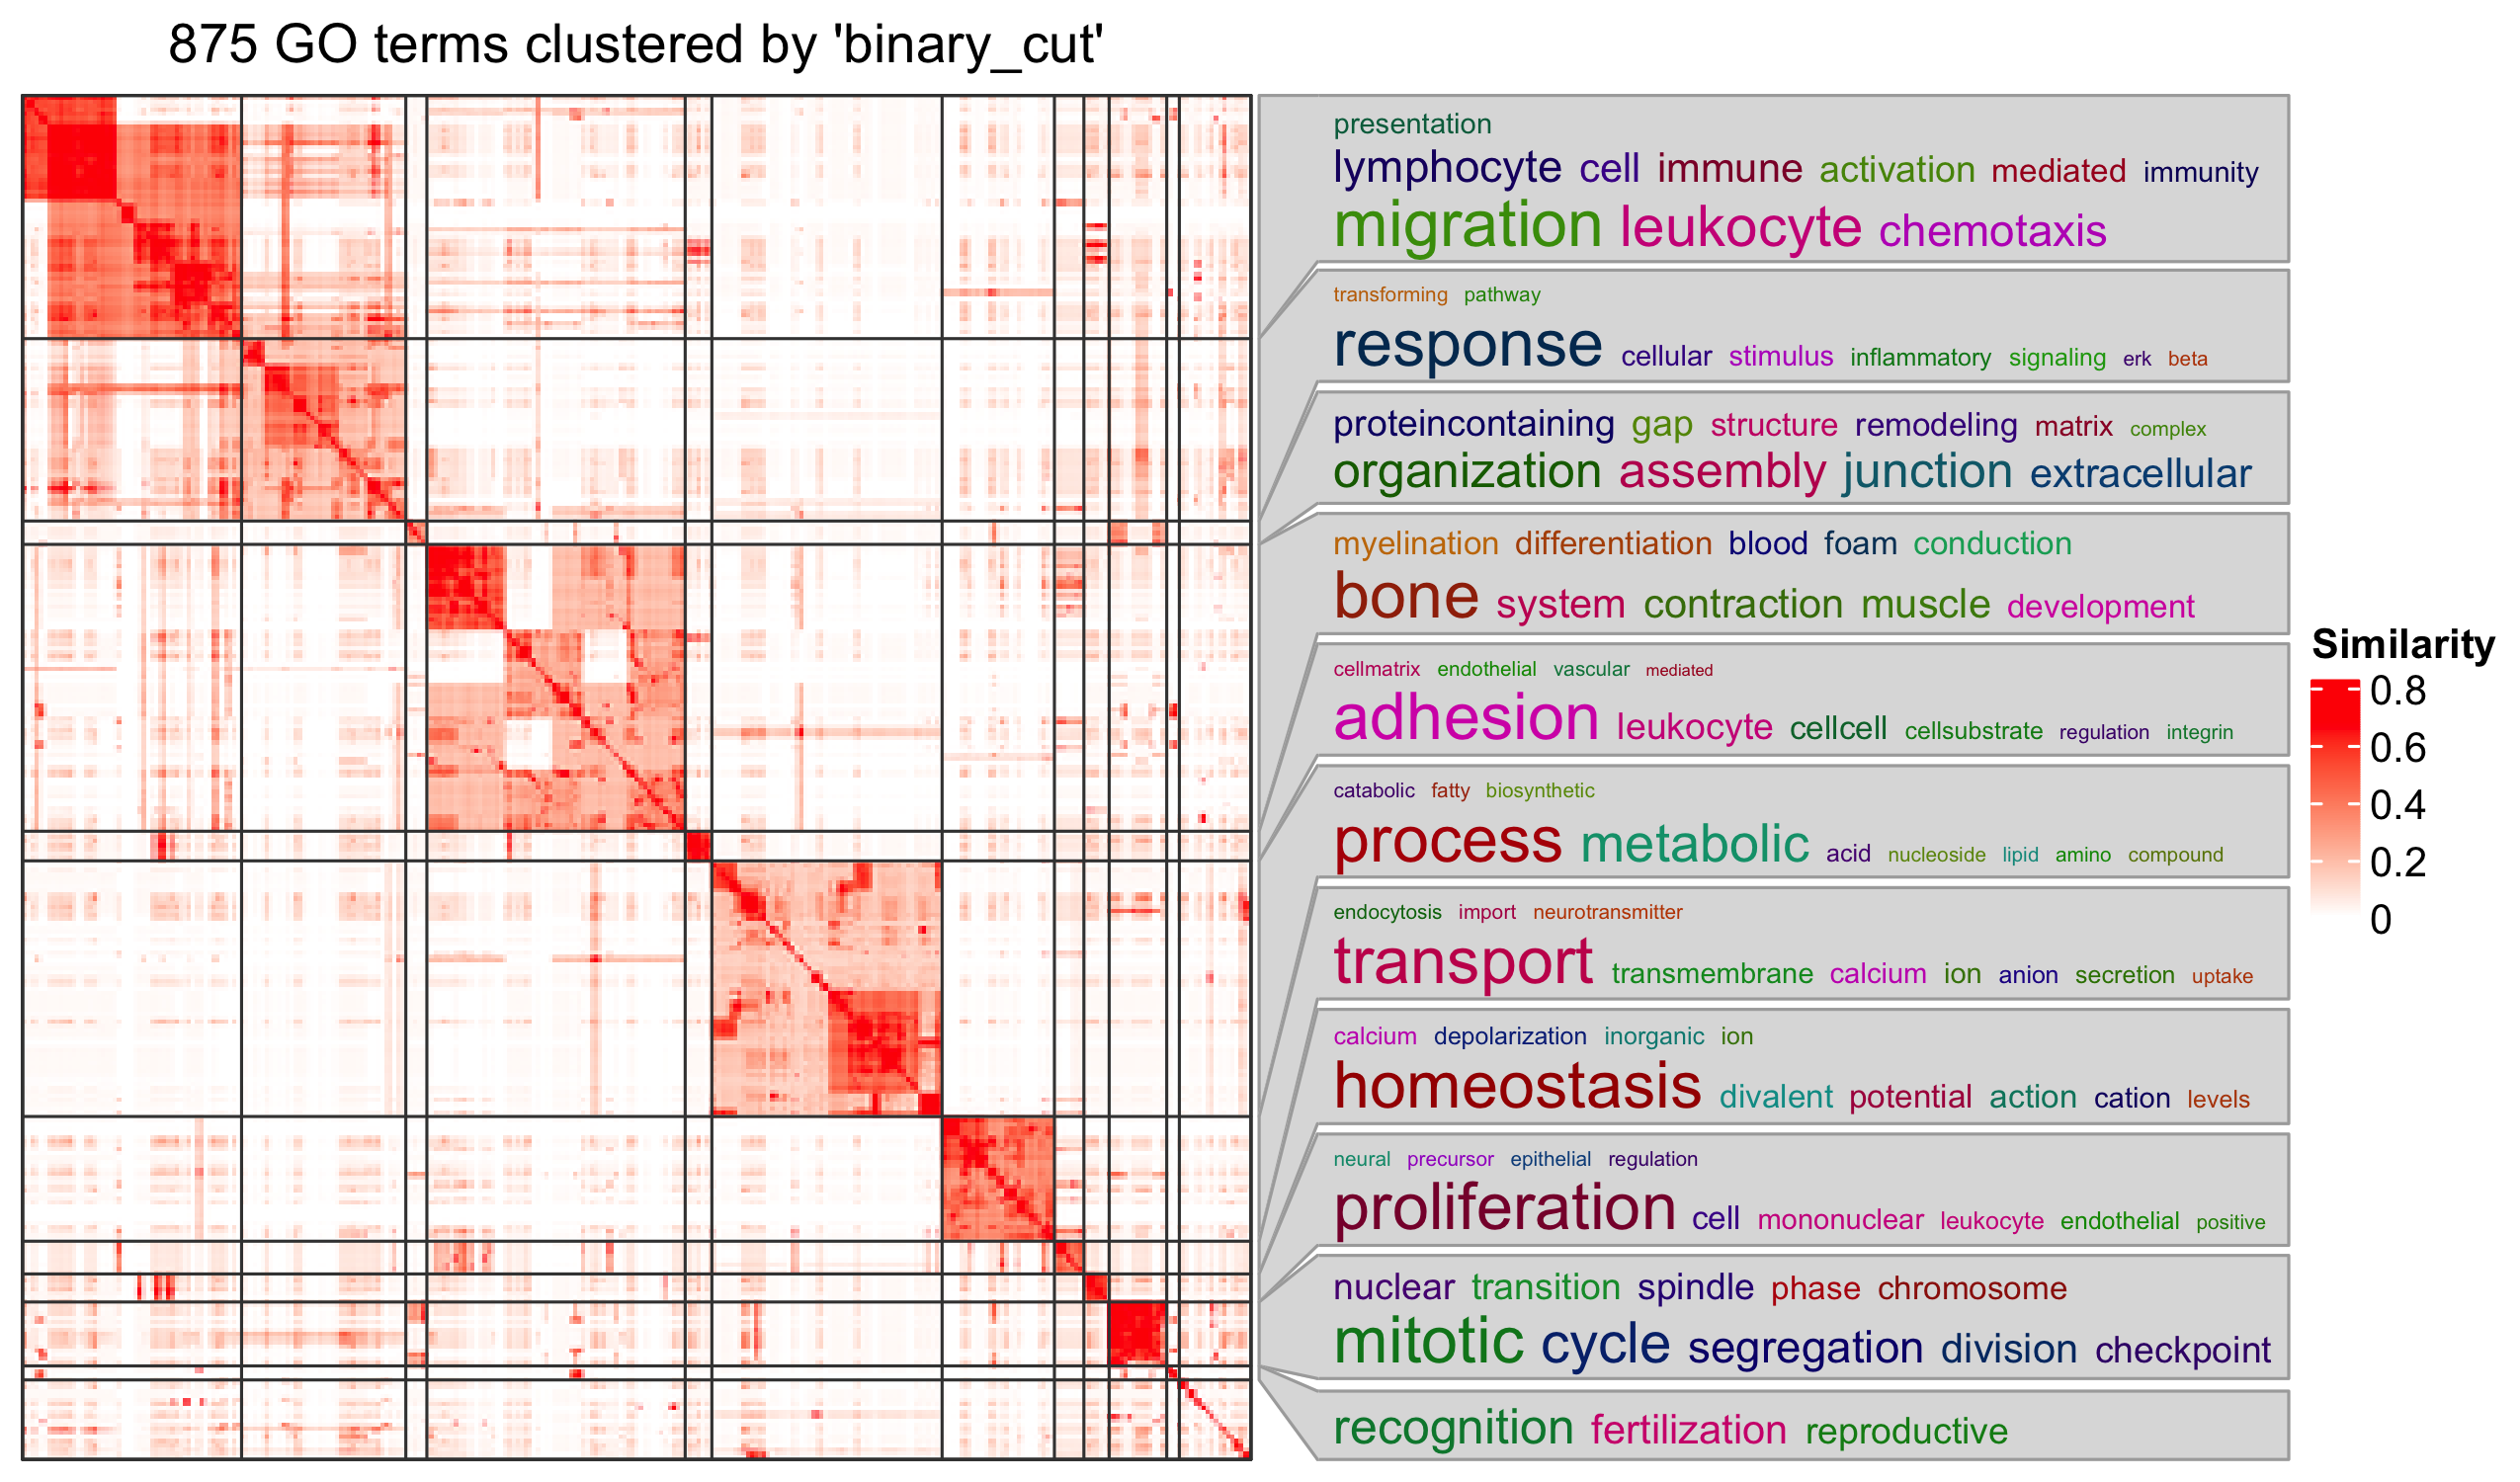
Gene set enrichment analysis
Figure 1
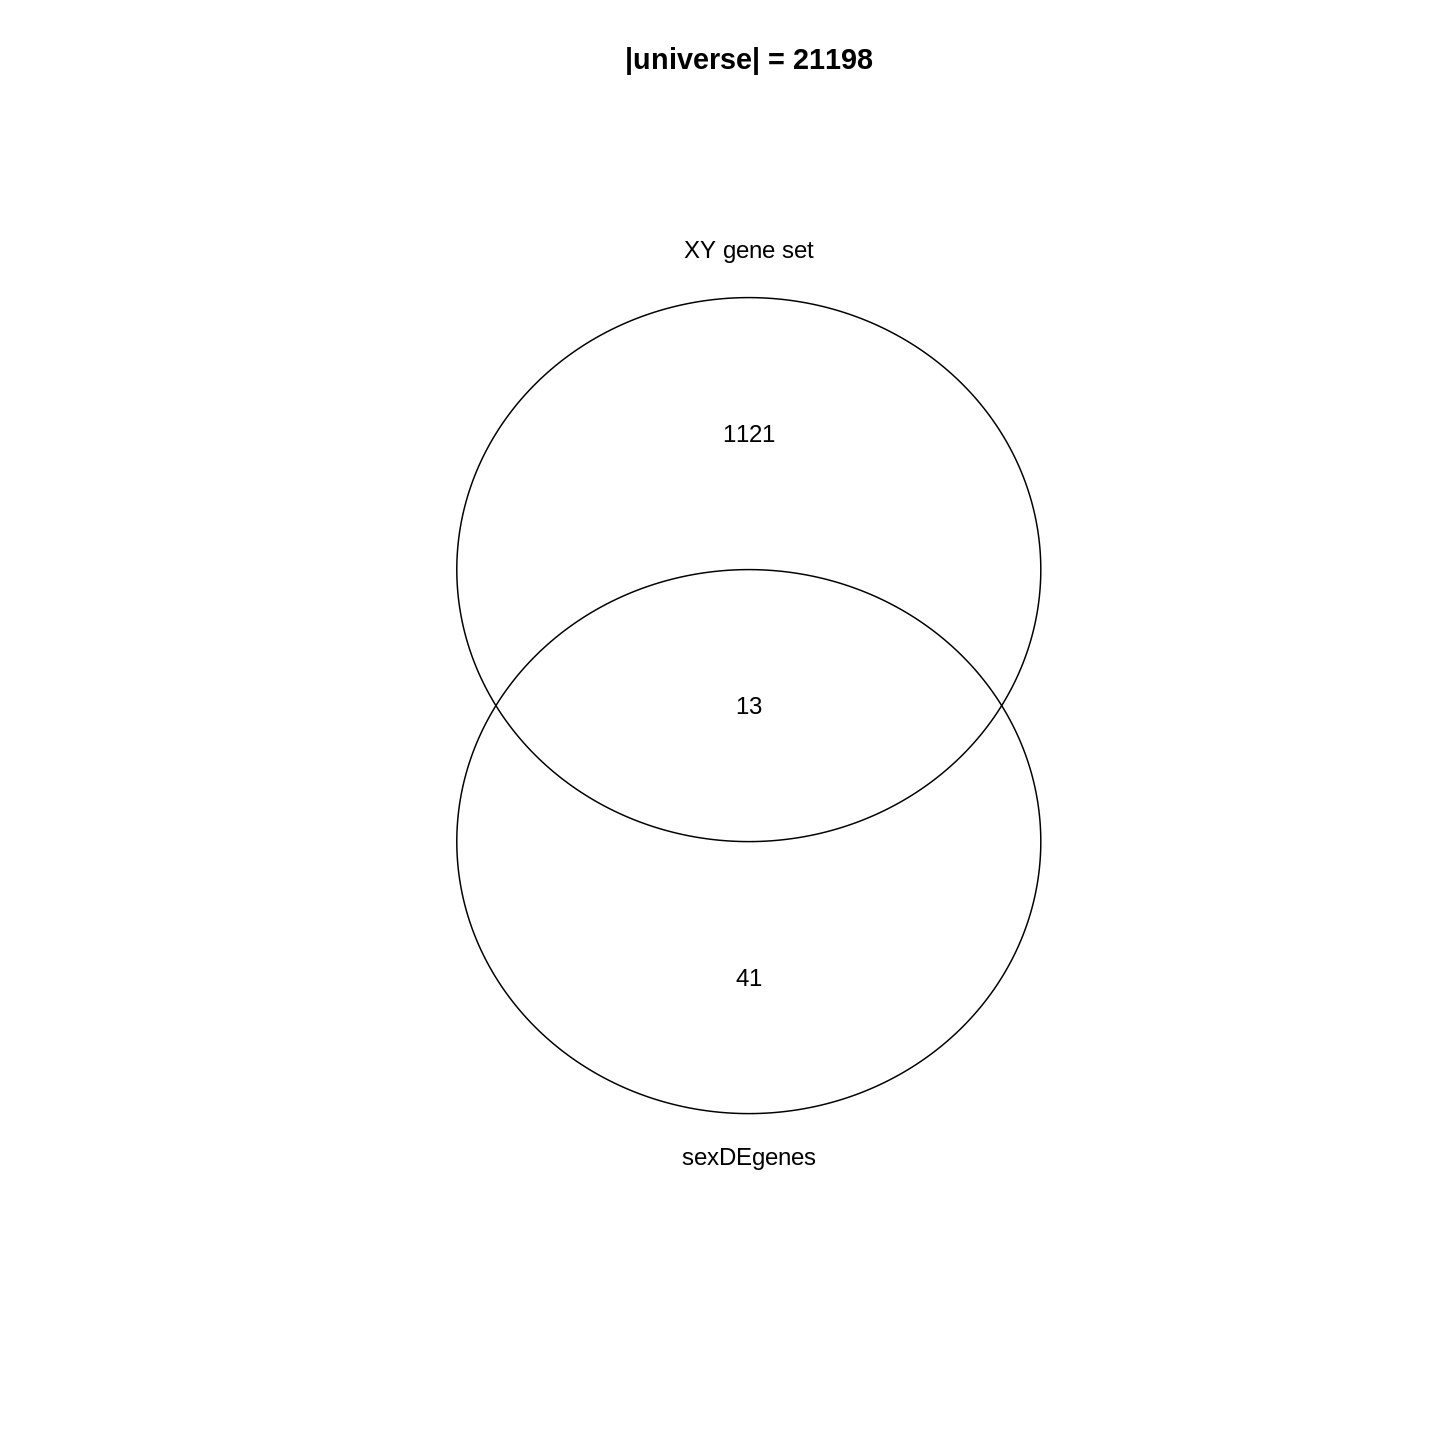
Figure 2
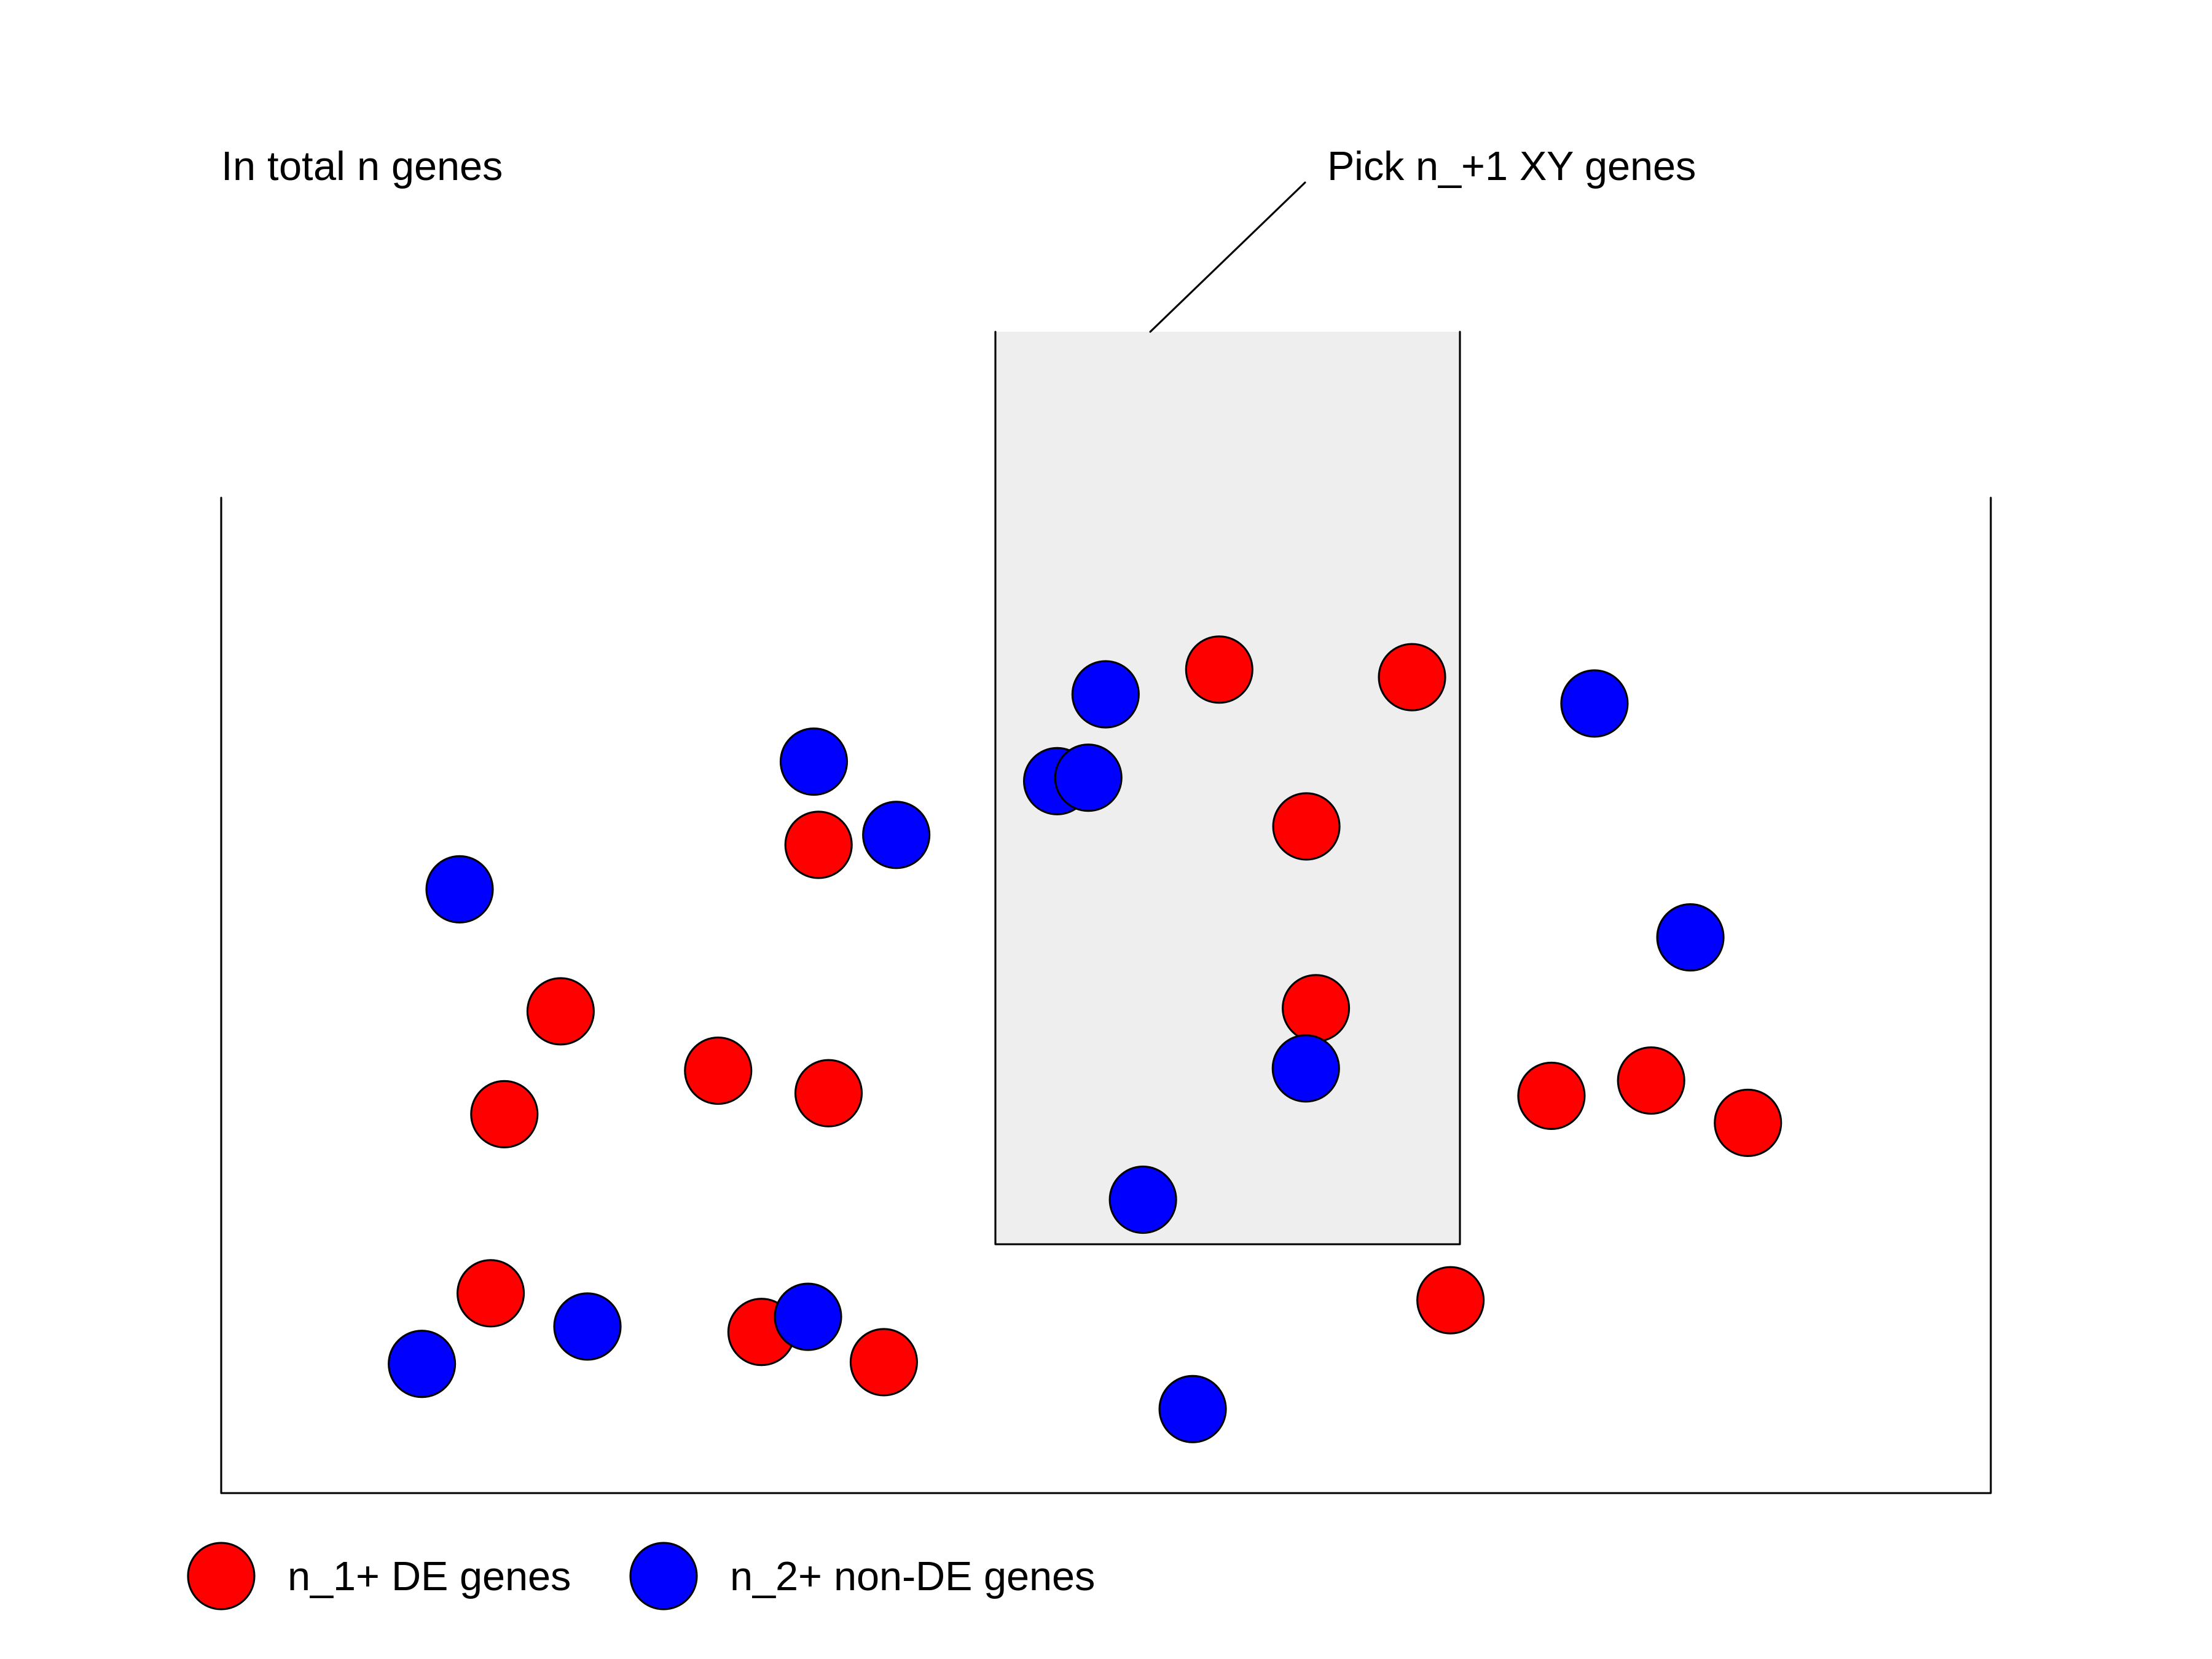
Figure 3

Figure 4
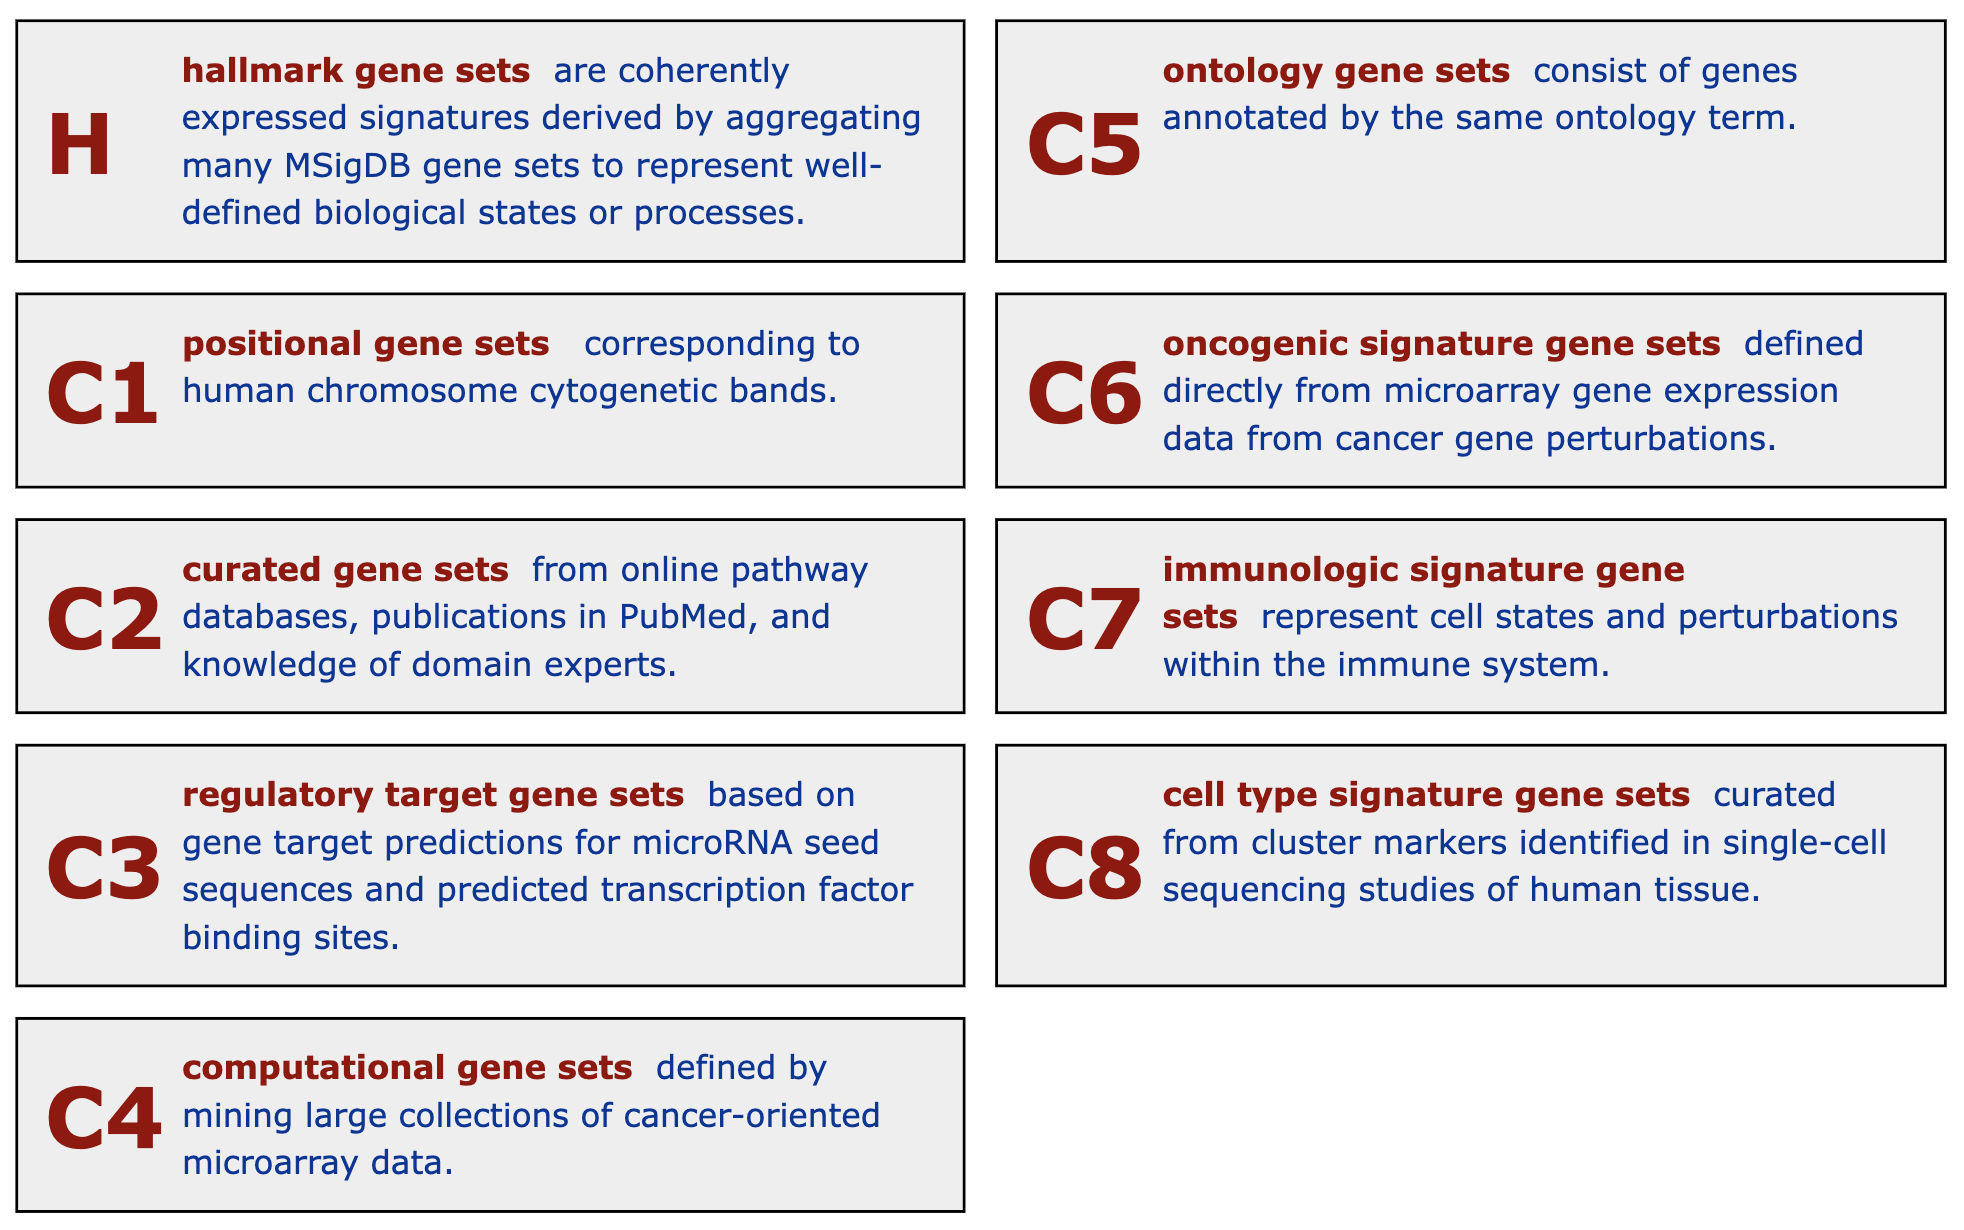
Figure 5
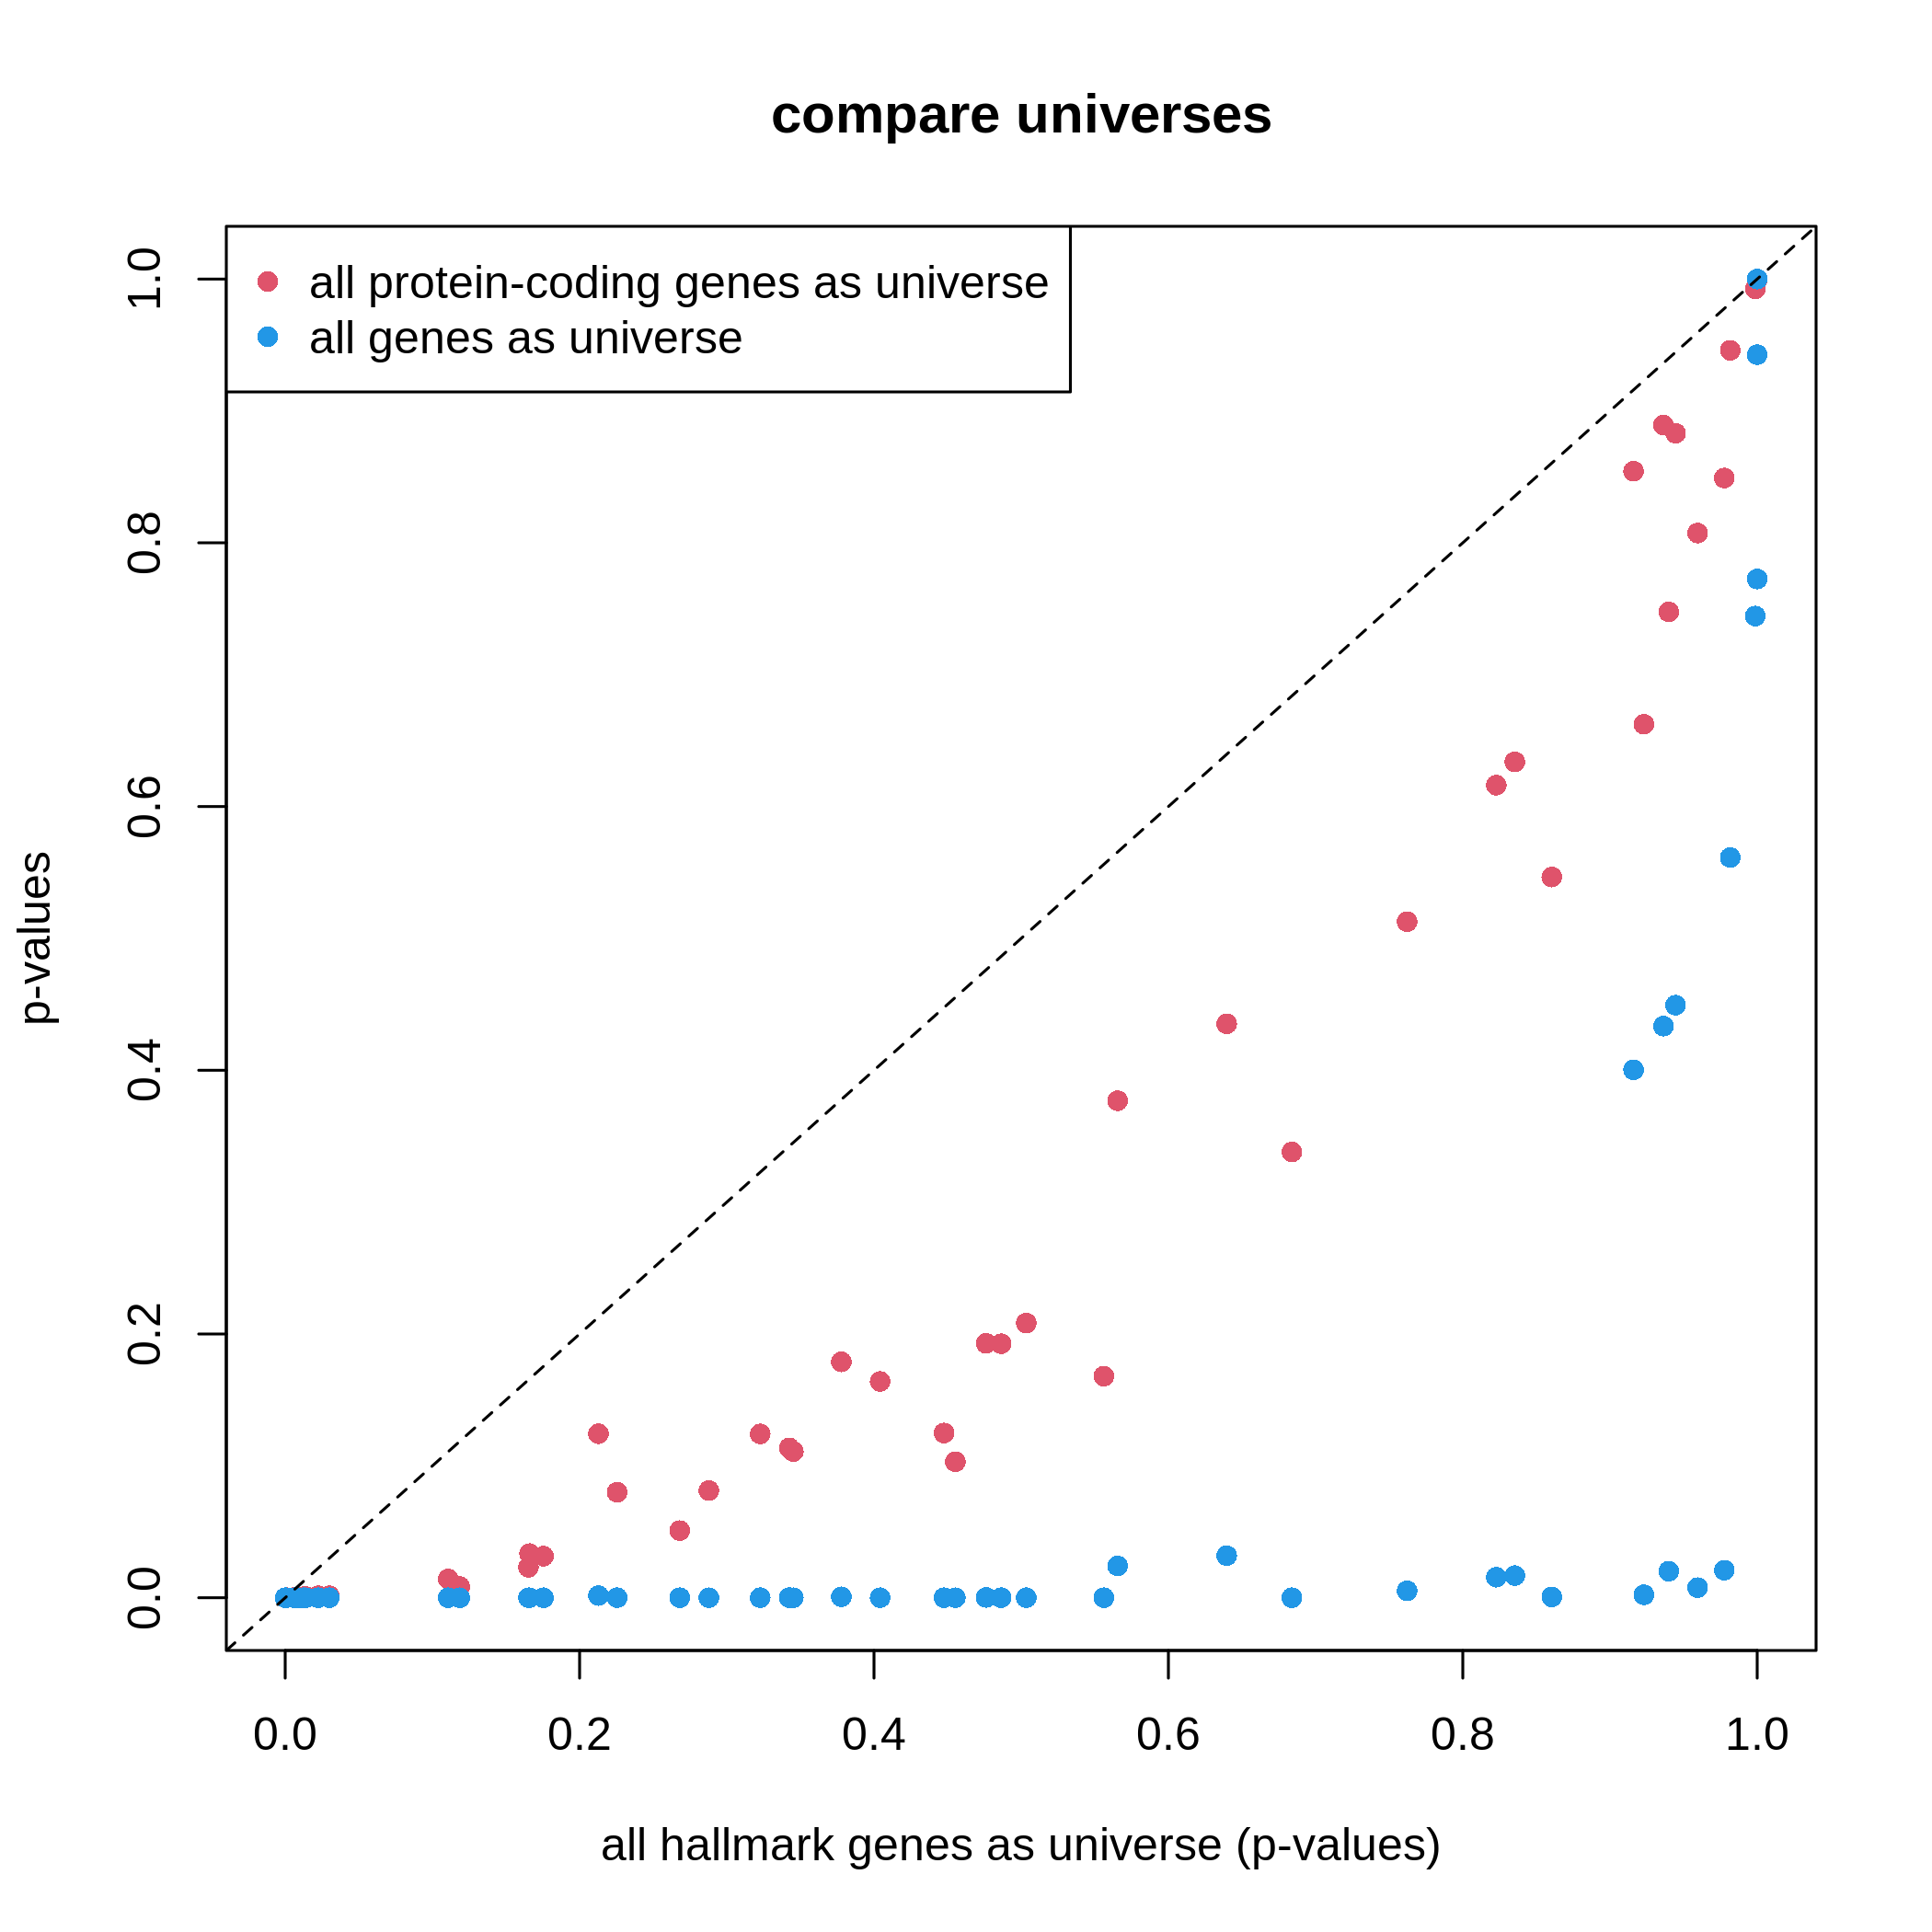
Figure 6
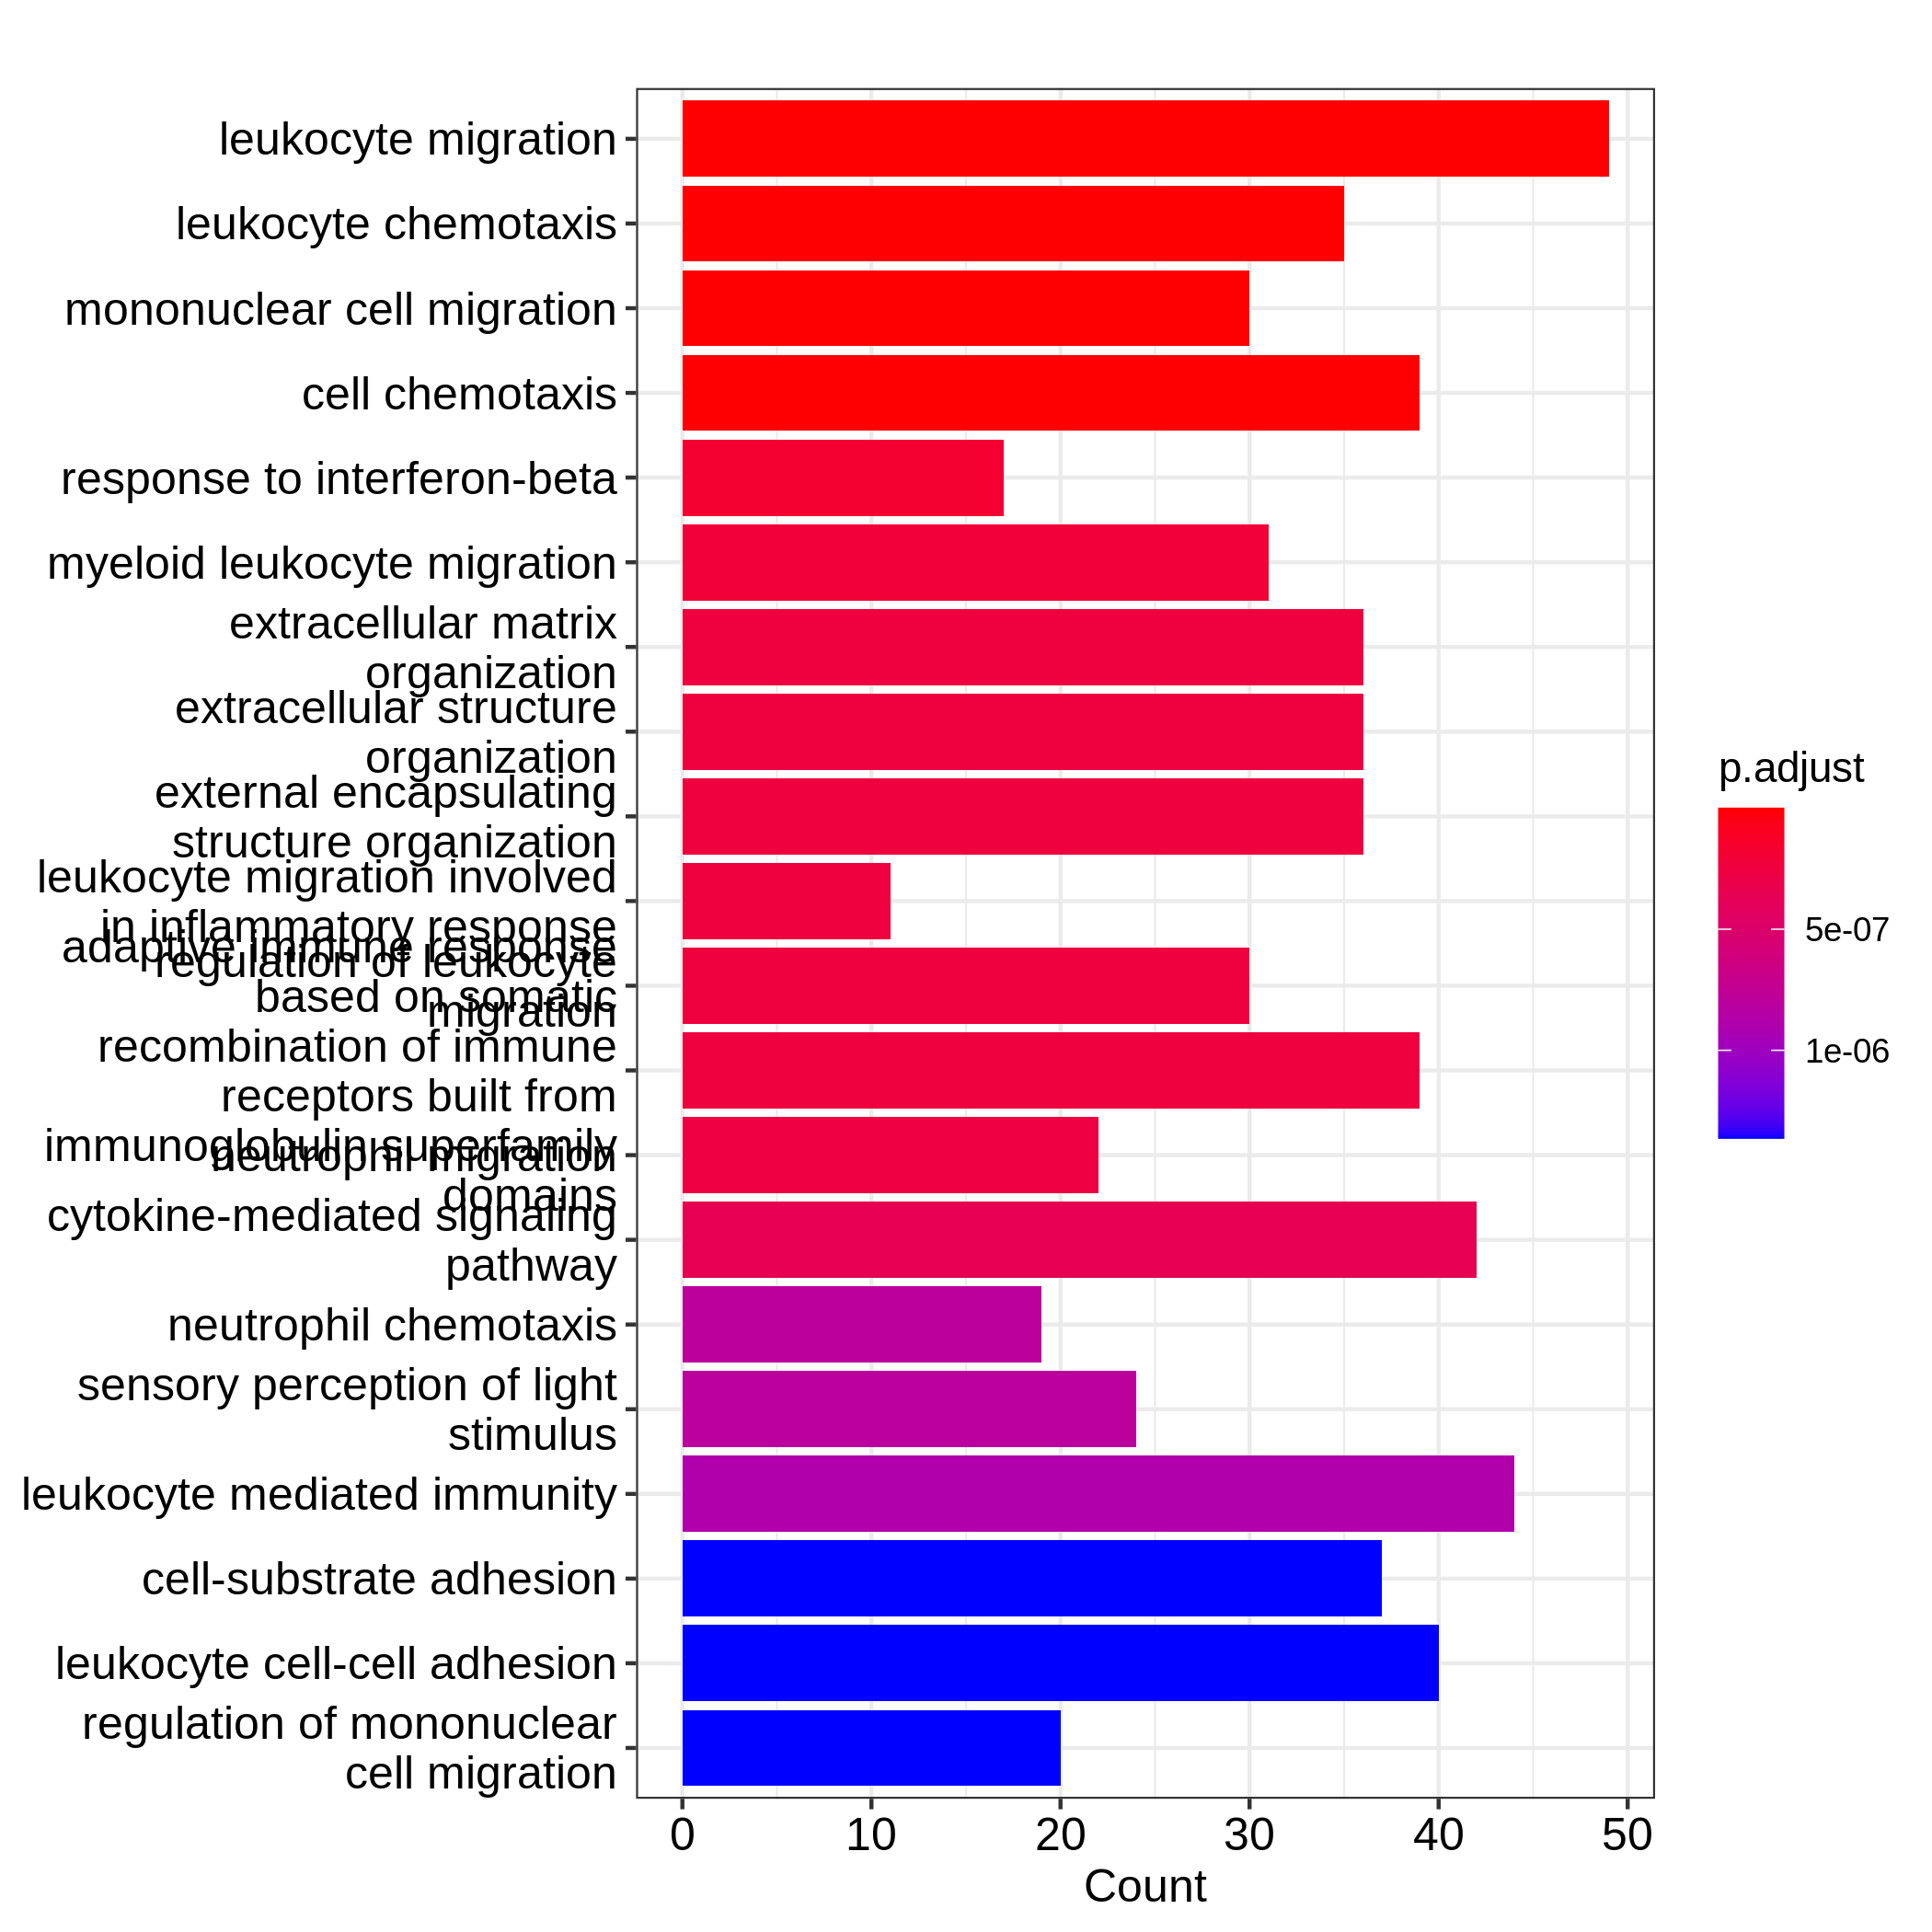
Figure 7
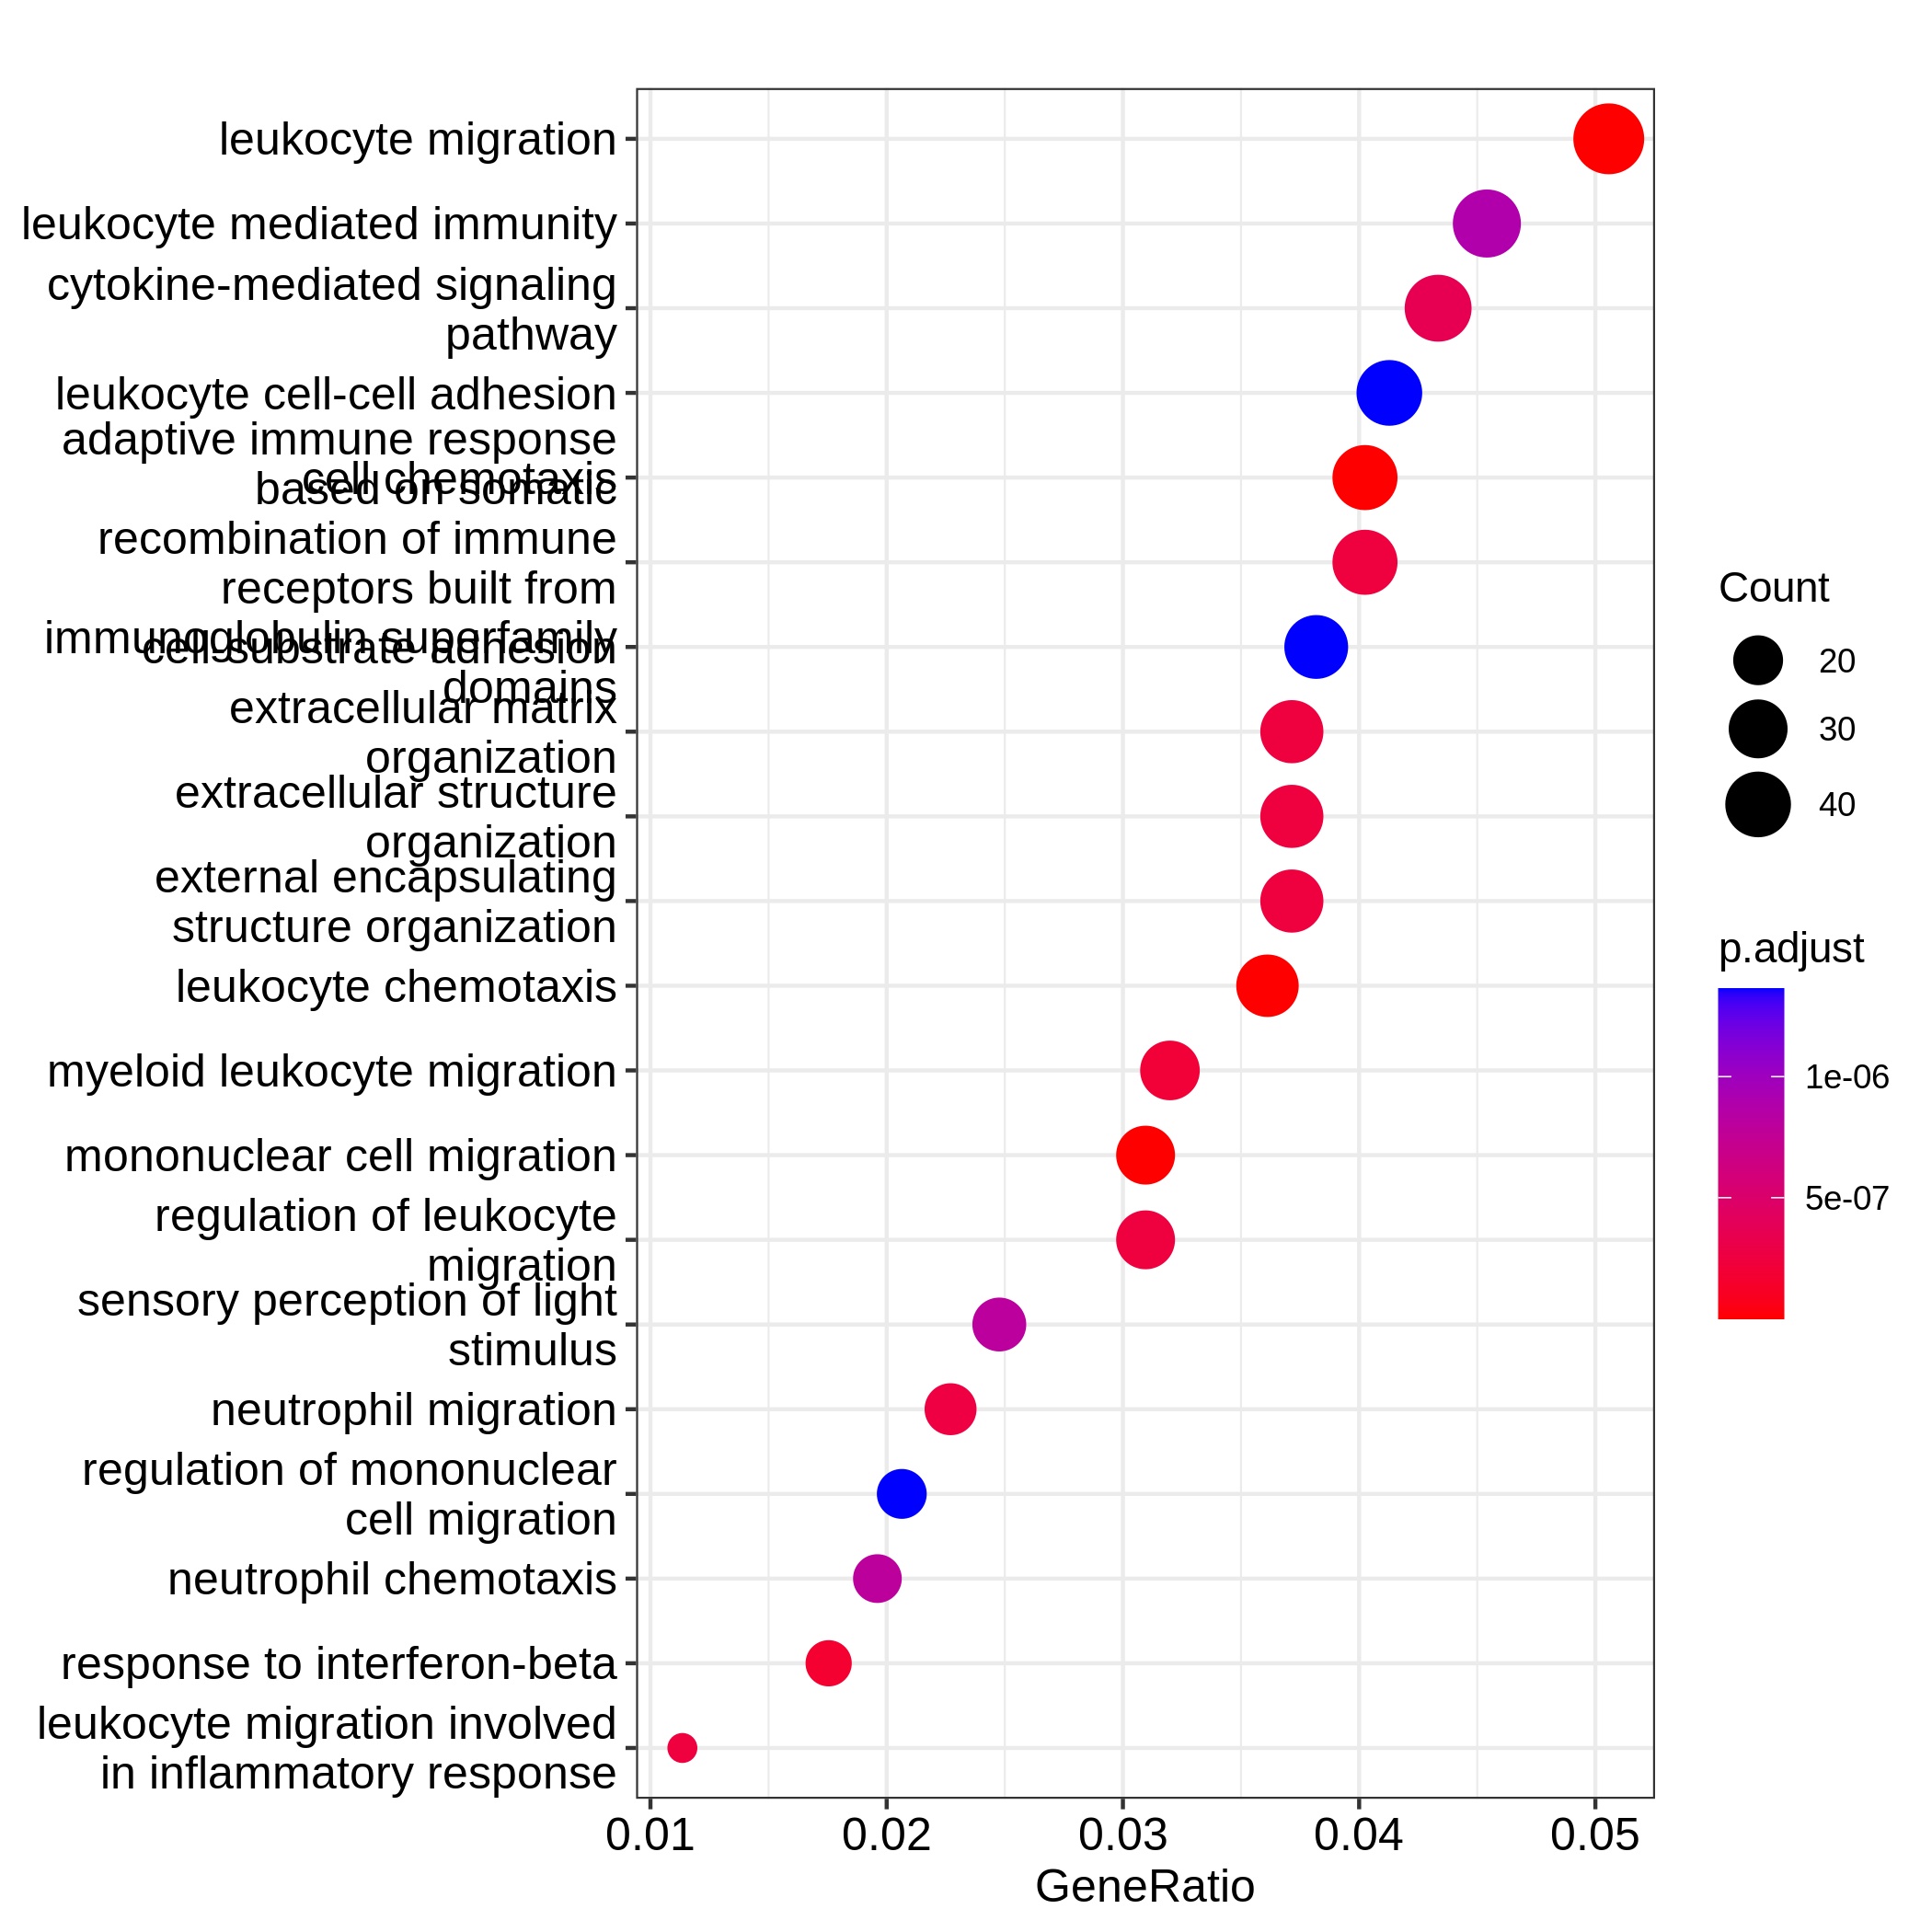
Figure 8
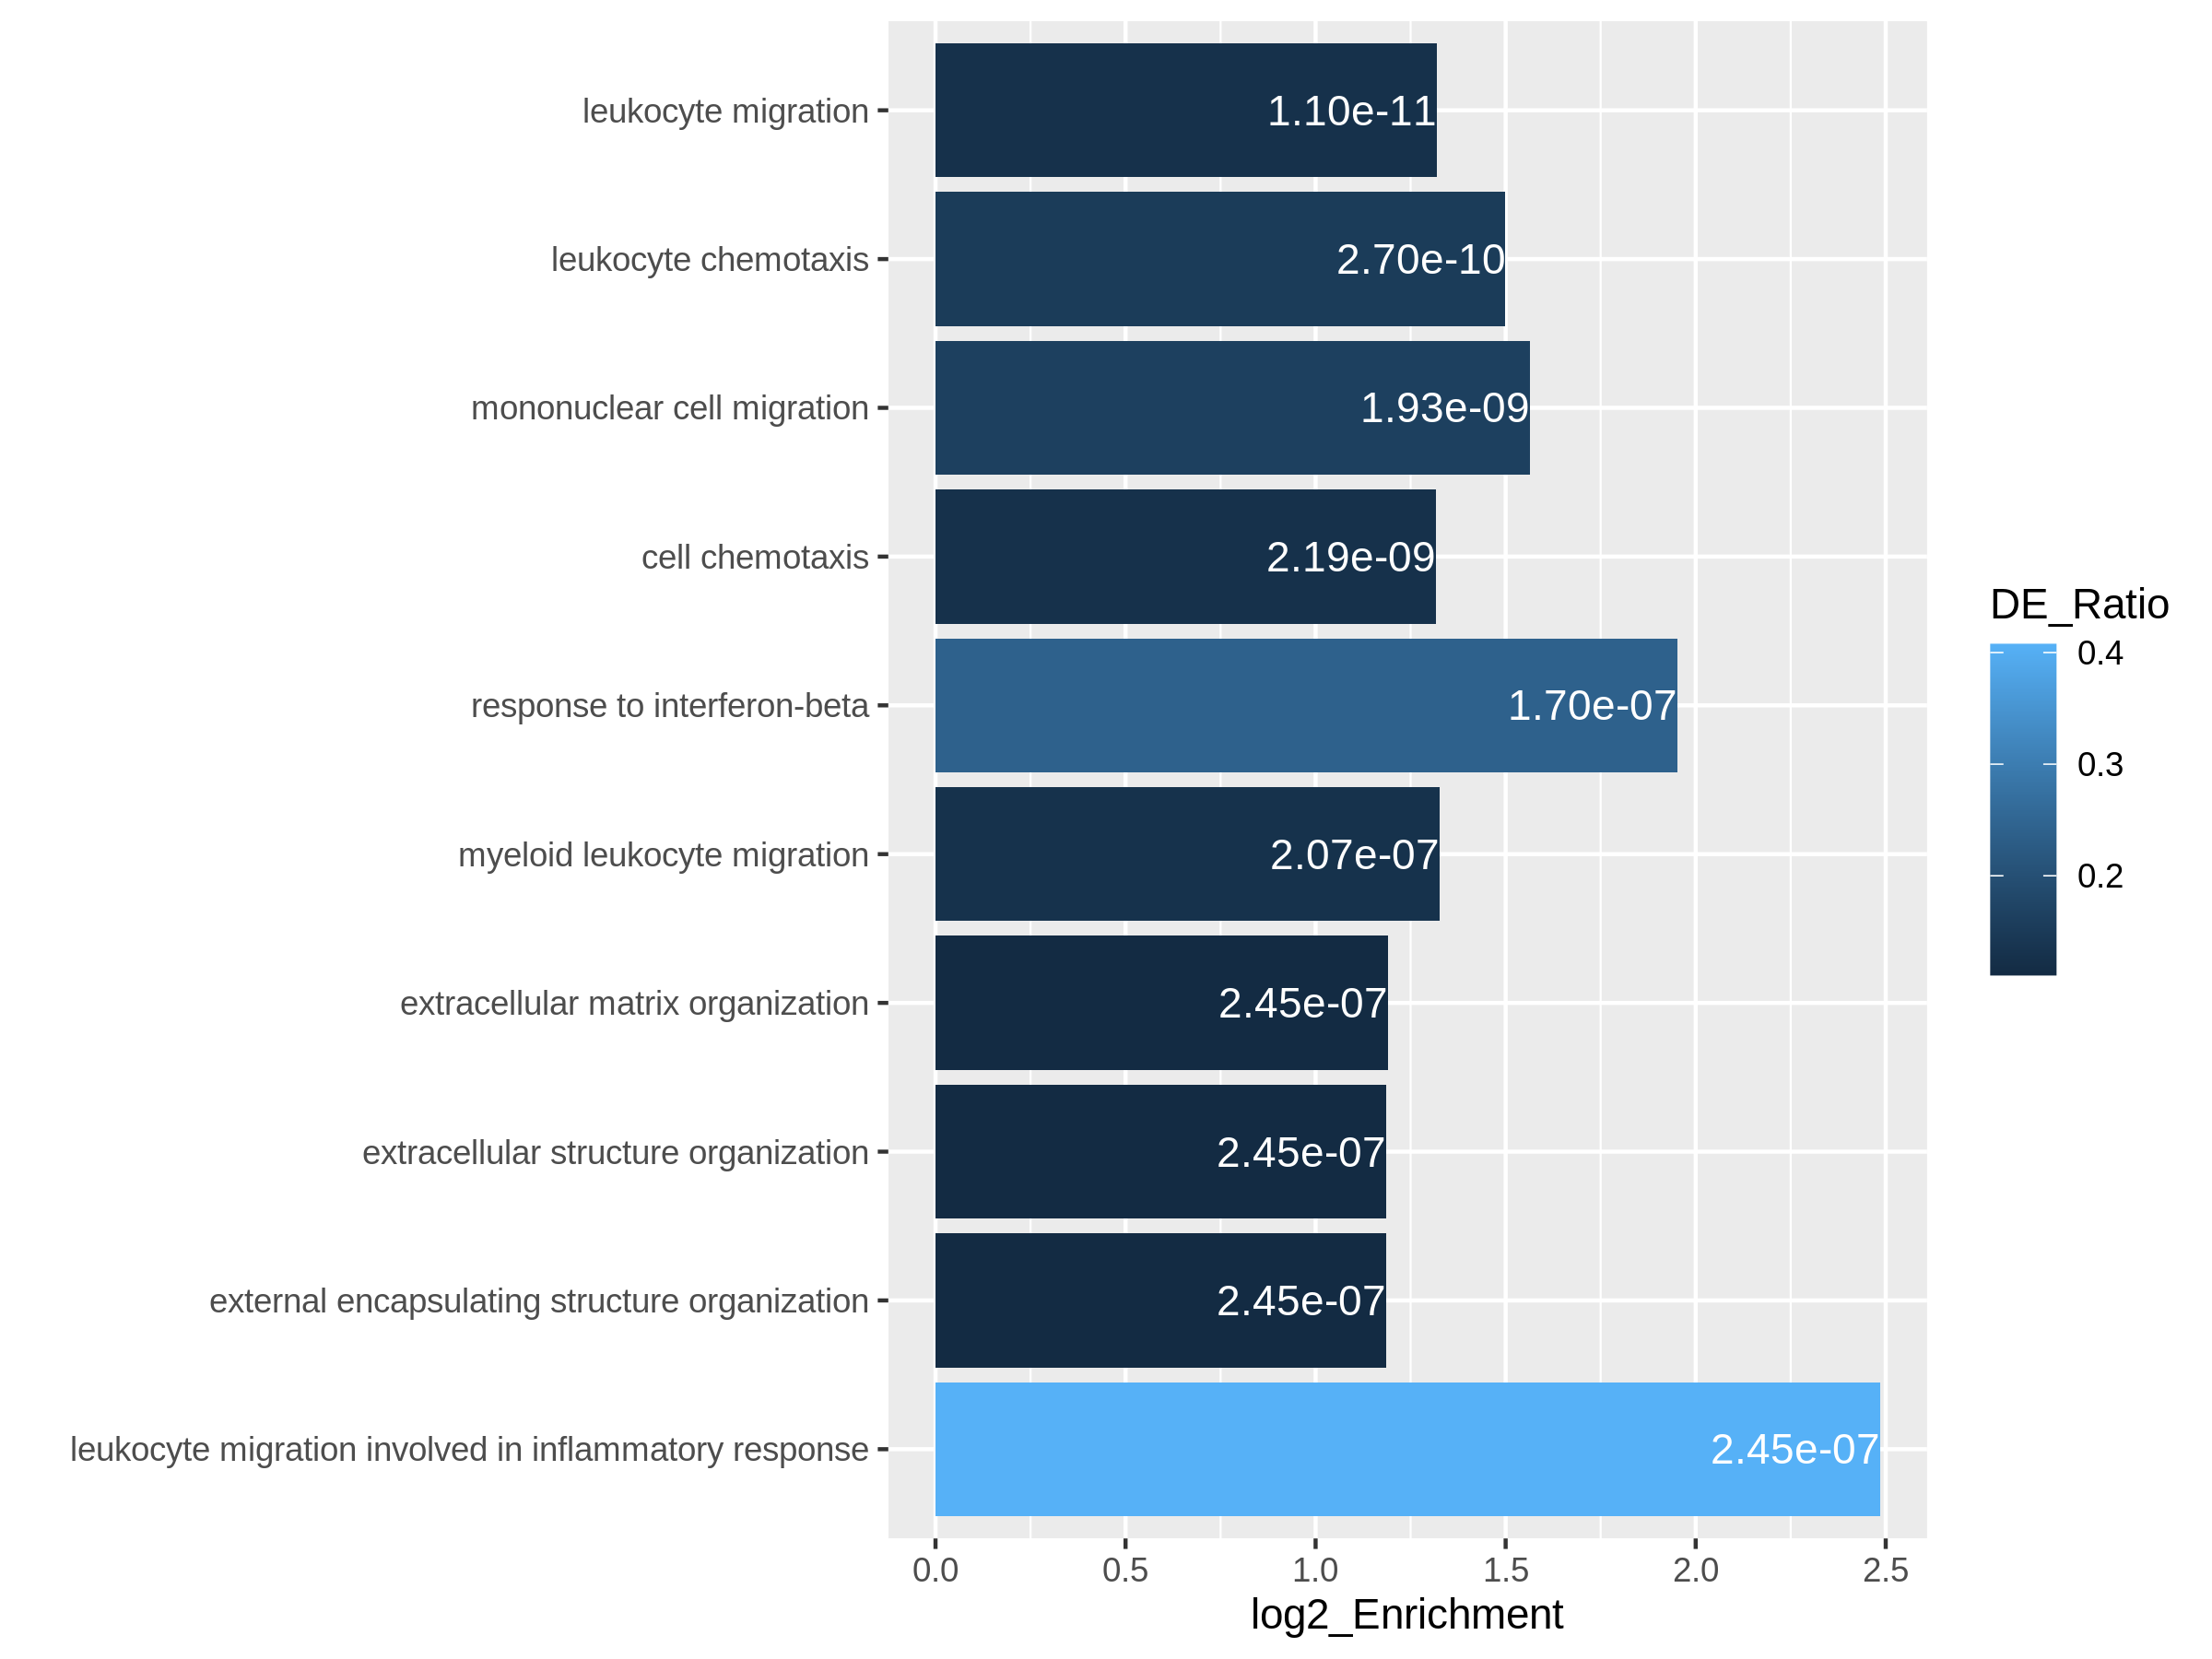
Figure 9
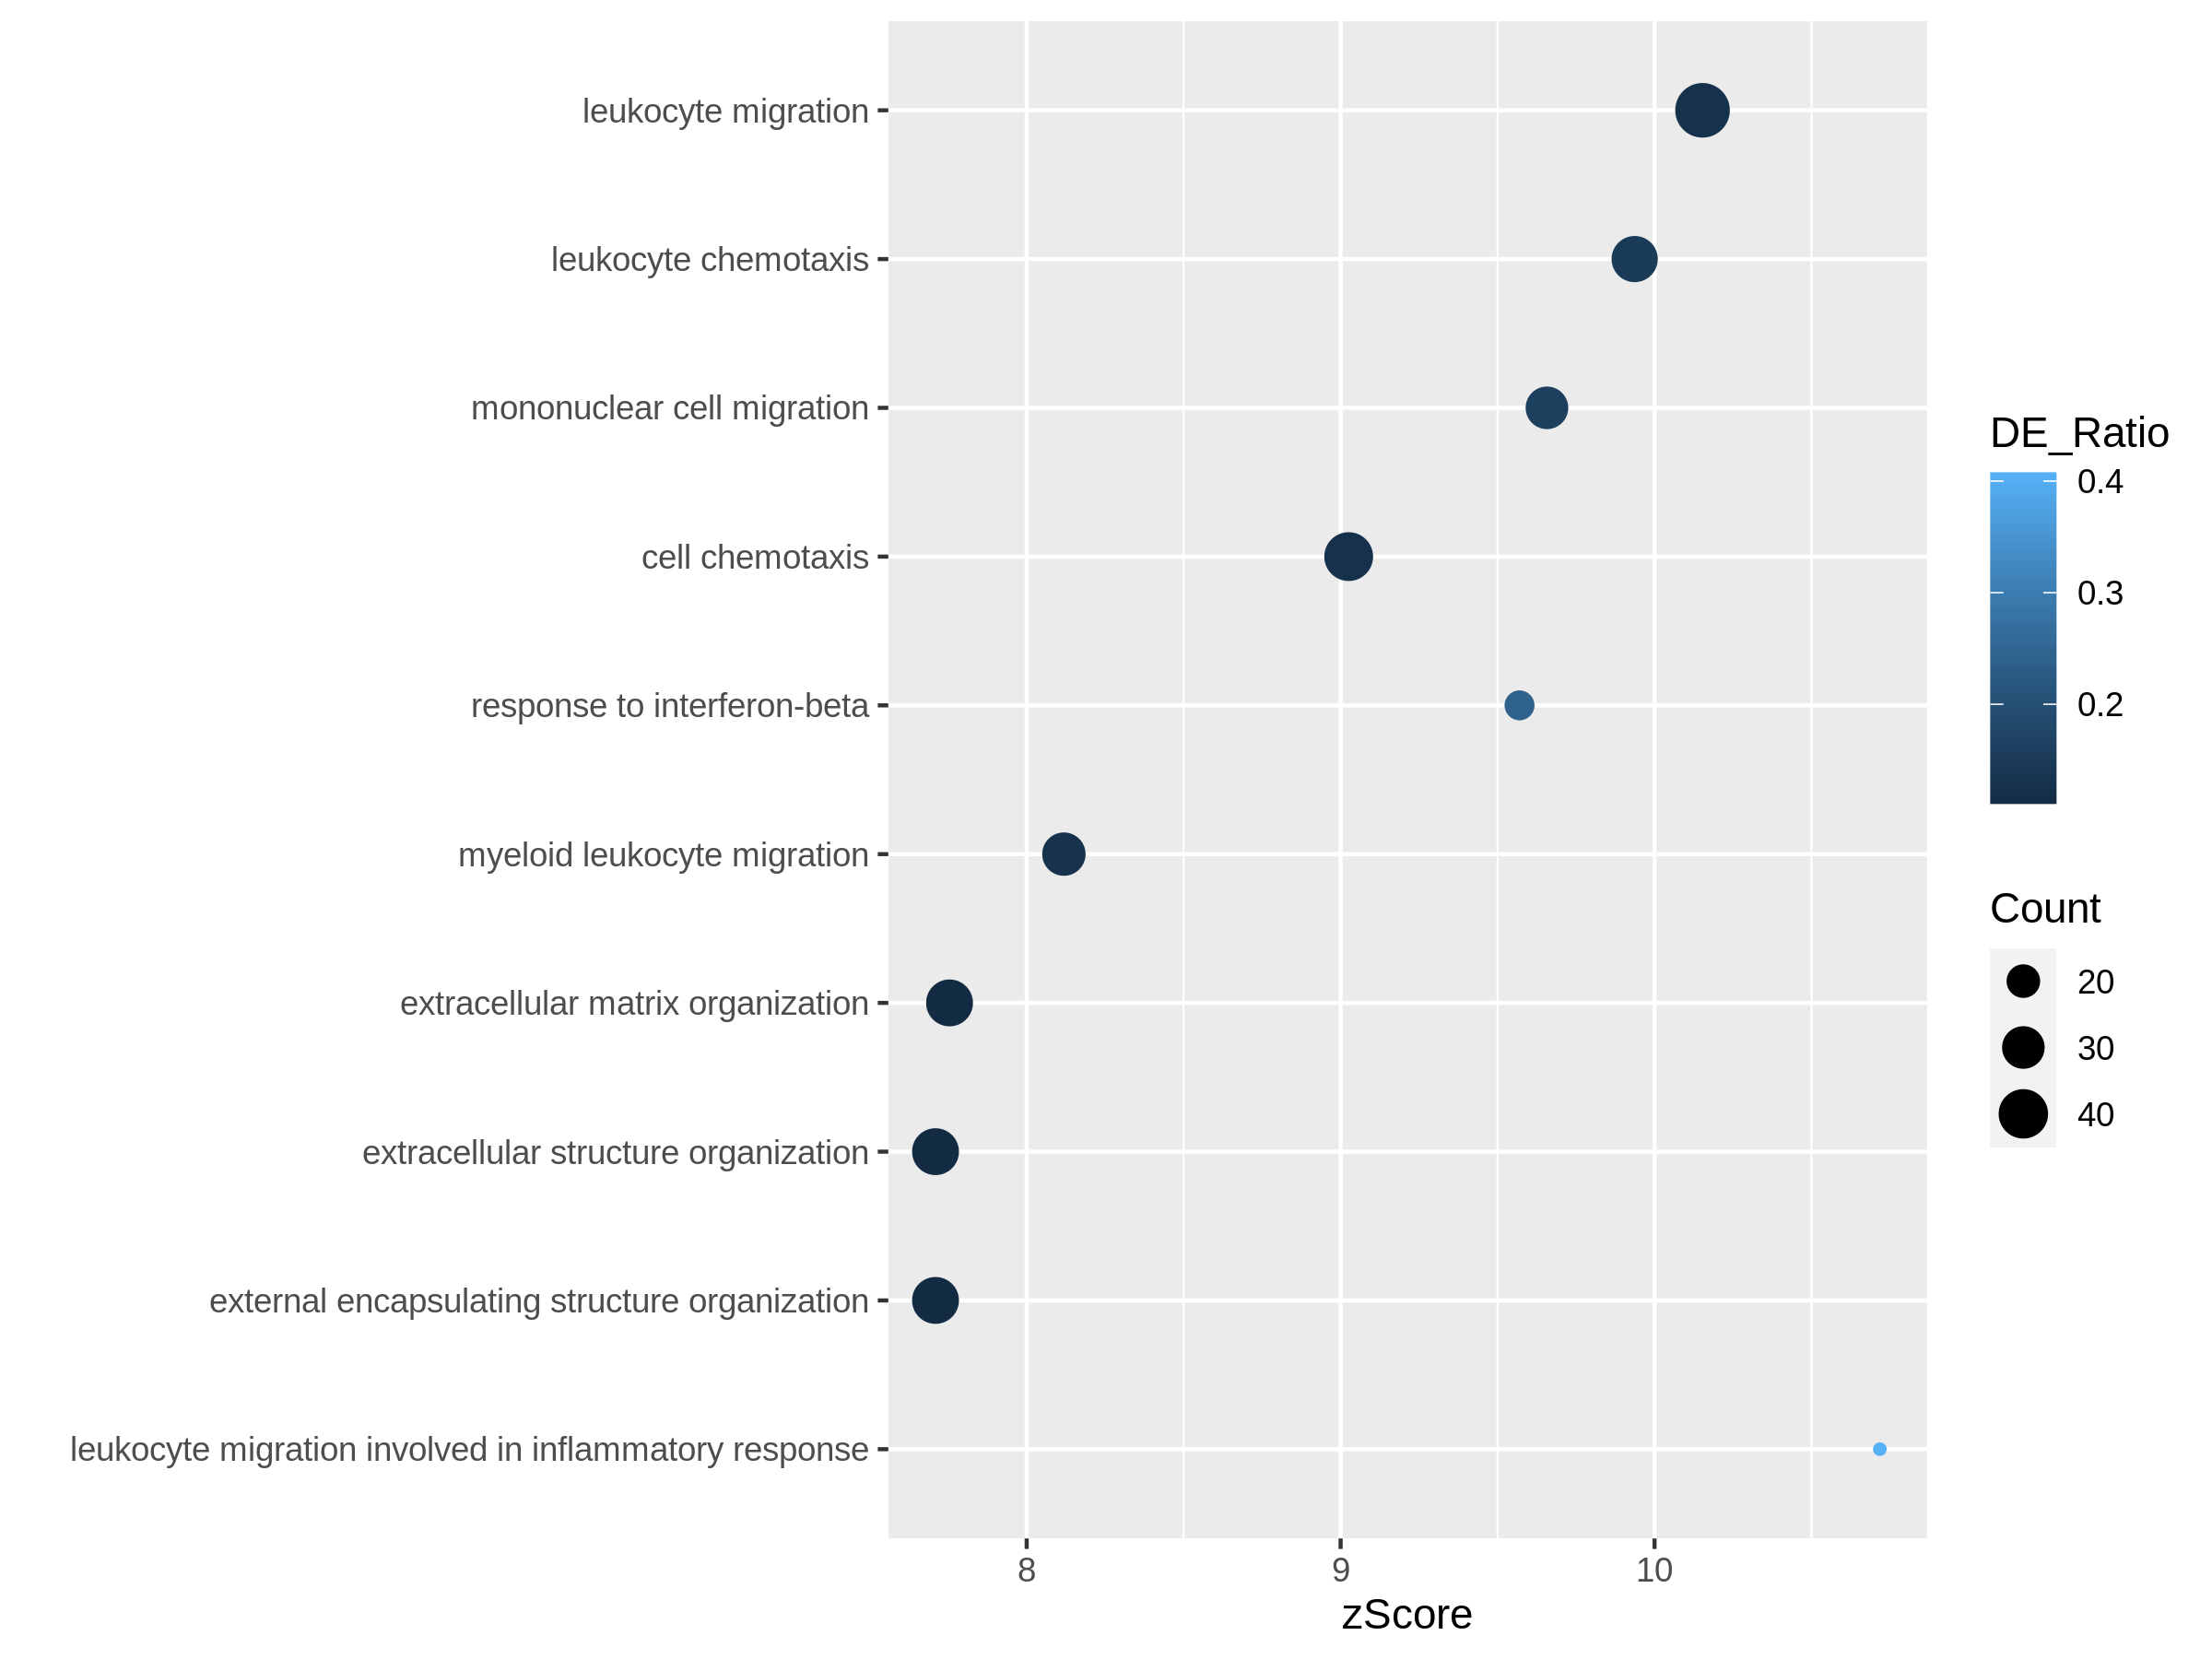
Figure 10
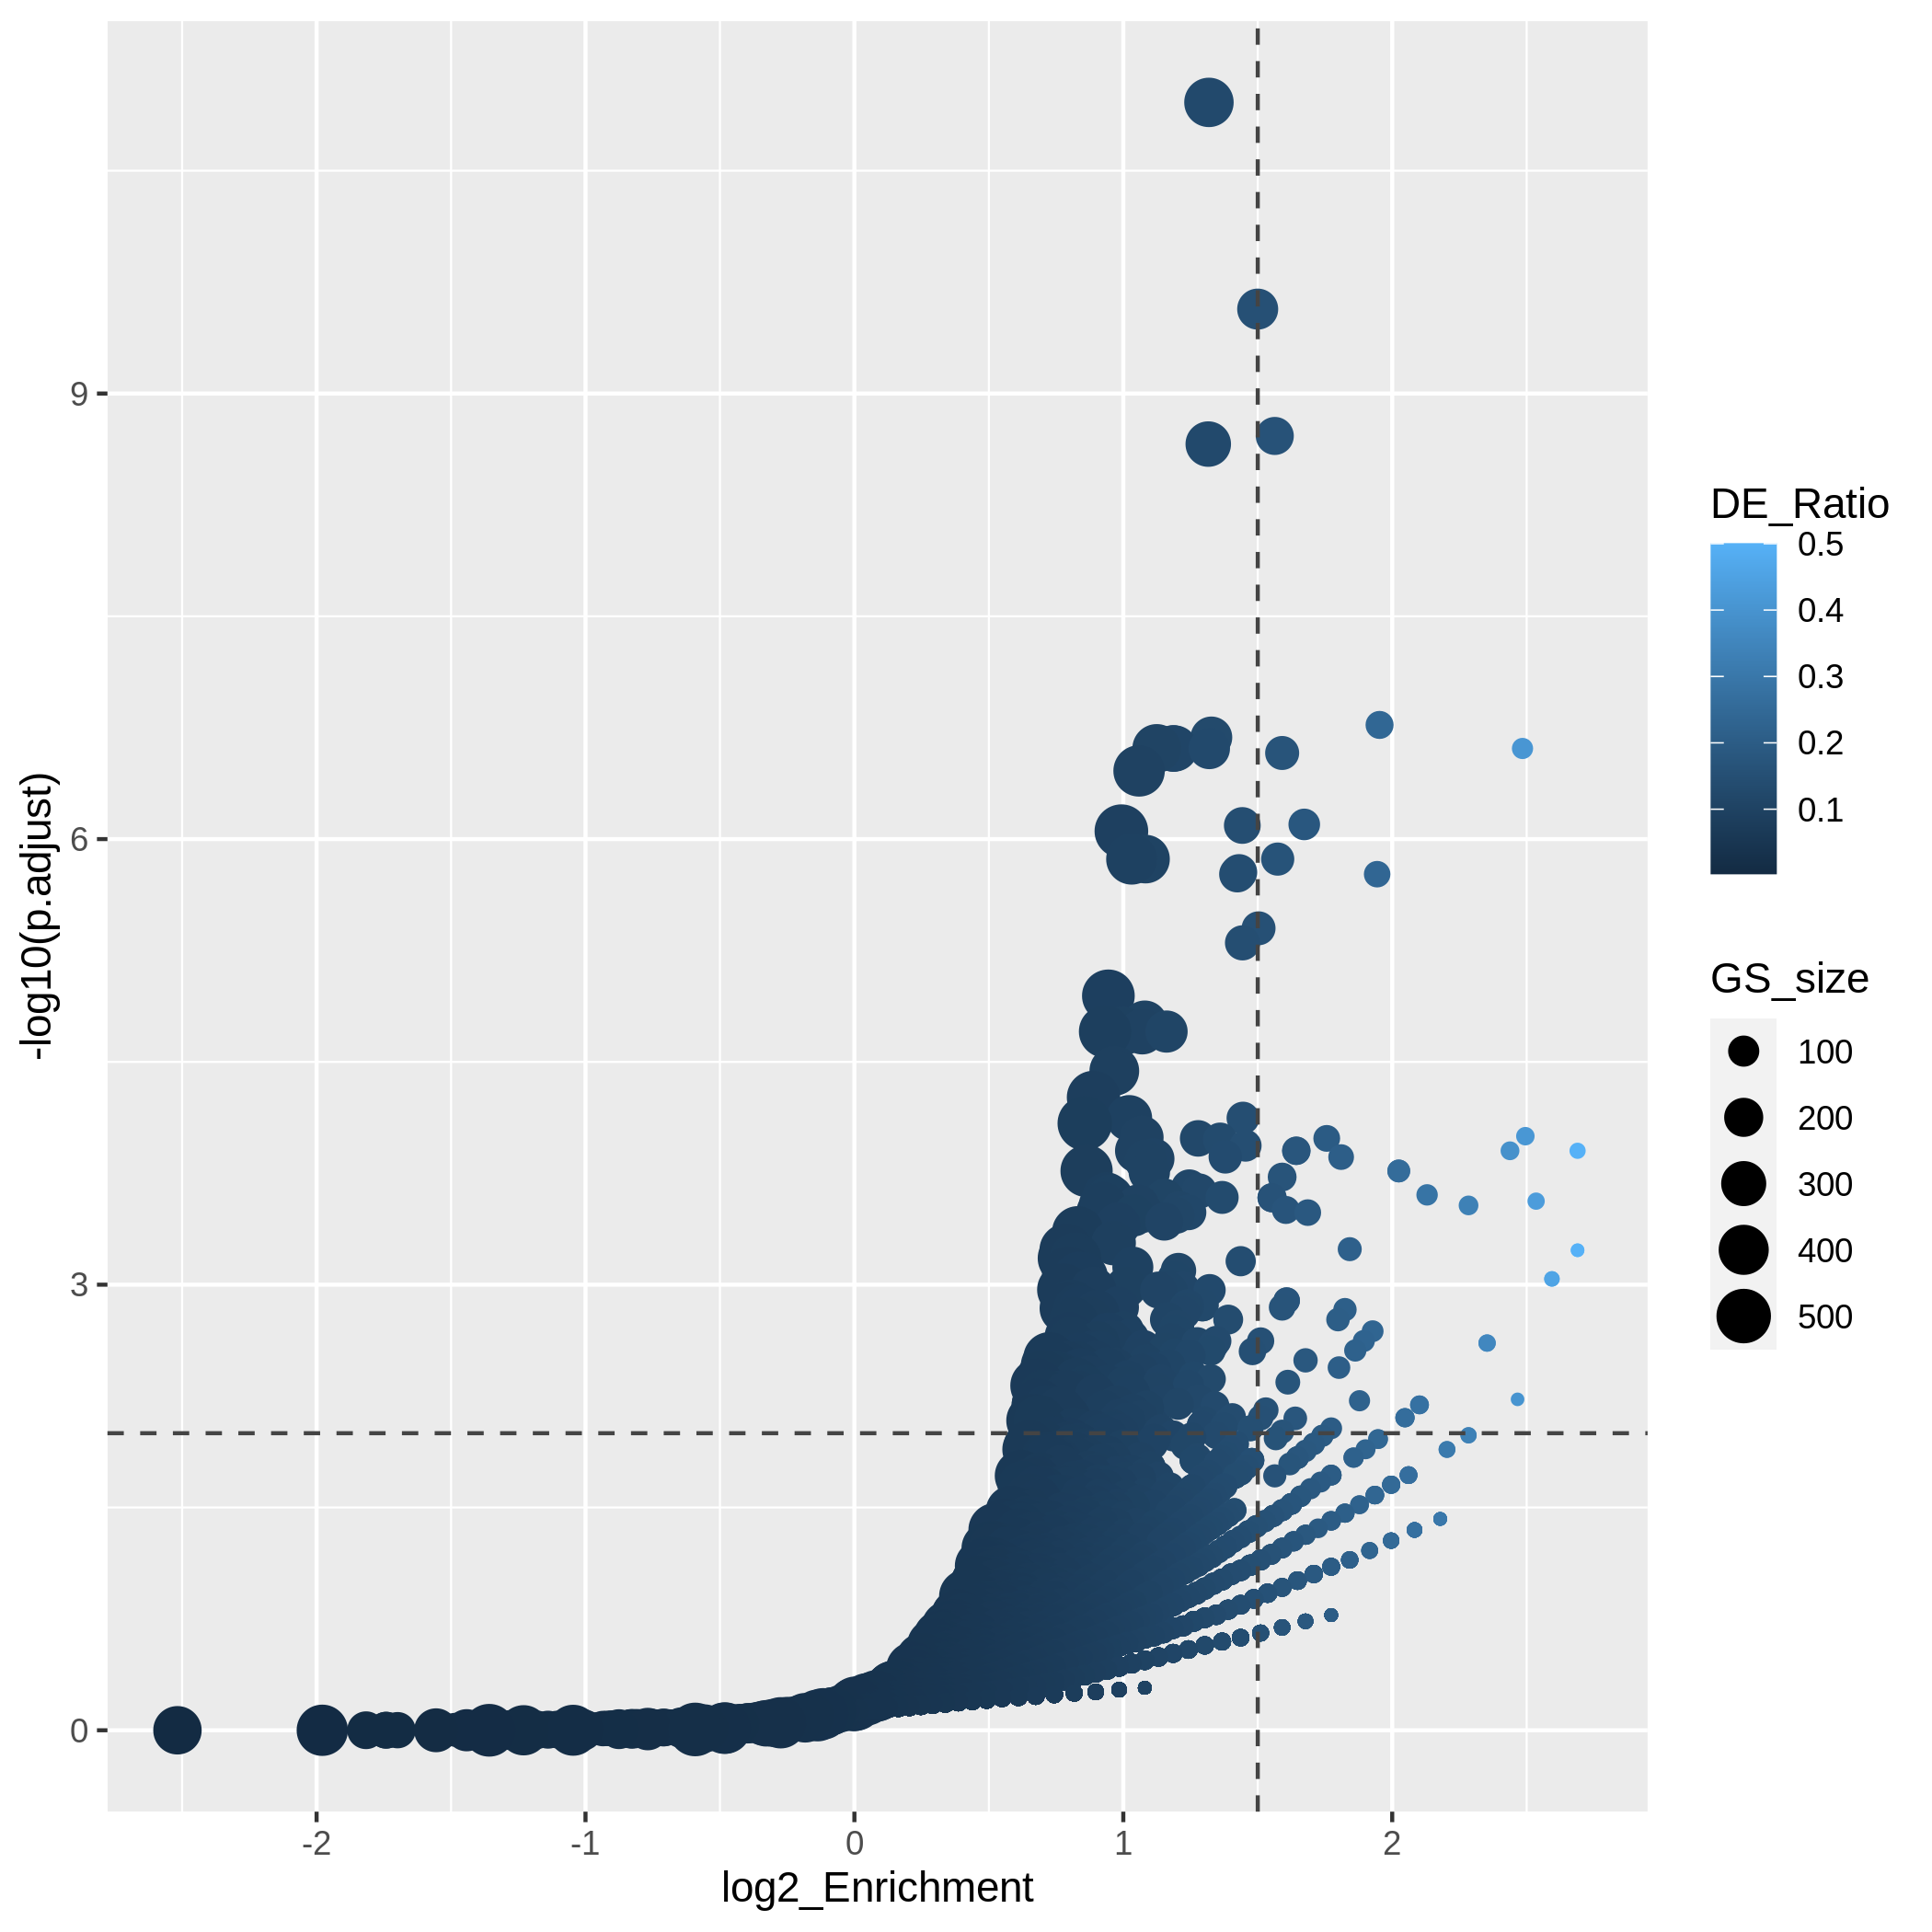
Figure 11
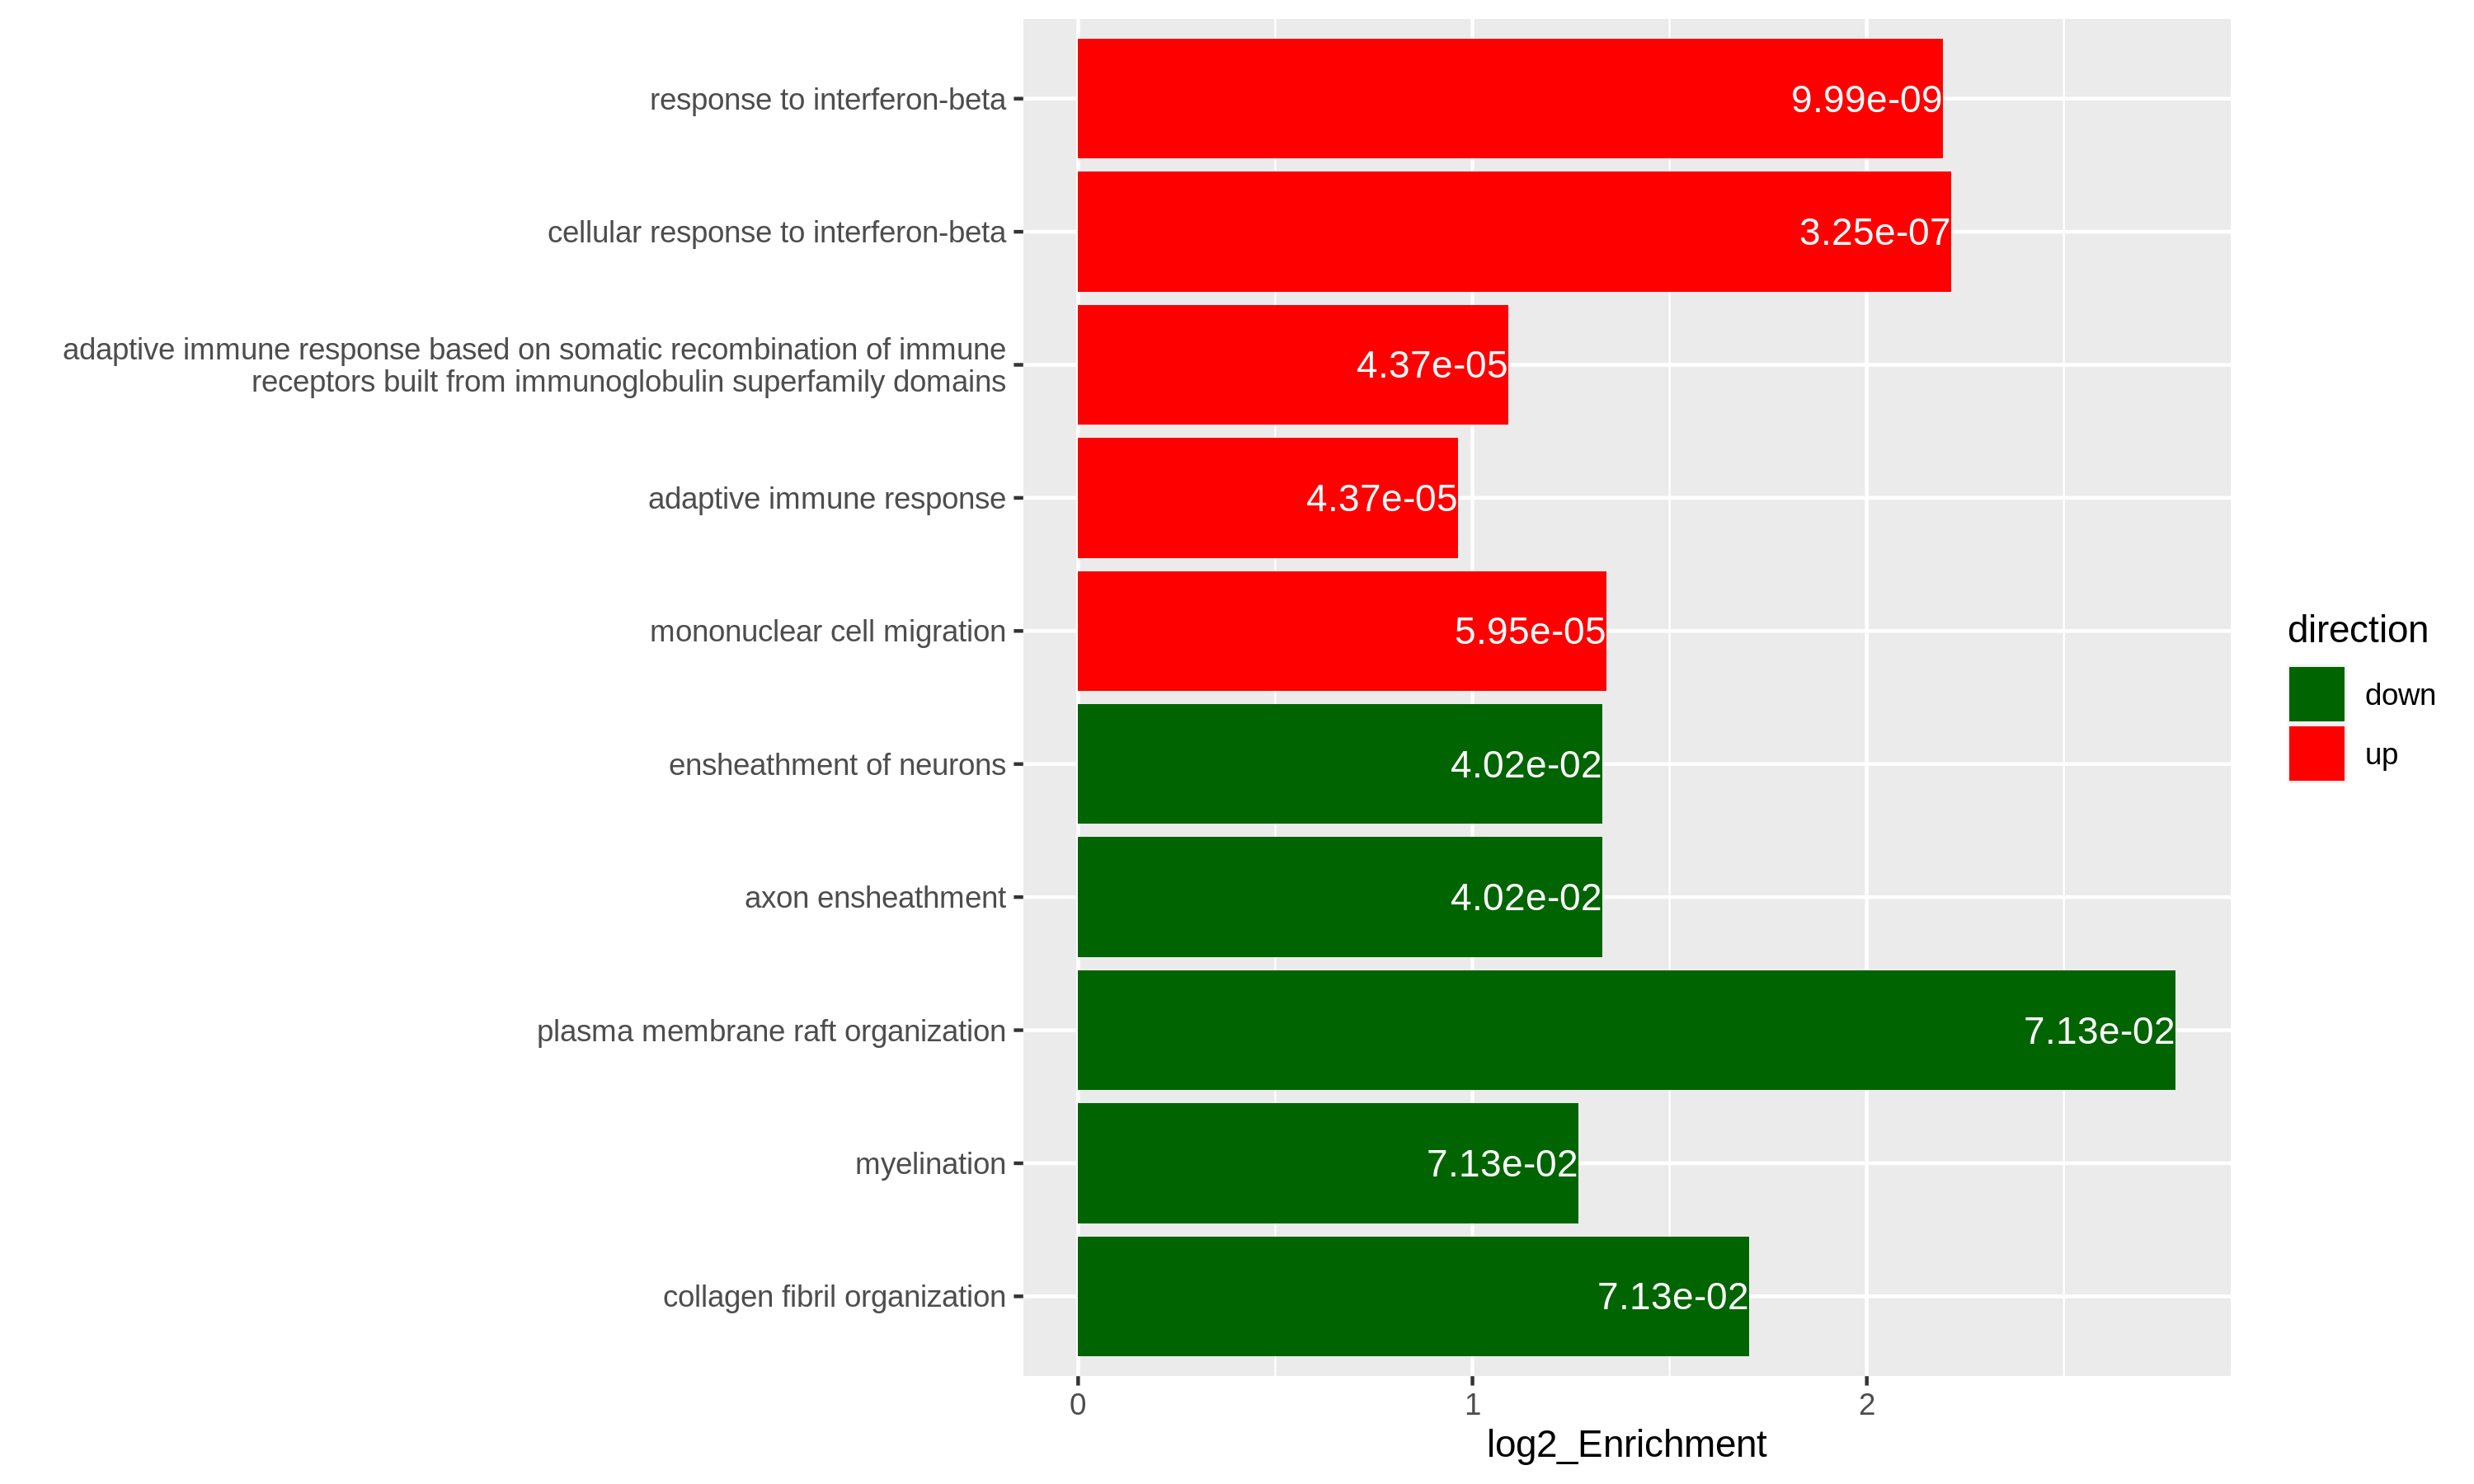
Figure 12
Next steps
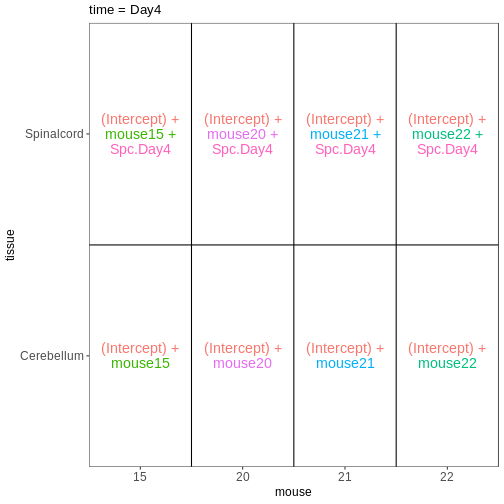
Extra exploration of design matrices
Figure 1
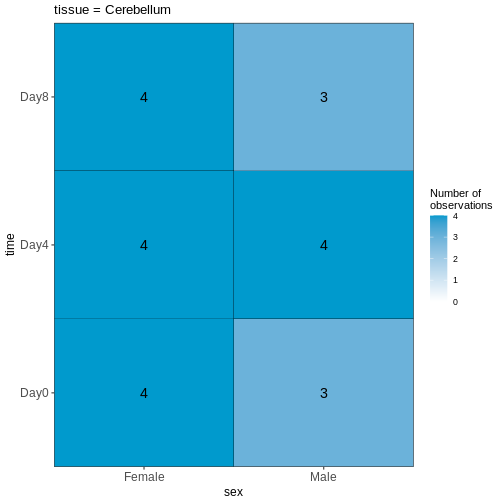
Figure 2
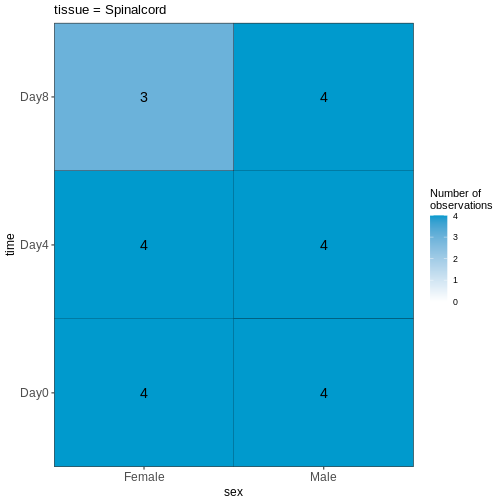
Figure 3
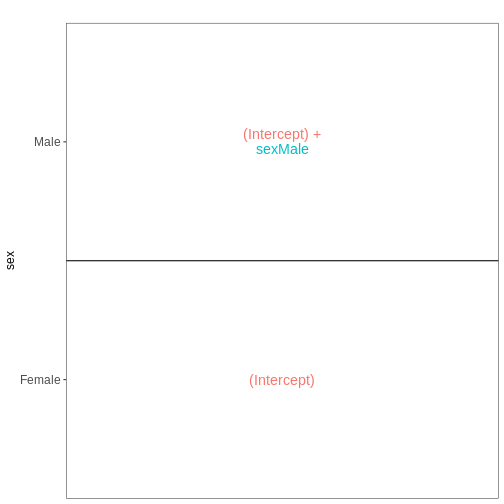
Figure 4
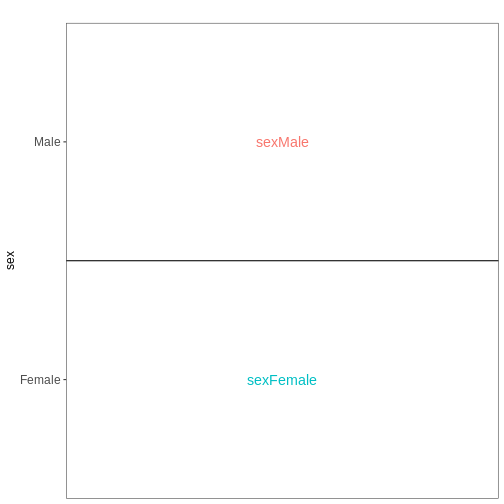
Figure 5
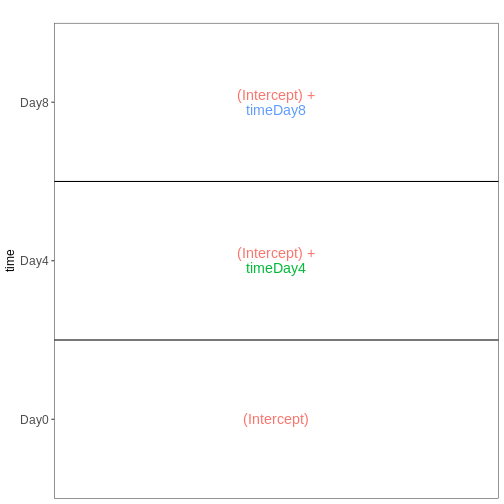
Figure 6
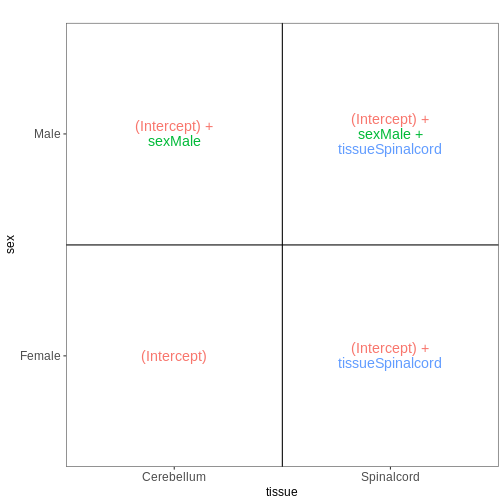
Figure 7
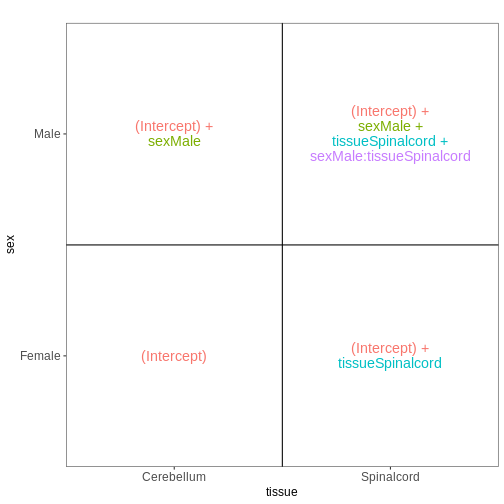
Figure 8
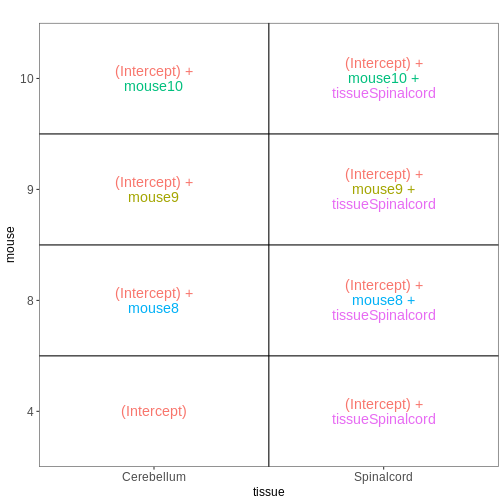
Figure 9
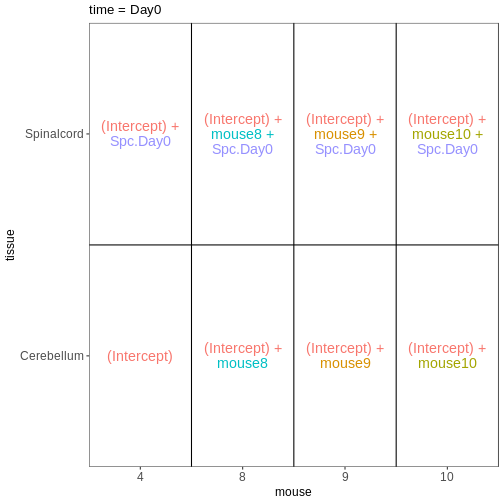
Figure 10