Make circular heatmaps
circos.heatmap.RdMake circular heatmaps
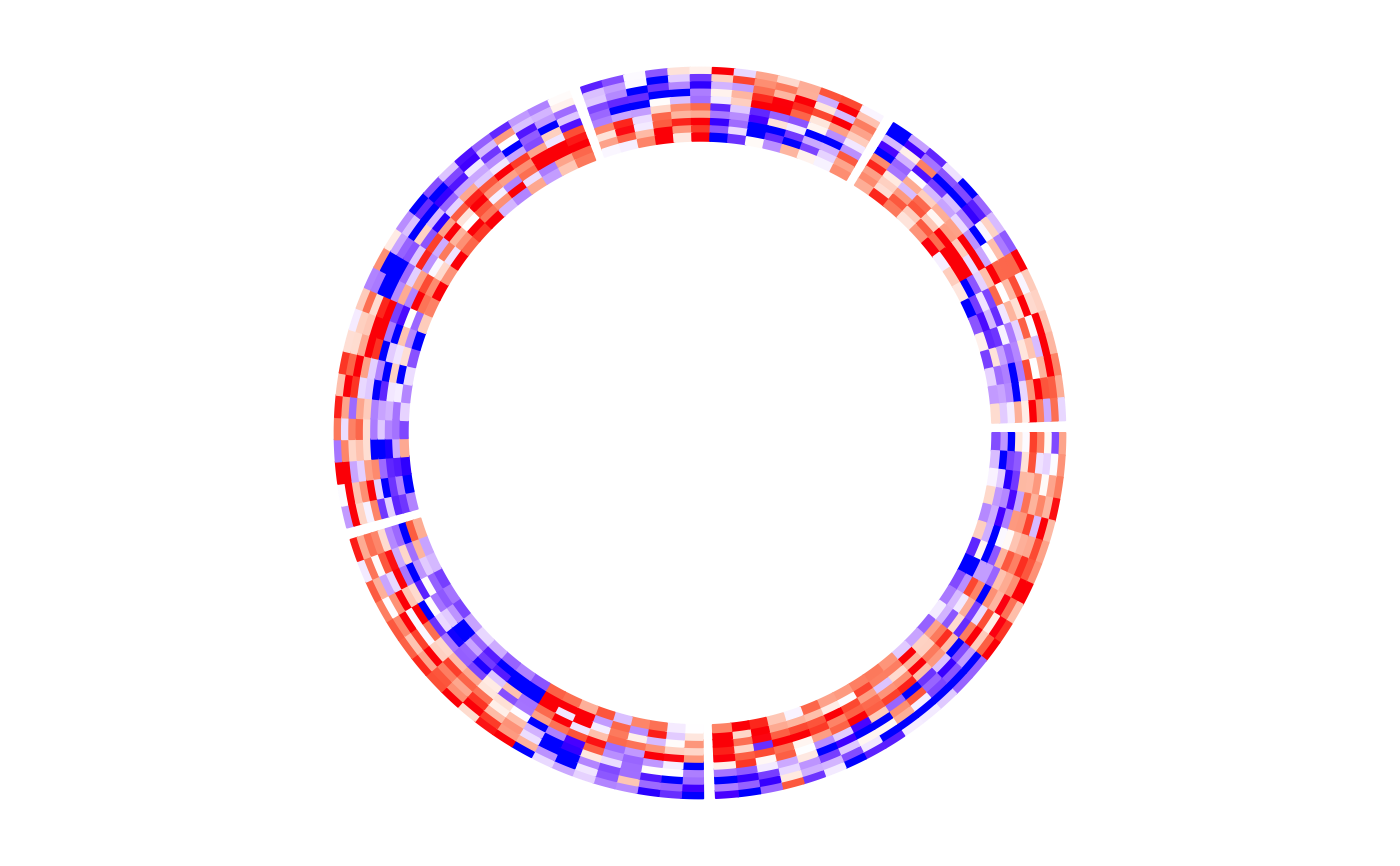
circos.heatmap(mat, split = NULL, col, na.col = "grey",
    bg.border = NA, bg.lty = par("lty"), bg.lwd = par("lwd"), ignore.white = TRUE,
    cluster = TRUE, clustering.method = "complete", distance.method = "euclidean",
    dend.callback = function(dend, m, si) reorder(dend, rowMeans(m)),
    dend.side = c("none", "outside", "inside"), dend.track.height = 0.1,
    rownames.side = c("none", "outside", "inside"), rownames.cex = 0.5,
    rownames.font = par("font"), rownames.col = "black",
    show.sector.labels = FALSE, ...)
Arguments
| mat | A matrix or a vector. The vector is transformed as a one-column matrix. |
|---|---|
| split | A categorical variable. It splits the matrix into a list of matrices. |
| col | If the values in the matrices are continuous, the color should be a color mapping generated by |
| na.col | Color for |
| bg.border | Color for background border. |
| bg.lty | Line type of the background border. |
| bg.lwd | Line width of the background border. |
| ignore.white | Whether to draw the white color? |
| cluster | whether to apply clustering on rows. |
| clustering.method | Clustering method, pass to |
| distance.method | Distance method, pass to |
| dend.callback | A callback function that is applied to the dendrogram in every sector. |
| dend.side | Side of the dendrograms relative to the heatmap track. |
| dend.track.height | Track height of the dendrograms. |
| rownames.side | Side of the row names relative to the heatmap track. |
| rownames.cex | Cex of row names. |
| rownames.font | Font of row names. |
| rownames.col | Color of row names. |
| show.sector.labels | Whether to show sector labels. |
| ... | Pass to |
See also
Examples
# \donttest{
set.seed(123)
mat1 = rbind(cbind(matrix(rnorm(50*5, mean = 1), nr = 50),
                   matrix(rnorm(50*5, mean = -1), nr = 50)),
             cbind(matrix(rnorm(50*5, mean = -1), nr = 50),
                   matrix(rnorm(50*5, mean = 1), nr = 50))
            )
rownames(mat1) = paste0("R", 1:100)
colnames(mat1) = paste0("C", 1:10)
mat1 = mat1[sample(100, 100), ] # randomly permute rows
split = sample(letters[1:5], 100, replace = TRUE)
spilt = factor(split, levels = letters[1:5])
col_fun1 = colorRamp2(c(-2, 0, 2), c("blue", "white", "red"))
circos.heatmap(mat1, split = split, col = col_fun1)circos.clear()
# }