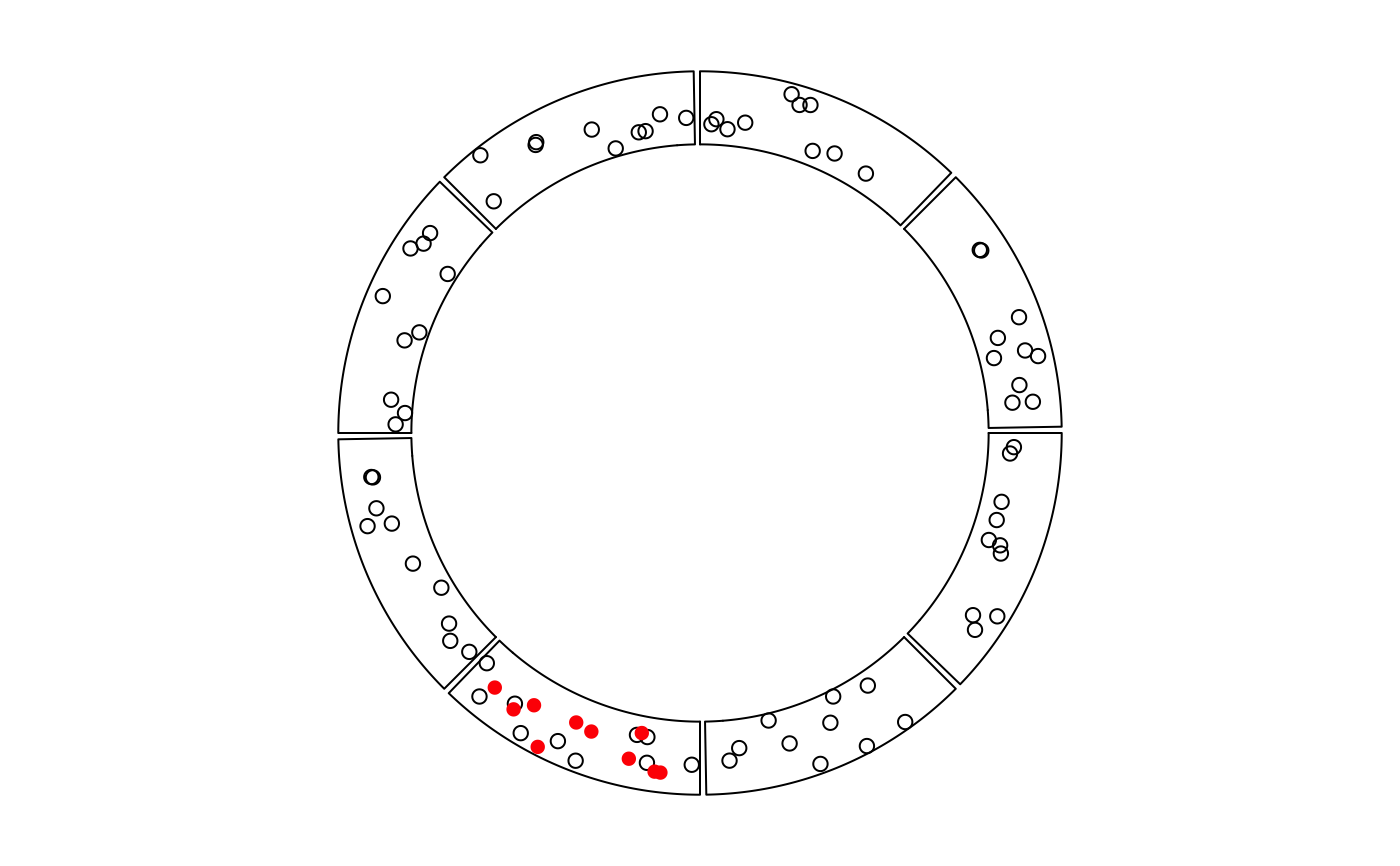
Add points to a plotting region
circos.points.RdAdd points to a plotting region
circos.points(
    x, y,
    sector.index = get.current.sector.index(),
    track.index = get.current.track.index(),
    pch = par("pch"),
    col = par("col"),
    cex = par("cex"),
    bg = par("bg"))
Arguments
| x | Data points on x-axis, measured in "current" data coordinate |
|---|---|
| y | Data points on y-axis, measured in "current" data coordinate |
| sector.index | Index for the sector |
| track.index | Index for the track |
| pch | Point type |
| col | Point color |
| cex | Point size |
| bg | backgrond of points |
Details
This function can only add points in one specified cell. Pretending a low-level plotting function, it can only be applied in plotting region which has been created.
You can think the function similar as the normal points
function, just adding points in the circular plotting region. The position of
cell is identified by sector.index and track.index, if they are not
specified, they are in 'current' sector and 'current' track.
Data points out of the plotting region will also be added, but with warning messages.
Other graphics parameters which are available in the function are pch, col
and cex which have same meaning as those in the par.
It is recommended to use circos.points inside panel.fun in circos.trackPlotRegion so that
it draws points directly on "curent" cell.