download PDF
category = paste0("category", "_", 1:9)
percent = sort(sample(40:80, 9))
color = rev(rainbow(length(percent)))

library(circlize)
circos.par("start.degree" = 90, cell.padding = c(0, 0, 0, 0))
circos.initialize("a", xlim = c(0, 100)) # 'a` just means there is one sector
circos.track(ylim = c(0.5, length(percent)+0.5), track.height = 0.8,
    bg.border = NA, panel.fun = function(x, y) {
        xlim = CELL_META$xlim
        circos.segments(rep(xlim[1], 9), 1:9,
                        rep(xlim[2], 9), 1:9,
                        col = "#CCCCCC")
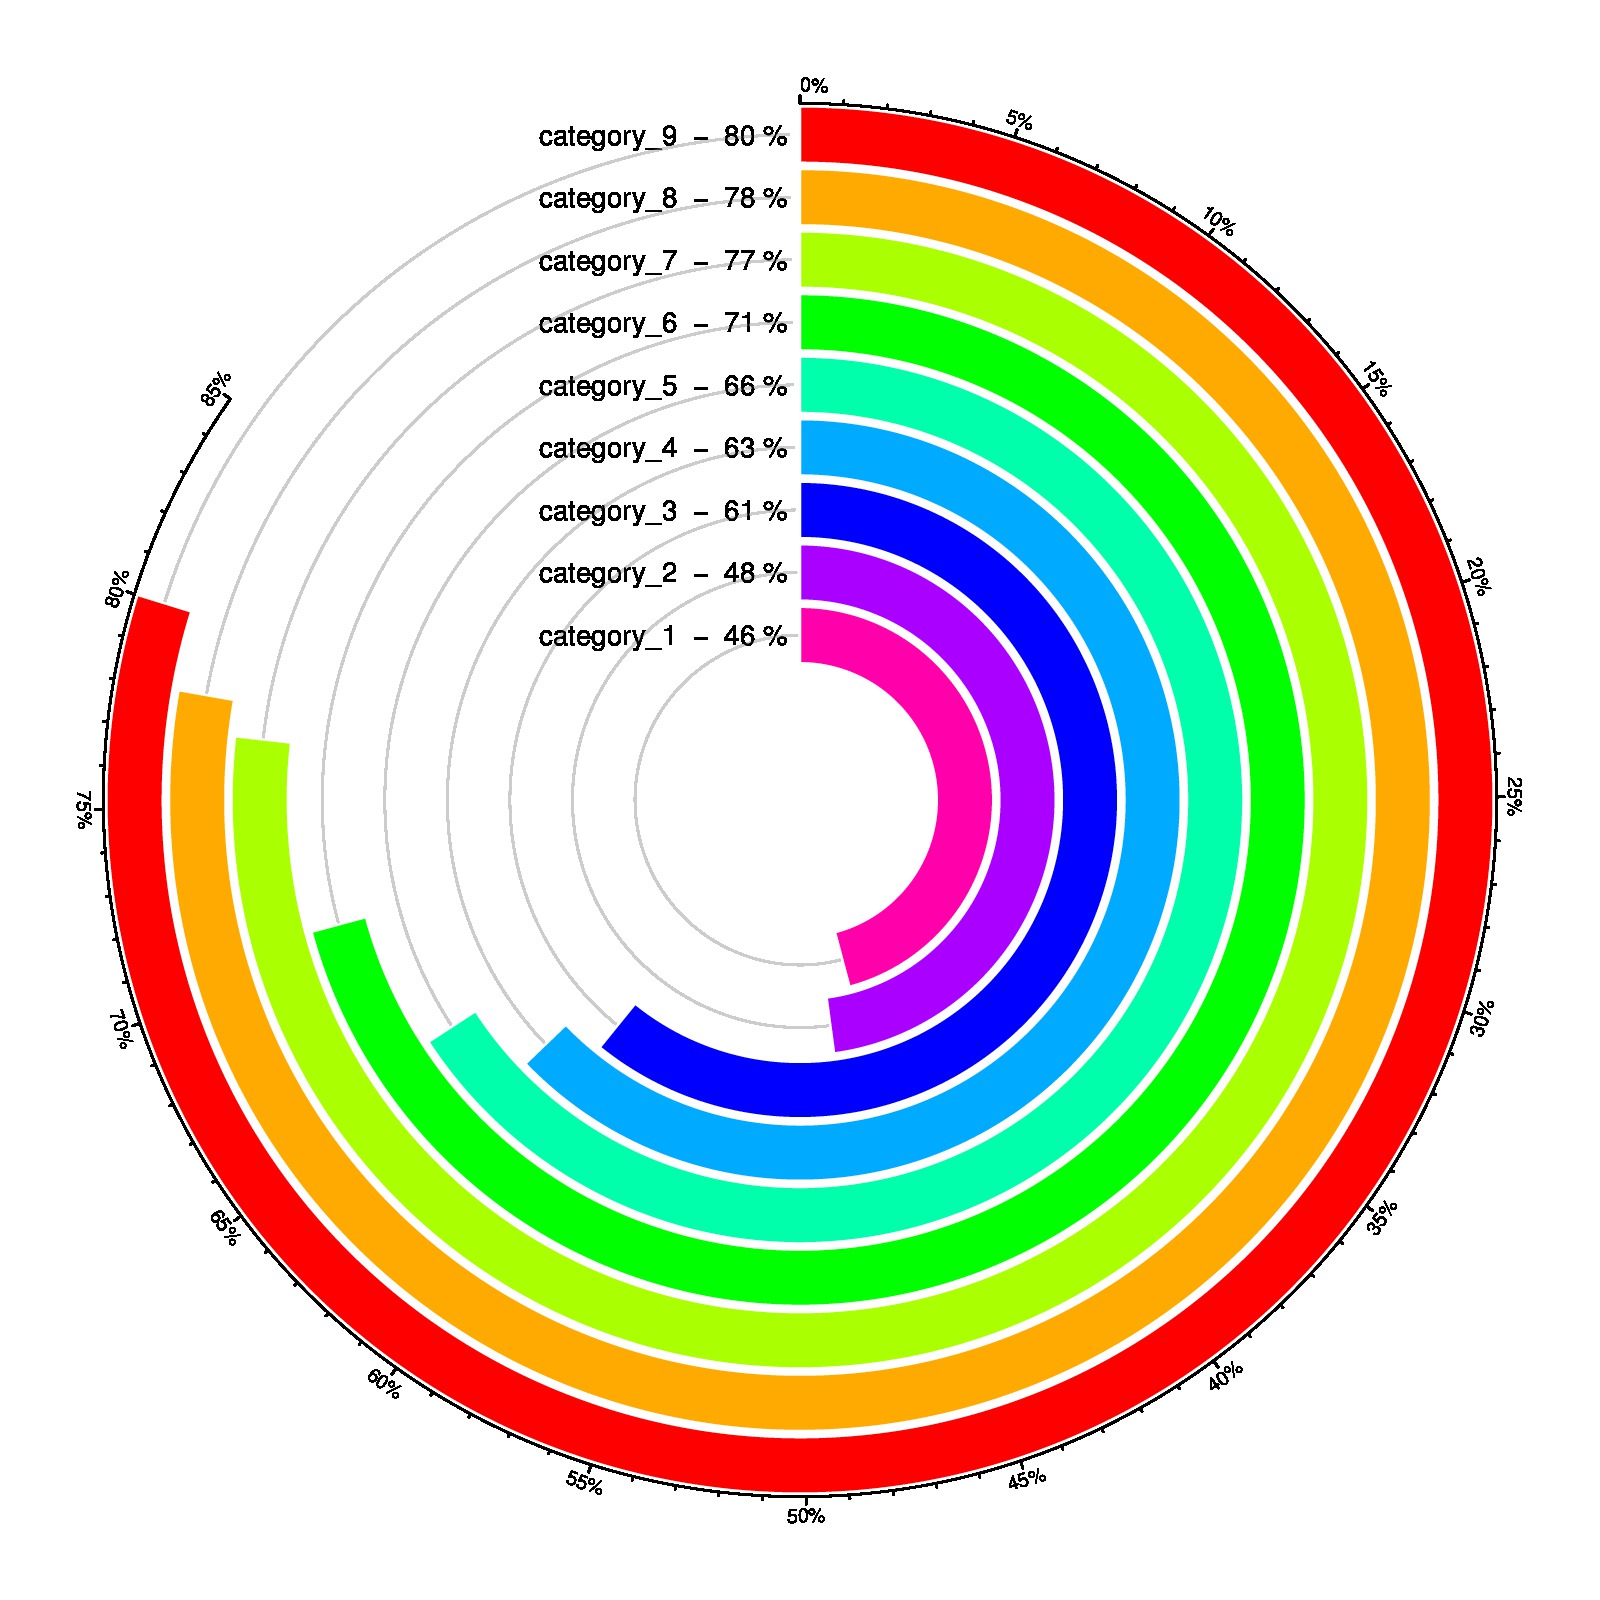
        circos.rect(rep(0, 9), 1:9 - 0.45, percent, 1:9 + 0.45,
            col = color, border = "white")
        circos.text(rep(xlim[1], 9), 1:9,
            paste(category, " - ", percent, "%"),
            facing = "downward", adj = c(1.05, 0.5), cex = 0.8)
        breaks = seq(0, 85, by = 5)
        circos.axis(h = "top", major.at = breaks, labels = paste0(breaks, "%"),
            labels.cex = 0.6)
})

