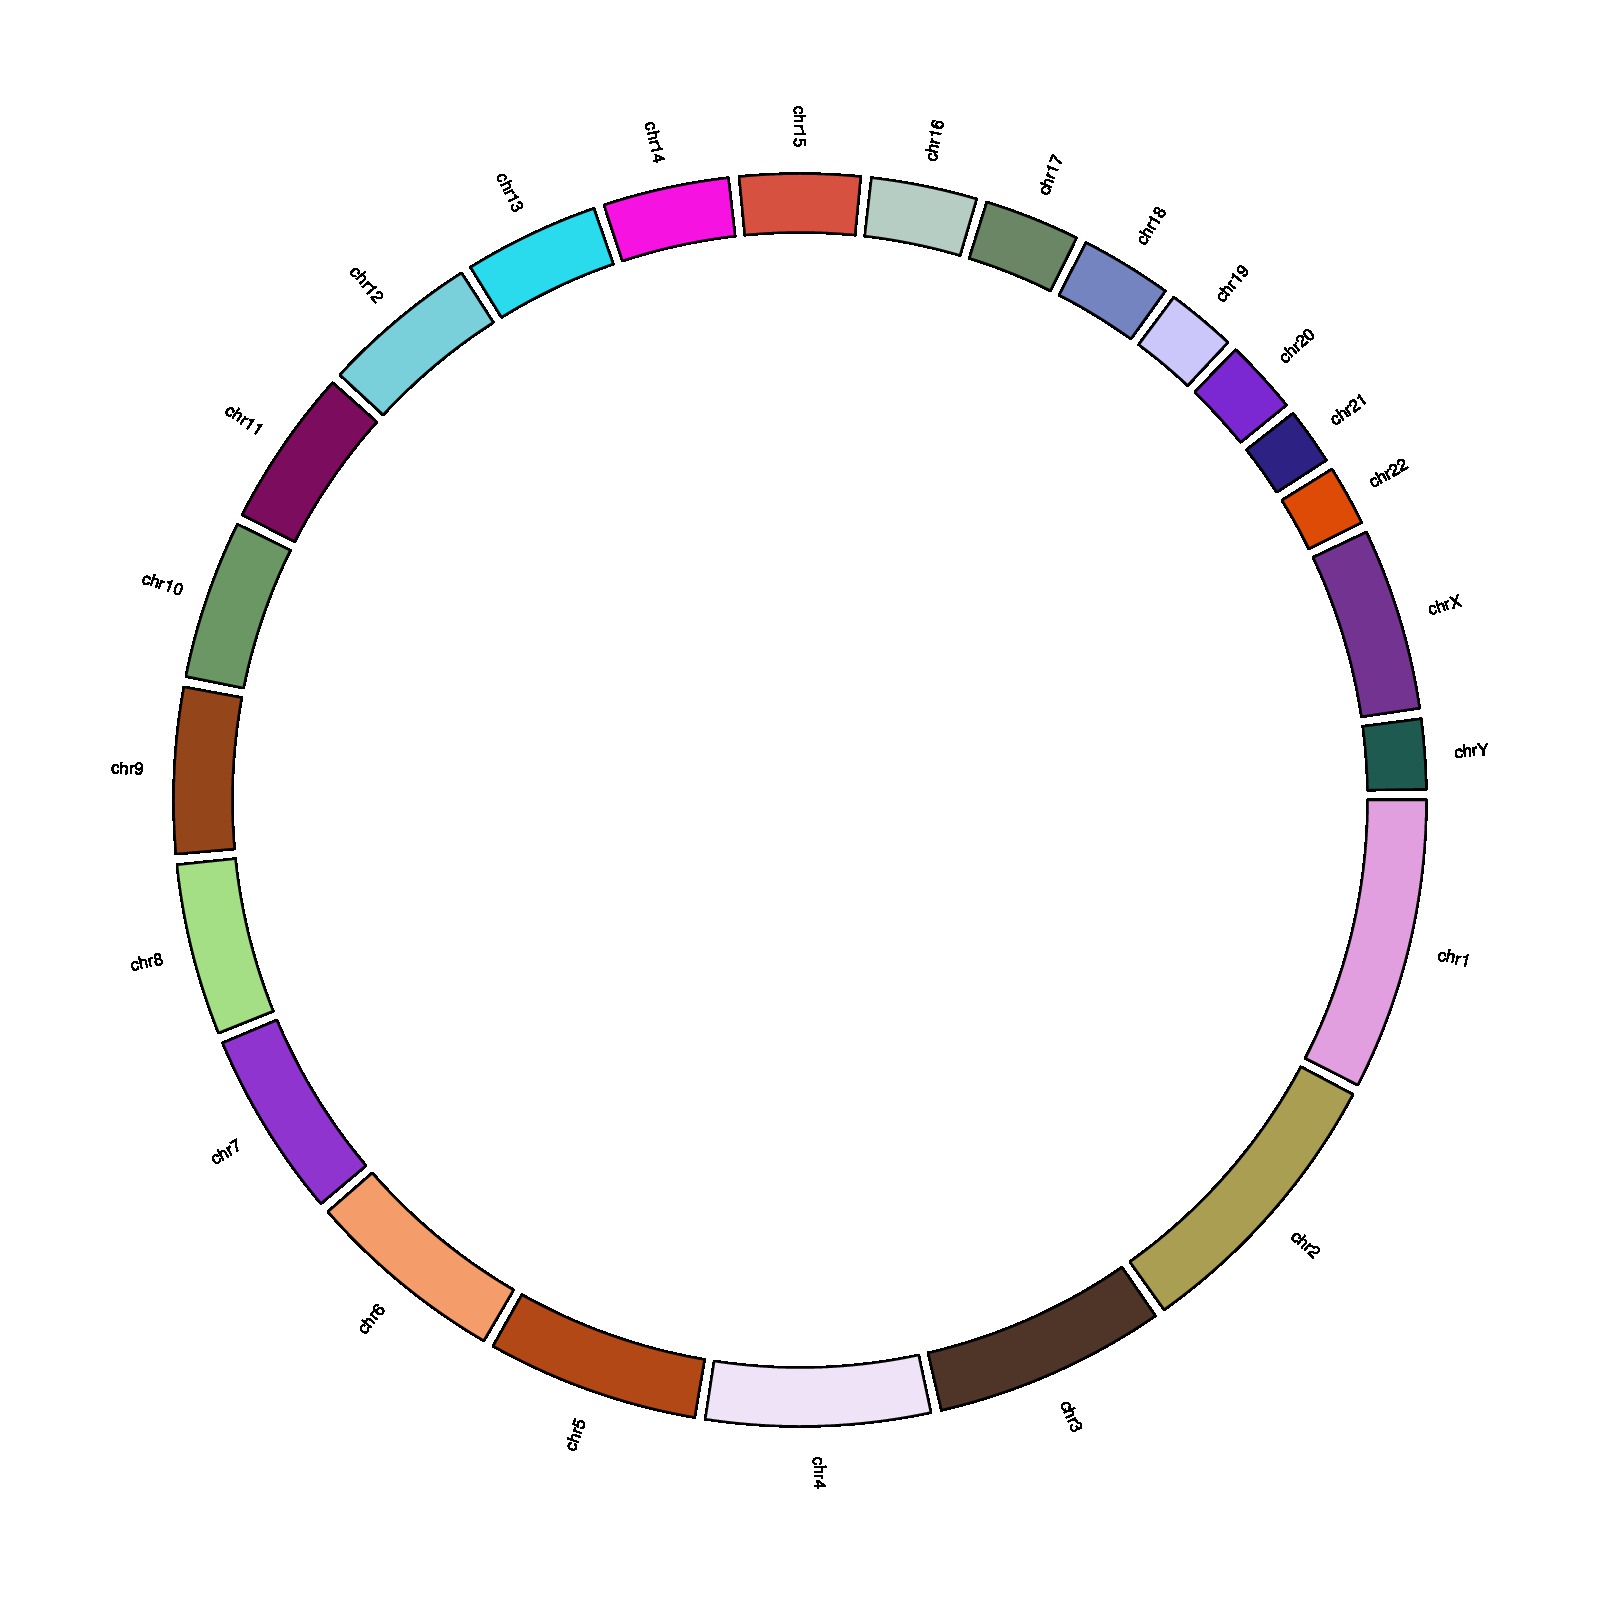
library(circlize)

circos.initializeWithIdeogram(plotType = NULL)

circos.trackPlotRegion(ylim = c(0, 1), panel.fun = function(x, y) {
    chr = get.cell.meta.data("sector.index")
    xlim = get.cell.meta.data("xlim")
    ylim = get.cell.meta.data("ylim")
    circos.rect(xlim[1], 0, xlim[2], 0.5,
        col = rgb(runif(1), runif(1), runif(1)))
    circos.text(mean(xlim), 0.9, chr, cex = 0.5, facing = "clockwise", niceFacing = TRUE)
}, bg.border = NA)

circos.clear()