files are: abandance.RData, otu.RData
load("example/abandance.RData")
load("example/otu.RData")
species = intersect(colnames(abandance), otu[[2]])
abandance = abandance[, species]
cate = rownames(abandance)[c(1:10)]
library(RColorBrewer)
col1 = brewer.pal(5, "Set1")
names(col1) = species
col2 = brewer.pal(length(cate), "Set3")
names(col2) = cate
df = NULL
for(type in cate) {
for(s in species) {
l = otu[[2]] == s
n = sum(l)
n = 1
dd = data.frame(type = rep(type, n), species = rep(s, n), vaule1 = abandance[type, s], value2 = sum(otu[l, type]))
df = rbind(df, dd)
}
}
df[[1]] = as.character(df[[1]])
df[[2]] = as.character(df[[2]])
sector = NULL
sector_xlim = NULL
for(t in unique(df[[1]])) {
sector = c(sector, t)
sector_xlim = rbind(sector_xlim, c(0, sum(df[df[[1]] == t, 3])))
}
for(t in unique(df[[2]])) {
sector = c(sector, t)
sector_xlim = rbind(sector_xlim, c(0, sum(df[df[[2]] == t, 4])))
}
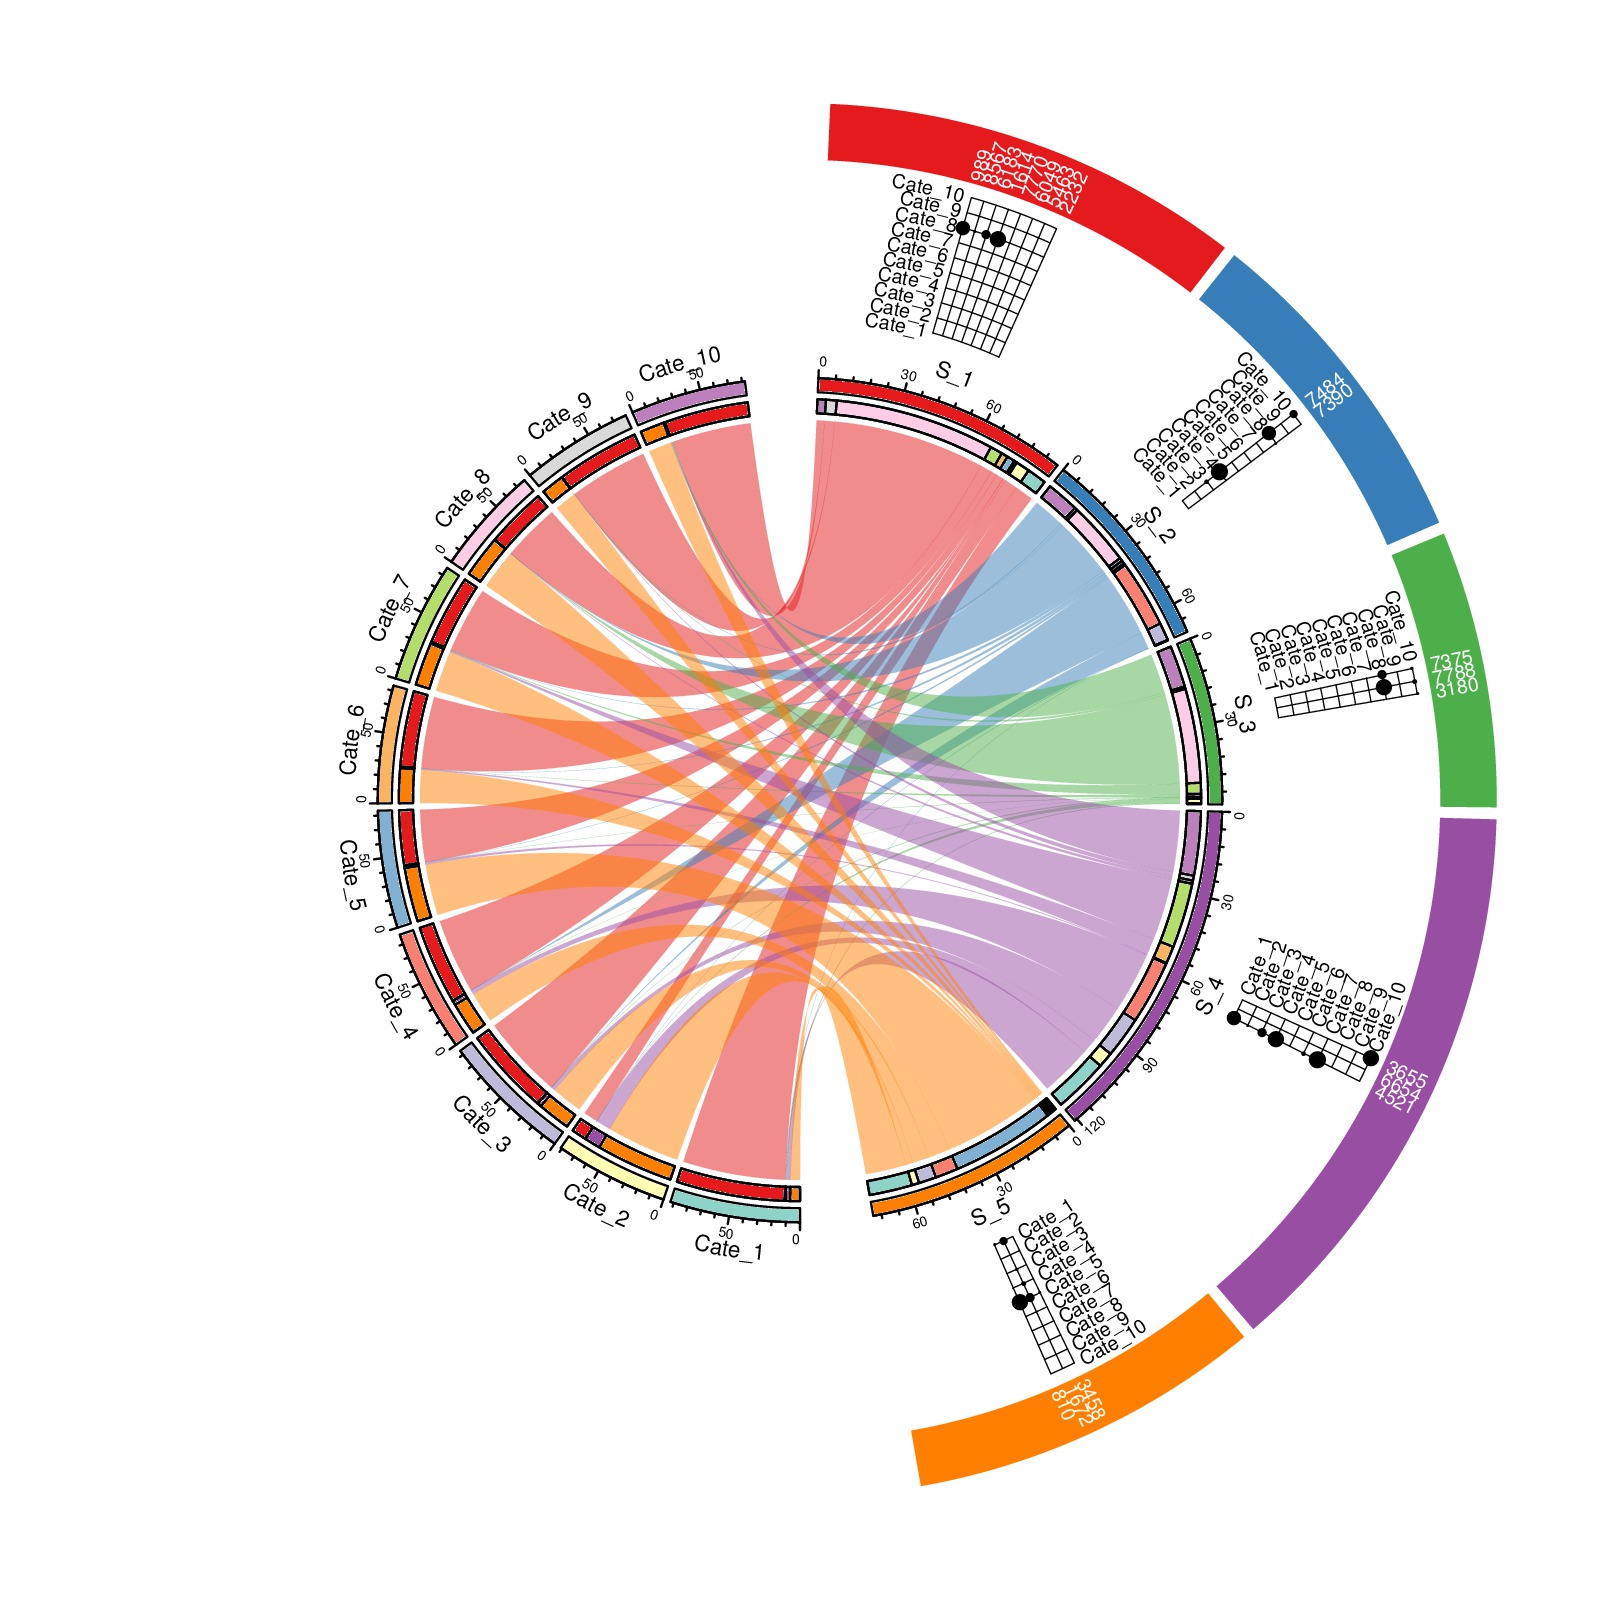
library(circlize)
circos.par(cell.padding = c(0, 0, 0, 0), start.degree = 270, gap.degree = c(1, 1, 1, 1, 1, 1, 1, 1, 1, 10, 1, 1, 1, 1, 10))
circos.initialize(factors = factor(sector, levels = sector), xlim = sector_xlim,
sector.width = c(sector_xlim[1:10,2]/sum(sector_xlim[1:10,2]), 1*sector_xlim[11:15,2]/sum(sector_xlim[11:15,2])))
circos.trackPlotRegion(ylim = c(0, 1), panel.fun = function(x, y) {
sector.index = get.cell.meta.data("sector.index")
if(sector.index %in% sector[11:15]) {
xlim = get.cell.meta.data("xlim")
ylim = get.cell.meta.data("ylim")
l = otu[[2]] == sector.index
x = seq(0, by = 3, length = sum(l))
x = x + mean(xlim) - mean(x)
circos.rect(xlim[1], ylim[1], xlim[2], ylim[2], col = col1[sector.index], border = NA)
circos.text(x, rep(0, sum(l)), otu[l, 1], col = "white", facing = "clockwise", niceFacing = TRUE, adj = c(-0.1, 0.5), cex = 0.6)
}
}, bg.border = NA, track.height = 0.08)
circos.trackPlotRegion(ylim = c(1, 10), panel.fun = function(x, y) {
sector.index = get.cell.meta.data("sector.index")
xlim = get.cell.meta.data("xlim")
ylim = get.cell.meta.data("ylim")
if(sector.index %in% sector[11:15]) {
l = otu[[2]] == sector.index
df = otu[l, sector[1:10]]
x = seq(0, by = 3, length = sum(l))
x = x + mean(xlim) - mean(x)
for(i in seq_len(nrow(df))) {
circos.lines(c(x[i], x[i]), c(1, ncol(df)), lwd = 0.5)
}
for(j in seq_len(ncol(df))) {
circos.lines(c(x[1], x[nrow(df)]), c(j, j), lwd = 0.5)
}
for(i in seq_len(nrow(df))) {
for(j in seq_len(ncol(df))) {
circos.points(x[i], j, pch = 16, cex = df[i,j]/20)
}
}
if(sector.index %in% sector[11:15]) {
circos.text(rep(x[1], ncol(df)), seq_len(ncol(df)), colnames(df), cex = 0.6, facing = "bending.inside", niceFacing = TRUE, adj = c(1.1, 0.5))
}
}
}, bg.border = NA, track.height = 0.2)
circos.trackPlotRegion(ylim = c(0, 1), panel.fun = function(x, y) {
sector.index = get.cell.meta.data("sector.index")
xlim = get.cell.meta.data("xlim")
ylim = get.cell.meta.data("ylim")
circos.text(mean(xlim), mean(ylim), sector.index, cex = 0.7, facing = "bending.inside", niceFacing = TRUE)
}, track.height = 0.05, bg.border = NA)
circos.trackPlotRegion(ylim = c(0, 1), panel.fun = function(x, y) {
circos.axis(h = "top", labels.cex = 0.4)
}, track.height = 0.02, bg.col = c(col2, col1), track.margin = c(0, 0.01))
circos.trackPlotRegion(ylim = c(0, 1), panel.fun = function(x, y) {
}, track.height = 0.02, track.margin = c(0, 0.01))
accum_species = sapply(species, function(x) get.cell.meta.data("xrange", sector.index = x)); names(accum_species) = species
accum_cate = sapply(cate, function(x) get.cell.meta.data("xrange", sector.index = x)); names(accum_cate) = cate
for(i in seq_len(nrow(df))) {
circos.link(df[i,1], c(accum_cate[df[i,1]], accum_cate[df[i,1]] - df[i, 3]),
df[i,2], c(accum_species[df[i,2]], accum_species[df[i,2]] - df[i, 4]),
col = paste0(col1[df[i,2]], "80"), border = NA)
circos.rect(accum_cate[df[i,1]], 0, accum_cate[df[i,1]] - df[i, 3], 1, sector.index = df[i,1], col = col1[df[i,2]])
circos.rect(accum_species[df[i,2]], 0, accum_species[df[i,2]] - df[i, 4], 1, sector.index = df[i,2], col = col2[df[i,1]])
accum_cate[df[i,1]] = accum_cate[df[i,1]] - df[i, 3]
accum_species[df[i,2]] = accum_species[df[i,2]] - df[i, 4]
}
circos.clear()