In this post I test the performance (the running time) of four heatmap
functions: gplots::heatmap.2(), heatmap() which is natively supported in R,
ComplexHeatmap::Heatmap() and pheatmap::pheatmap().
We generate a 1000x1000 random matrix.
library(ComplexHeatmap)
library(pheatmap)
library(gplots)
library(microbenchmark)

set.seed(123)
n = 1000
mat = matrix(rnorm(n*n), nrow = n)
First I test drawing heatmaps as well as drawing dendrograms (with applying clustering):
t1 = microbenchmark(
	"heatmap()" = {
		pdf(NULL)
		heatmap(mat)
		dev.off()
	},
	"heatmap.2()" = {
		pdf(NULL)
		heatmap.2(mat, trace = "none")
		dev.off()
	},
	"Heatmap()" = {
		pdf(NULL)
		draw(Heatmap(mat))
		dev.off()
	},
	"pheatmap()" = {
		pdf(NULL)
		pheatmap(mat)
		dev.off()
	},
	times = 5
)
print(t1, unit = "s")
## Unit: seconds
##         expr   min    lq  mean median    uq   max neval
##    heatmap() 1.086 1.108 1.123  1.112 1.119 1.191     5
##  heatmap.2() 1.208 1.216 1.227  1.216 1.245 1.249     5
##    Heatmap() 2.026 2.092 2.239  2.108 2.316 2.652     5
##   pheatmap() 1.041 1.062 1.253  1.081 1.120 1.963     5
The running time for all four heatmap functions looks similar, it might due to that
clustering uses most of the running time. Heatmap() runs the longest, perhaps
because Heatmap() applies additional manipulations on the dendrograms such as
dendrogram reordering.
Next I suppress the clustering on both rows and columns and with no dendrogram.
t2 = microbenchmark(
	"heatmap()" = {
		pdf(NULL)
		heatmap(mat, Rowv = NA, Colv = NA)
		dev.off()
	},
	"heatmap.2()" = {
		pdf(NULL)
		heatmap.2(mat, dendrogram = "none", trace = "none")
		dev.off()
	},
	"Heatmap()" = {
		pdf(NULL)
		draw(Heatmap(mat, cluster_rows = FALSE, cluster_columns = FALSE))
		dev.off()
	},
	"pheatmap()" = {
		pdf(NULL)
		pheatmap(mat, cluster_rows = FALSE, cluster_cols = FALSE)
		dev.off()
	},
	times = 5
)
print(t2, unit = "s")
## Unit: seconds
##         expr     min      lq    mean  median      uq     max neval
##    heatmap() 0.06572 0.06697 0.06827 0.06854 0.06965 0.07045     5
##  heatmap.2() 1.01206 1.01250 1.02451 1.02615 1.02971 1.04213     5
##    Heatmap() 0.63882 0.70302 0.70789 0.70660 0.71154 0.77945     5
##   pheatmap() 0.30356 0.31478 0.49993 0.32006 0.32127 1.23999     5
Now heatmap.2() now is the slowest if only draw the heatmap bodies.
Next I perform clustering in advance and send the clustering objects to the heatmap functions. In this setting, dendrograms are also drawn along with the heatmaps.
row_hc = hclust(dist(mat))
col_hc = hclust(dist(t(mat)))
t3 = microbenchmark(
	"heatmap()" = {
		pdf(NULL)
		heatmap(mat, Rowv = as.dendrogram(row_hc), Colv = as.dendrogram(col_hc))
		dev.off()
	},
	"heatmap.2()" = {
		pdf(NULL)
		heatmap.2(mat, Rowv = row_hc, Colv = col_hc, trace = "none")
		dev.off()
	},
	"Heatmap()" = {
		pdf(NULL)
		draw(Heatmap(mat, cluster_rows = row_hc, cluster_columns = col_hc))
		dev.off()
	},
	"pheatmap()" = {
		pdf(NULL)
		pheatmap(mat, cluster_rows = row_hc, cluster_cols = col_hc)
		dev.off()
	},
	times = 5
)
print(t3, unit = "s")
## Unit: seconds
##         expr    min     lq   mean median     uq    max neval
##    heatmap() 0.2581 0.2663 0.2697 0.2745 0.2745 0.2749     5
##  heatmap.2() 1.0431 1.0634 1.1048 1.1203 1.1308 1.1663     5
##    Heatmap() 1.1672 1.1731 1.2106 1.1865 1.2222 1.3039     5
##   pheatmap() 0.3184 0.3263 0.5307 0.3855 0.3875 1.2358     5
Finally I put the mean running time into a table for easy comparison:
heatmap() |
heatmap.2() |
Heatmap() |
pheatmap() |
|
| do clustering, draw dendrograms | 1.12s |
1.23s |
2.24s |
1.25s |
| no clusteirng, no dendrogram | 0.07s |
1.02s |
0.71s |
0.50s |
| only draw dendrograms | 0.27s |
1.10s |
1.21s |
0.53s |
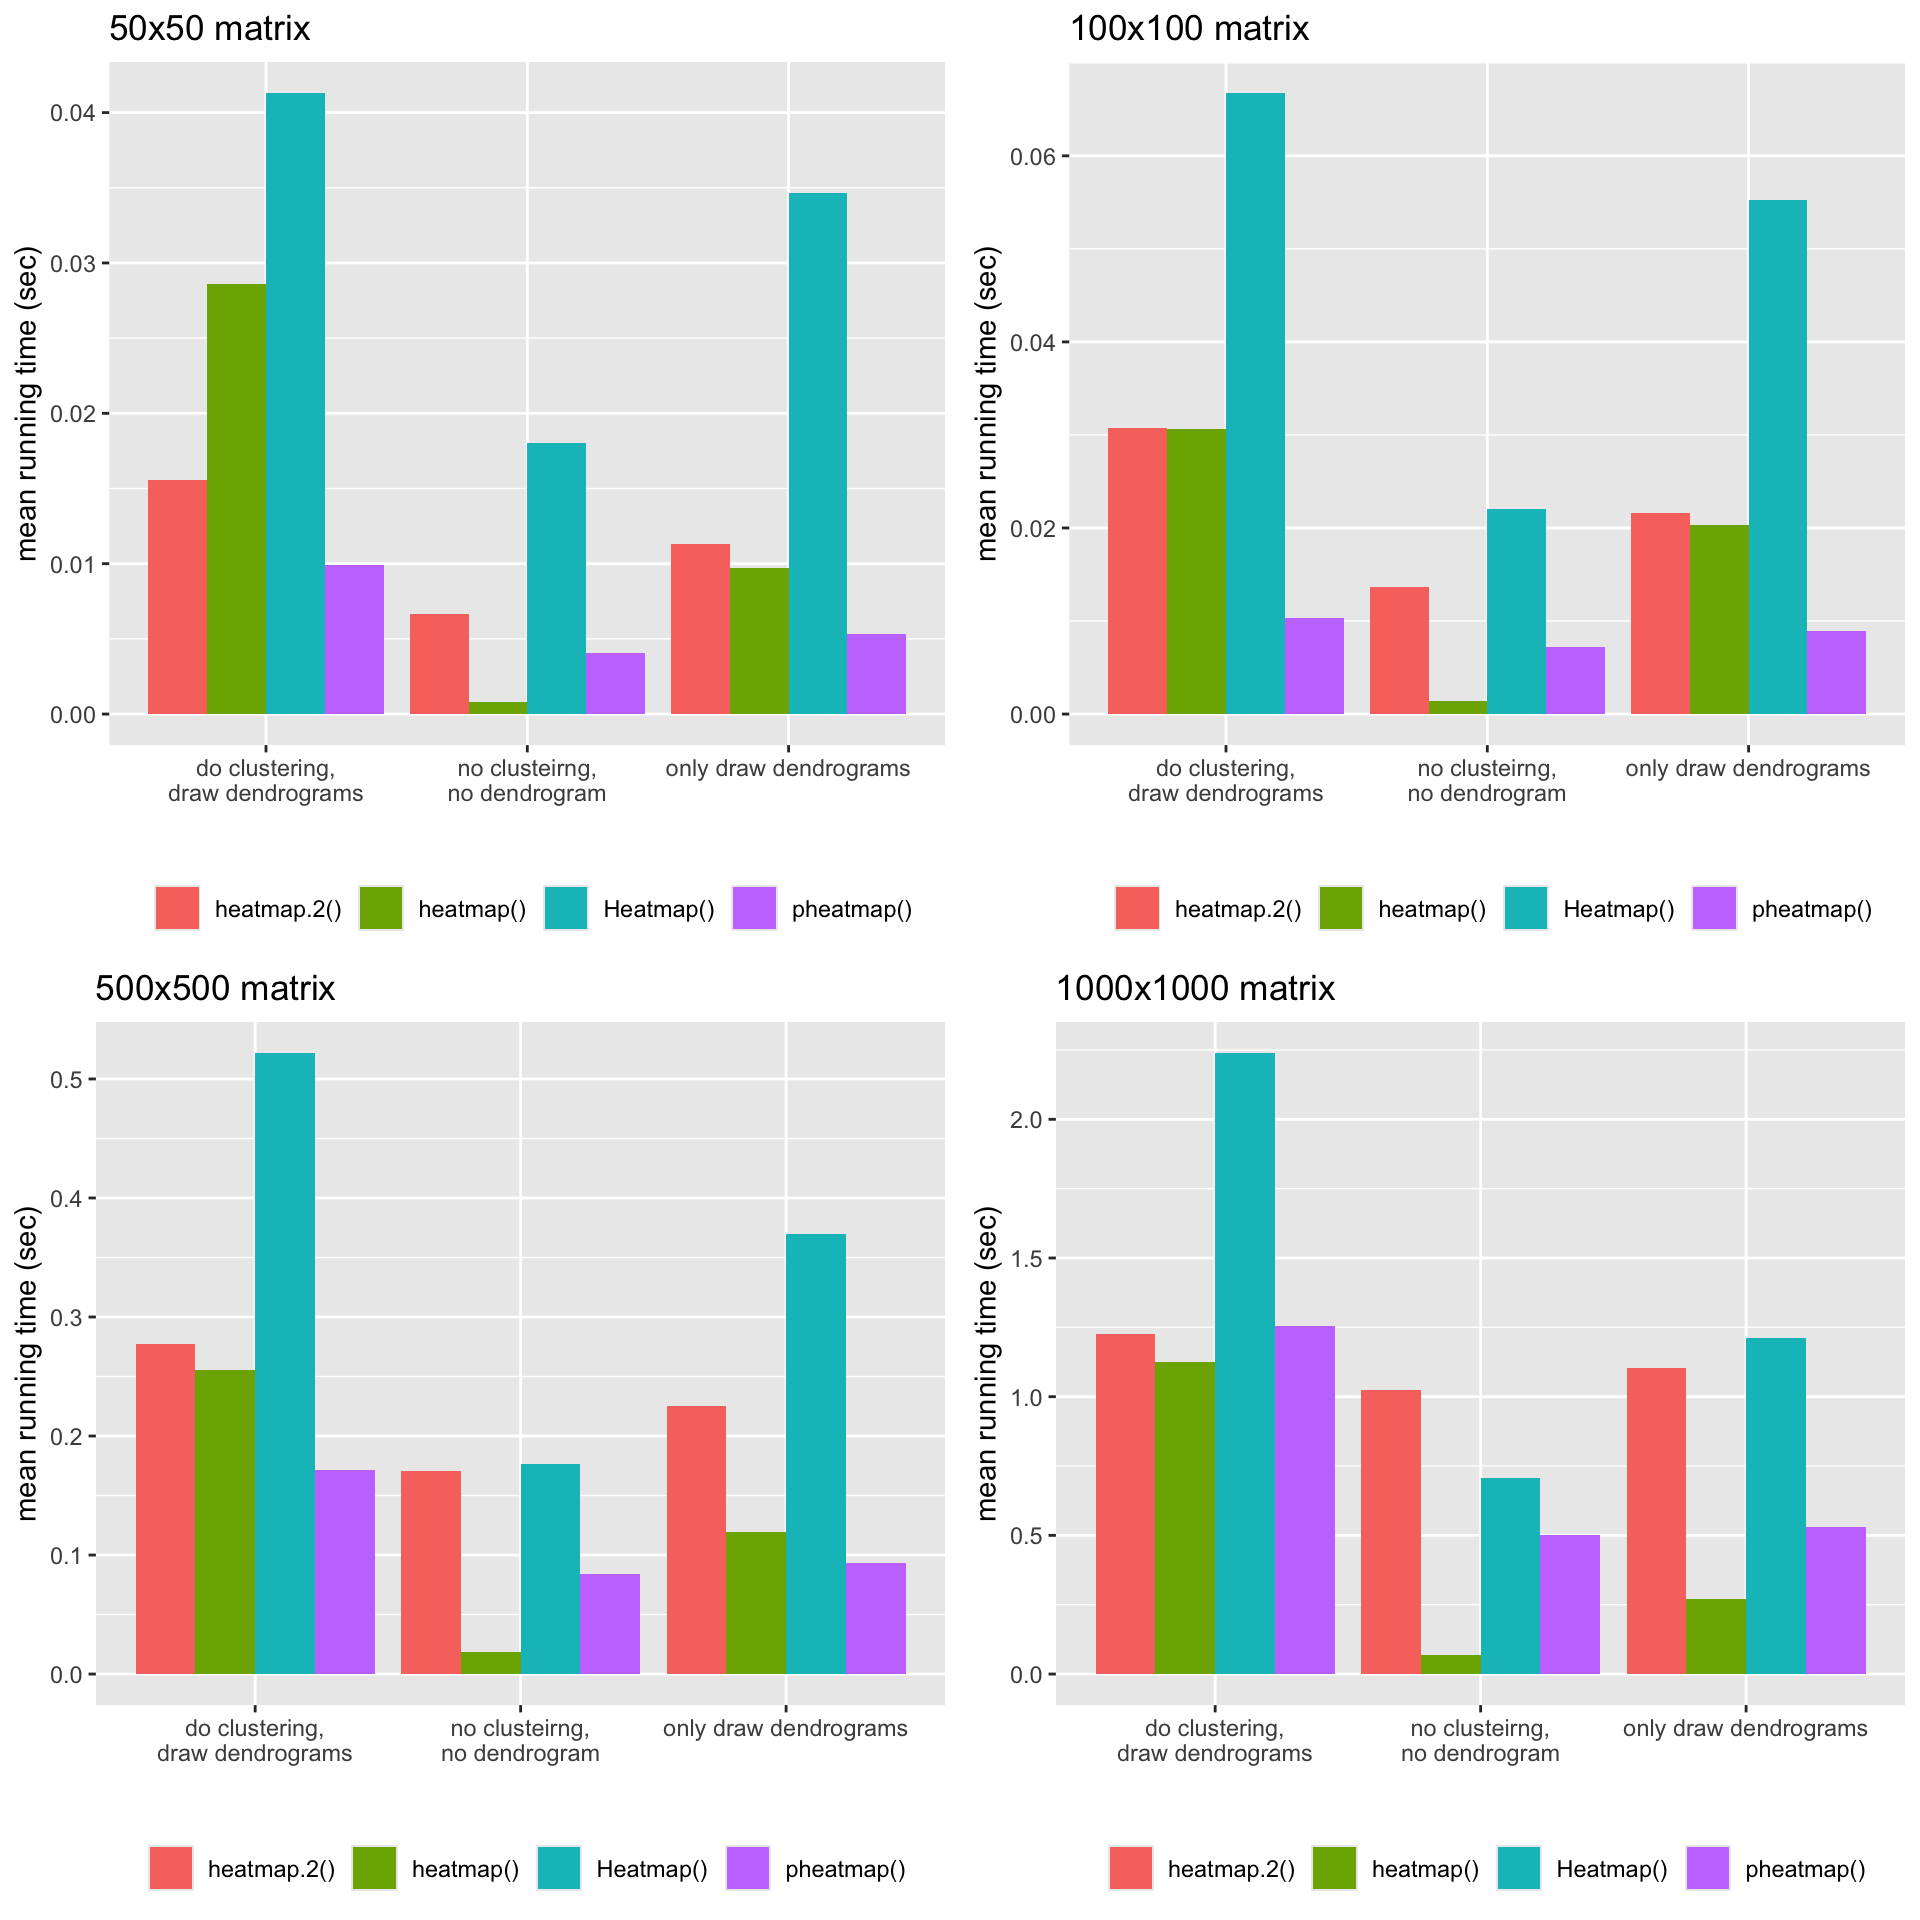
The following plots illustrate the mean running time for the four matrices with different dimensions.
Session info:
sessionInfo()
## R version 4.4.2 (2024-10-31)
## Platform: aarch64-apple-darwin20
## Running under: macOS 26.0.1
##
## Matrix products: default
## BLAS:   /Library/Frameworks/R.framework/Versions/4.4-arm64/Resources/lib/libRblas.0.dylib
## LAPACK: /Library/Frameworks/R.framework/Versions/4.4-arm64/Resources/lib/libRlapack.dylib;  LAPACK version 3.12.0
##
## locale:
## [1] C.UTF-8/UTF-8/C.UTF-8/C/C.UTF-8/C.UTF-8
##
## time zone: Europe/Berlin
## tzcode source: internal
##
## attached base packages:
## [1] grid      stats     graphics  grDevices utils     datasets  methods
## [8] base
##
## other attached packages:
## [1] cowplot_1.1.3         ggplot2_3.5.2         microbenchmark_1.5.0
## [4] gplots_3.2.0          pheatmap_1.0.13       ComplexHeatmap_2.25.2
## [7] GetoptLong_1.0.5      knitr_1.50            colorout_1.3-2
##
## loaded via a namespace (and not attached):
##  [1] gtable_0.3.6        circlize_0.4.16     shape_1.4.6.1
##  [4] rjson_0.2.23        xfun_0.51           bslib_0.9.0
##  [7] GlobalOptions_0.1.2 caTools_1.18.3      Cairo_1.6-2
## [10] vctrs_0.6.5         tools_4.4.2         bitops_1.0-9
## [13] generics_0.1.3      stats4_4.4.2        parallel_4.4.2
## [16] tibble_3.2.1        cluster_2.1.6       pkgconfig_2.0.3
## [19] KernSmooth_2.23-24  RColorBrewer_1.1-3  S4Vectors_0.44.0
## [22] lifecycle_1.0.4     compiler_4.4.2      farver_2.1.2
## [25] munsell_0.5.1       codetools_0.2-20    clue_0.3-66
## [28] htmltools_0.5.8.1   sass_0.4.9          yaml_2.3.10
## [31] pillar_1.10.1       crayon_1.5.3        jquerylib_0.1.4
## [34] cachem_1.1.0        magick_2.8.5        iterators_1.0.14
## [37] foreach_1.5.2       gtools_3.9.5        tidyselect_1.2.1
## [40] digest_0.6.37       dplyr_1.1.4         bookdown_0.44
## [43] labeling_0.4.3      fastmap_1.2.0       colorspace_2.1-1
## [46] cli_3.6.4           magrittr_2.0.3      withr_3.0.2
## [49] scales_1.3.0        rmarkdown_2.29      matrixStats_1.5.0
## [52] blogdown_1.19       png_0.1-8           evaluate_1.0.3
## [55] IRanges_2.40.1      doParallel_1.0.17   rlang_1.1.5
## [58] Rcpp_1.0.14         glue_1.8.0          BiocGenerics_0.52.0
## [61] jsonlite_1.9.0      R6_2.6.1