In my previous blog
post, I
demonstrated how to make a genome-scale heatmap with multiple other tracks.
The key thing there is to split the genome into bins and to normalize various
genomic signals to average them into every bin of the genome. From
ComplexHeatmap version 2.7.1.1003, I added some helper functions which
simplify the binning of the genome and the overlapping between genomic bins
and genomic signals with two new functions bin_genome() and
normalize_genomic_signals_to_bins(). Here I will introduce the usage of
these two functions.
The usage of bin_genome() is very straightforward. You just select the
genome and bin size, and optional, a subset of chromosomes.
library(ComplexHeatmap)
chr_window = bin_genome("hg19")
chr_window
## GRanges object with 1990 ranges and 0 metadata columns:
##          seqnames            ranges strand
##             <Rle>         <IRanges>  <Rle>
##      [1]     chr1         1-1547839      *
##      [2]     chr1   1547840-3095678      *
##      [3]     chr1   3095679-4643517      *
##      [4]     chr1   4643518-6191356      *
##      [5]     chr1   6191357-7739195      *
##      ...      ...               ...    ...
##   [1986]     chrY 51078688-52626526      *
##   [1987]     chrY 52626527-54174365      *
##   [1988]     chrY 54174366-55722204      *
##   [1989]     chrY 55722205-57270043      *
##   [1990]     chrY 57270044-58817882      *
##   -------
##   seqinfo: 24 sequences from an unspecified genome; no seqlengths
The returned value chr_window is a GRanges object which contains the
genomic bins.
There are several parameters you can set in bin_genome().
species: Abbreviation of the genome, e.g., “hg19” or “mm10”.bins: Number of bins to split the genome. The final number will be approximately equal to this number.binsis for calculating a properbin_sizevalue.bin_size: The bin size. If it is set,binsis ignored....: All the other arguments are passed tocirclize::read.chromInfo(), e.g. you can set the genome by a data frame if it is not available on UCSC database, or you can set a subset of chromosomes bychromosome.indexargument.
The second function normalize_genomic_signals_to_bins(), as the name tells, is
for normalizing the genomic signals to the genomic bins. The usage is:
x = normalize_genomic_signals_to_bins(gr, value, value_column, method, empty_value)
The arguments are:
gr: AGRangesobject.value: The corresponding signals corresponding togr.value_column: Ifvalueis not set and the values are in the meta-columns ingr, you can specify the column indices for these value columns, better to use name indices.method: One of “weighted”, “w0” and “absolute”. For the three different methods, please refer to https://bioconductor.org/packages/release/bioc/vignettes/EnrichedHeatmap/inst/doc/EnrichedHeatmap.html#toc_7 or my previous blog postempty_valueThe value for the bins where no signal is overlapped.
It supports following values:
- When neither
valuenorvalue_columnis set, it simply overlapsgrto the genomic bins and returns a one-column logical matrix which represents whether the current genomic bin overlaps to any signal. - When the signals are numeric,
valuecan be a numeric vector or a matrix, orvalue_columncan contain multiple columns. The function returns a numeric matrix where the values are properly averaged depending on whatmethodwas used. - When the signals are character,
valuecan only be a vector orvalue_columncan only contain one single column. The function returns a one-column character matrix.
You don’t need to provide the the genomic bins for
normalize_genomic_signals_to_bins() because when bin_genome() is executed,
the genomic bins are saved internally, so every use of
normalize_genomic_signals_to_bins() can directly use the saved genomic bins
and it ensures multiple use of normalize_genomic_signals_to_bins() always
generate the matrices with the same rows.
That is basically everything, normalize_genomic_signals_to_bins() generates
a matrix and you can use it directly with function Heatmap() or other heatmap-related
fucntions.
The following is the example I generated in my previous blog post, but here I
rewrite it with the use of bin_genome() and normalize_genomic_signals_to_bins().
library(ComplexHeatmap)
library(circlize)
library(GenomicRanges)
chr_window = bin_genome("hg19")
#### the first is a numeric matrix #######
bed1 = generateRandomBed(nr = 1000, nc = 10)
gr1 = GRanges(seqnames = bed1[, 1], ranges = IRanges(bed1[, 2], bed1[, 3]))
num_mat = normalize_genomic_signals_to_bins(gr1, bed1[, -(1:3)])
#### the second is a character matrix ######
bed_list = lapply(1:10, function(i) {
generateRandomBed(nr = 1000, nc = 1,
fun = function(n) sample(c("gain", "loss"), n, replace = TRUE))
})
char_mat = NULL
for(i in 1:10) {
bed = bed_list[[i]]
bed = bed[sample(nrow(bed), 20), , drop = FALSE]
gr_cnv = GRanges(seqnames = bed[, 1], ranges = IRanges(bed[, 2], bed[, 3]))
char_mat = cbind(char_mat, normalize_genomic_signals_to_bins(gr_cnv, bed[, 4]))
}
#### two numeric columns ##########
bed2 = generateRandomBed(nr = 100, nc = 2)
gr2 = GRanges(seqnames = bed2[, 1], ranges = IRanges(bed2[, 2], bed2[, 3]))
v = normalize_genomic_signals_to_bins(gr2, bed2[, 4:5])
##### a list of genes need to be marked
bed3 = generateRandomBed(nr = 40, nc = 0)
gr3 = GRanges(seqnames = bed3[, 1], ranges = IRanges(bed3[, 2], bed3[, 2]))
gr3$gene = paste0("gene_", 1:length(gr3))
mtch = as.matrix(findOverlaps(chr_window, gr3))
at = mtch[, 1]
labels = mcols(gr3)[mtch[, 2], 1]
##### order of the chromosomes ########
chr = as.vector(seqnames(chr_window))
chr_level = paste0("chr", c(1:22, "X", "Y"))
chr = factor(chr, levels = chr_level)
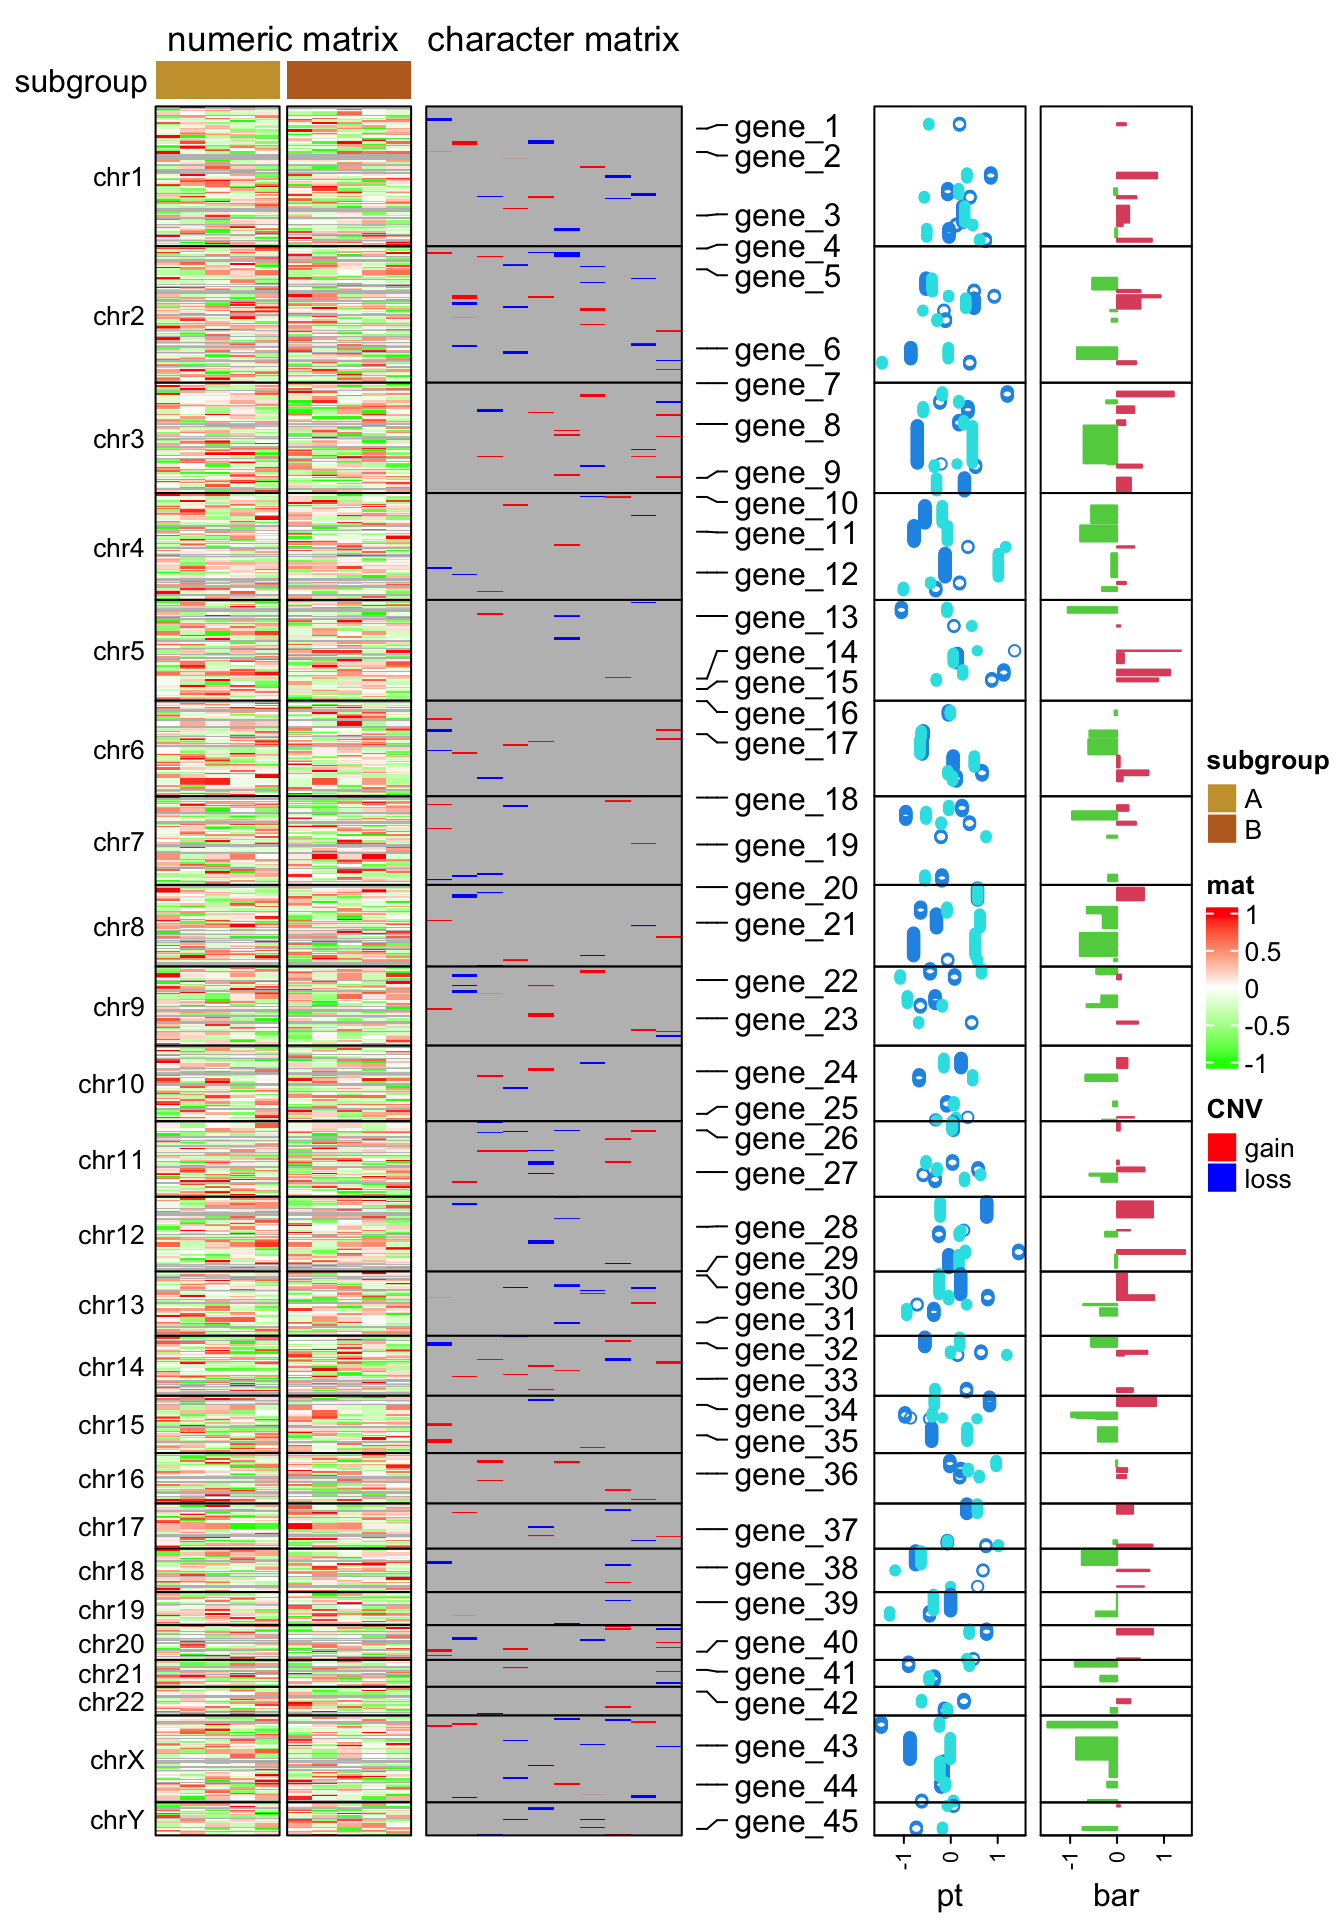
#### make the heatmap #######
subgroup = rep(c("A", "B"), each = 5)
ht_opt$TITLE_PADDING = unit(c(4, 4), "points")
ht_list = Heatmap(num_mat, name = "mat", col = colorRamp2(c(-1, 0, 1), c("green", "white", "red")),
row_split = chr, cluster_rows = FALSE, show_column_dend = FALSE,
column_split = subgroup, cluster_column_slices = FALSE,
column_title = "numeric matrix",
top_annotation = HeatmapAnnotation(subgroup = subgroup, annotation_name_side = "left"),
row_title_rot = 0, row_title_gp = gpar(fontsize = 10), border = TRUE,
row_gap = unit(0, "points")) +
Heatmap(char_mat, name = "CNV", col = c("gain" = "red", "loss" = "blue"),
border = TRUE, column_title = "character matrix") +
rowAnnotation(label = anno_mark(at = at, labels = labels)) +
rowAnnotation(pt = anno_points(v, gp = gpar(col = 4:5), pch = c(1, 16)),
width = unit(2, "cm")) +
rowAnnotation(bar = anno_barplot(v[, 1], gp = gpar(col = ifelse(v[ ,1] > 0, 2, 3))),
width = unit(2, "cm"))
draw(ht_list, merge_legend = TRUE)
Session Info:
sessionInfo()
## R version 4.4.2 (2024-10-31)
## Platform: aarch64-apple-darwin20
## Running under: macOS 26.0.1
##
## Matrix products: default
## BLAS:   /Library/Frameworks/R.framework/Versions/4.4-arm64/Resources/lib/libRblas.0.dylib
## LAPACK: /Library/Frameworks/R.framework/Versions/4.4-arm64/Resources/lib/libRlapack.dylib;  LAPACK version 3.12.0
##
## locale:
## [1] C.UTF-8/UTF-8/C.UTF-8/C/C.UTF-8/C.UTF-8
##
## time zone: Europe/Berlin
## tzcode source: internal
##
## attached base packages:
## [1] stats4    grid      stats     graphics  grDevices utils     datasets
## [8] methods   base
##
## other attached packages:
##  [1] GenomicRanges_1.58.0  GenomeInfoDb_1.42.3   IRanges_2.40.1
##  [4] S4Vectors_0.44.0      BiocGenerics_0.52.0   circlize_0.4.16
##  [7] ComplexHeatmap_2.25.2 GetoptLong_1.0.5      knitr_1.50
## [10] colorout_1.3-2
##
## loaded via a namespace (and not attached):
##  [1] sass_0.4.9              shape_1.4.6.1           lattice_0.22-6
##  [4] blogdown_1.19           magrittr_2.0.3          digest_0.6.37
##  [7] evaluate_1.0.3          RColorBrewer_1.1-3      EnrichedHeatmap_1.36.0
## [10] bookdown_0.44           iterators_1.0.14        fastmap_1.2.0
## [13] foreach_1.5.2           doParallel_1.0.17       jsonlite_1.9.0
## [16] GlobalOptions_0.1.2     httr_1.4.7              UCSC.utils_1.2.0
## [19] codetools_0.2-20        jquerylib_0.1.4         cli_3.6.4
## [22] rlang_1.1.5             crayon_1.5.3            XVector_0.46.0
## [25] cachem_1.1.0            yaml_2.3.10             tools_4.4.2
## [28] parallel_4.4.2          colorspace_2.1-1        locfit_1.5-9.12
## [31] GenomeInfoDbData_1.2.13 R6_2.6.1                png_0.1-8
## [34] magick_2.8.5            matrixStats_1.5.0       lifecycle_1.0.4
## [37] zlibbioc_1.52.0         clue_0.3-66             cluster_2.1.6
## [40] bslib_0.9.0             Rcpp_1.0.14             xfun_0.51
## [43] rjson_0.2.23            htmltools_0.5.8.1       rmarkdown_2.29
## [46] Cairo_1.6-2             compiler_4.4.2