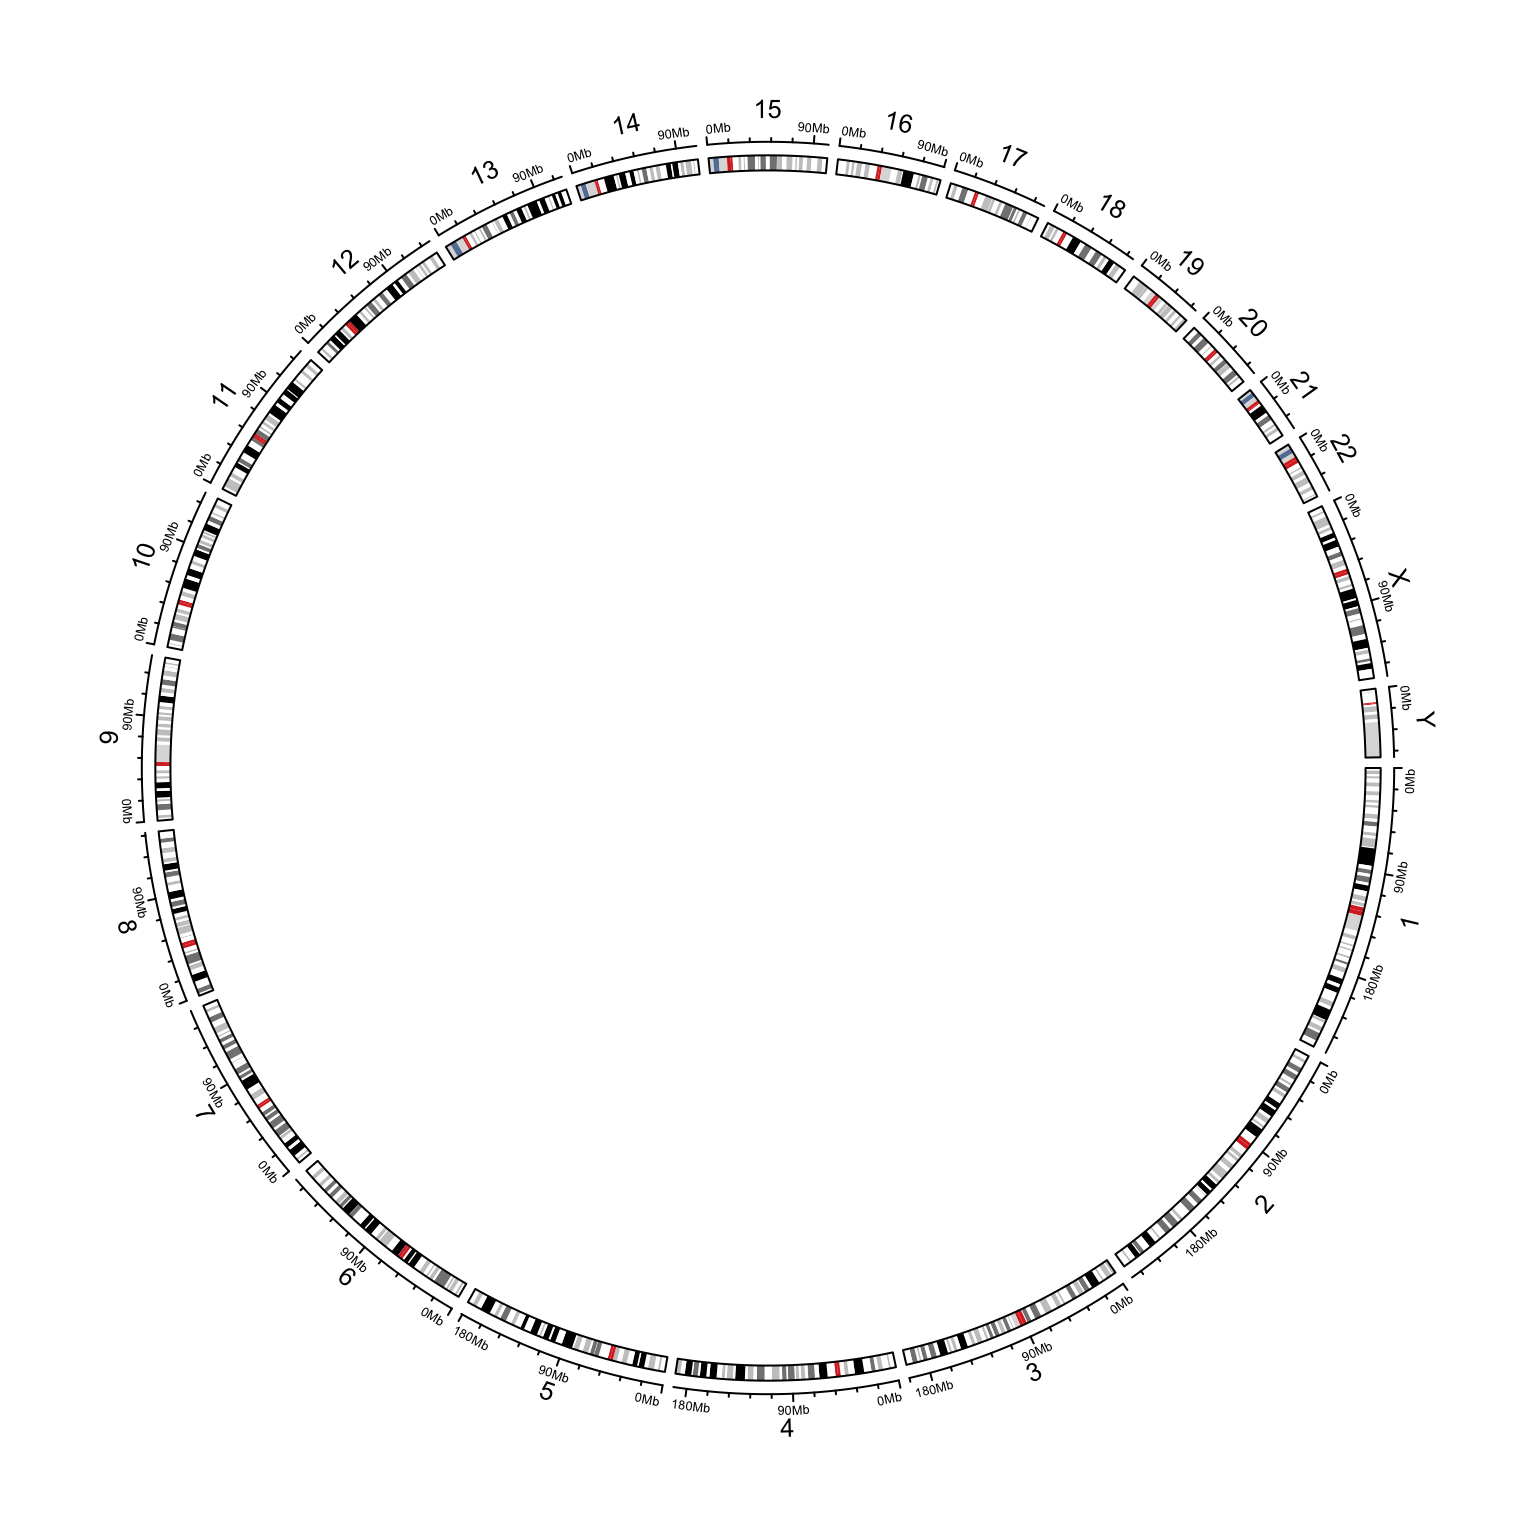
circlize applies circular visualization. Essentially, it visualizes data in categories. E.g. for genomic data, the circle is segmented and each segment (or called sector) corresponds to one single chromosome. The following code visualizes 24 chromosomes of human genome.
library(circlize)
circos.initializeWithIdeogram()
Now the question is how to visualize a “real” circular genome where the complete circle corresponds to the genome and the “end” of the genome goes smoothly over the “start” of the genome.
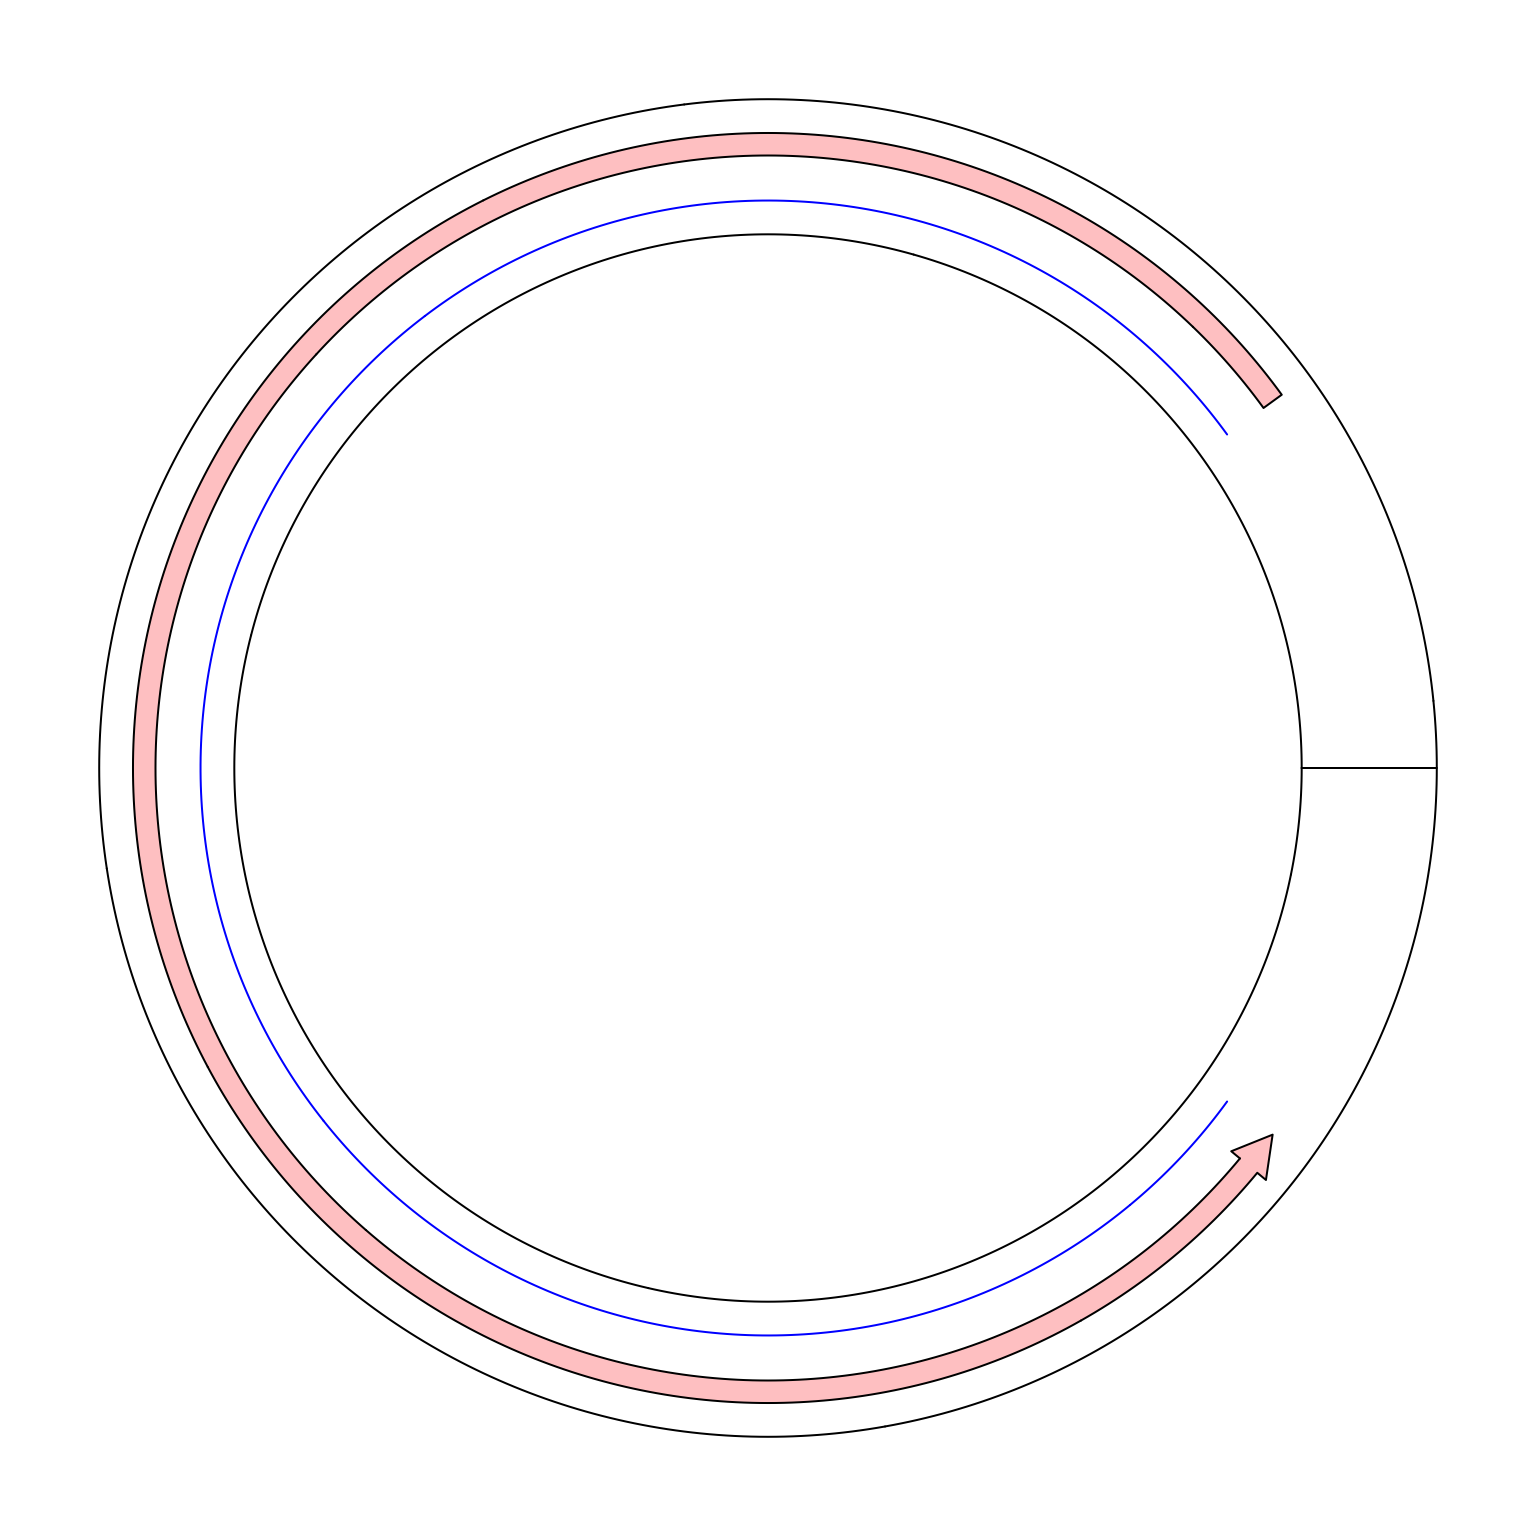
Maybe we can create a single sector and set gap.degree to 0. In the following, I tried to draw a line from x = 9 to x = 1. In
the circular genome, we expect the line goes through x = 0.
circos.par(gap.degree = 0, cell.padding = c(0.02, 0, 0.02, 0))
circos.initialize("foo", xlim = c(0, 10))
circos.track(ylim = c(0, 1))
circos.lines(c(9, 1), c(0.2, 0.2), col = "blue")
circos.arrow(9, 1, y = 0.7, width = 0.2)
circos.clear()
Unfortunately it is not what we expected. If a line is drawn from x = 9 to x = 1 in the normal mode, it only goes reverse close wisely
on the circle. And there is also a radical line in the ring which is actually the border of x = 0 and x = 10. Thus in the coordination
system, x = 1 and x = 9 are still far from each other.
To support the “real” visualization on circular genomes, in circlize, now I add a new mode called “the ring mode”.
Simply add ring = TRUE in circos.initialize().
circos.initialize("foo", xlim = c(0, 10), ring = TRUE)
circos.track(ylim = c(0, 1))
circos.lines(c(9, 1), c(0.2, 0.2), col = "blue")
circos.arrow(9, 1, y = 0.7, width = 0.2)
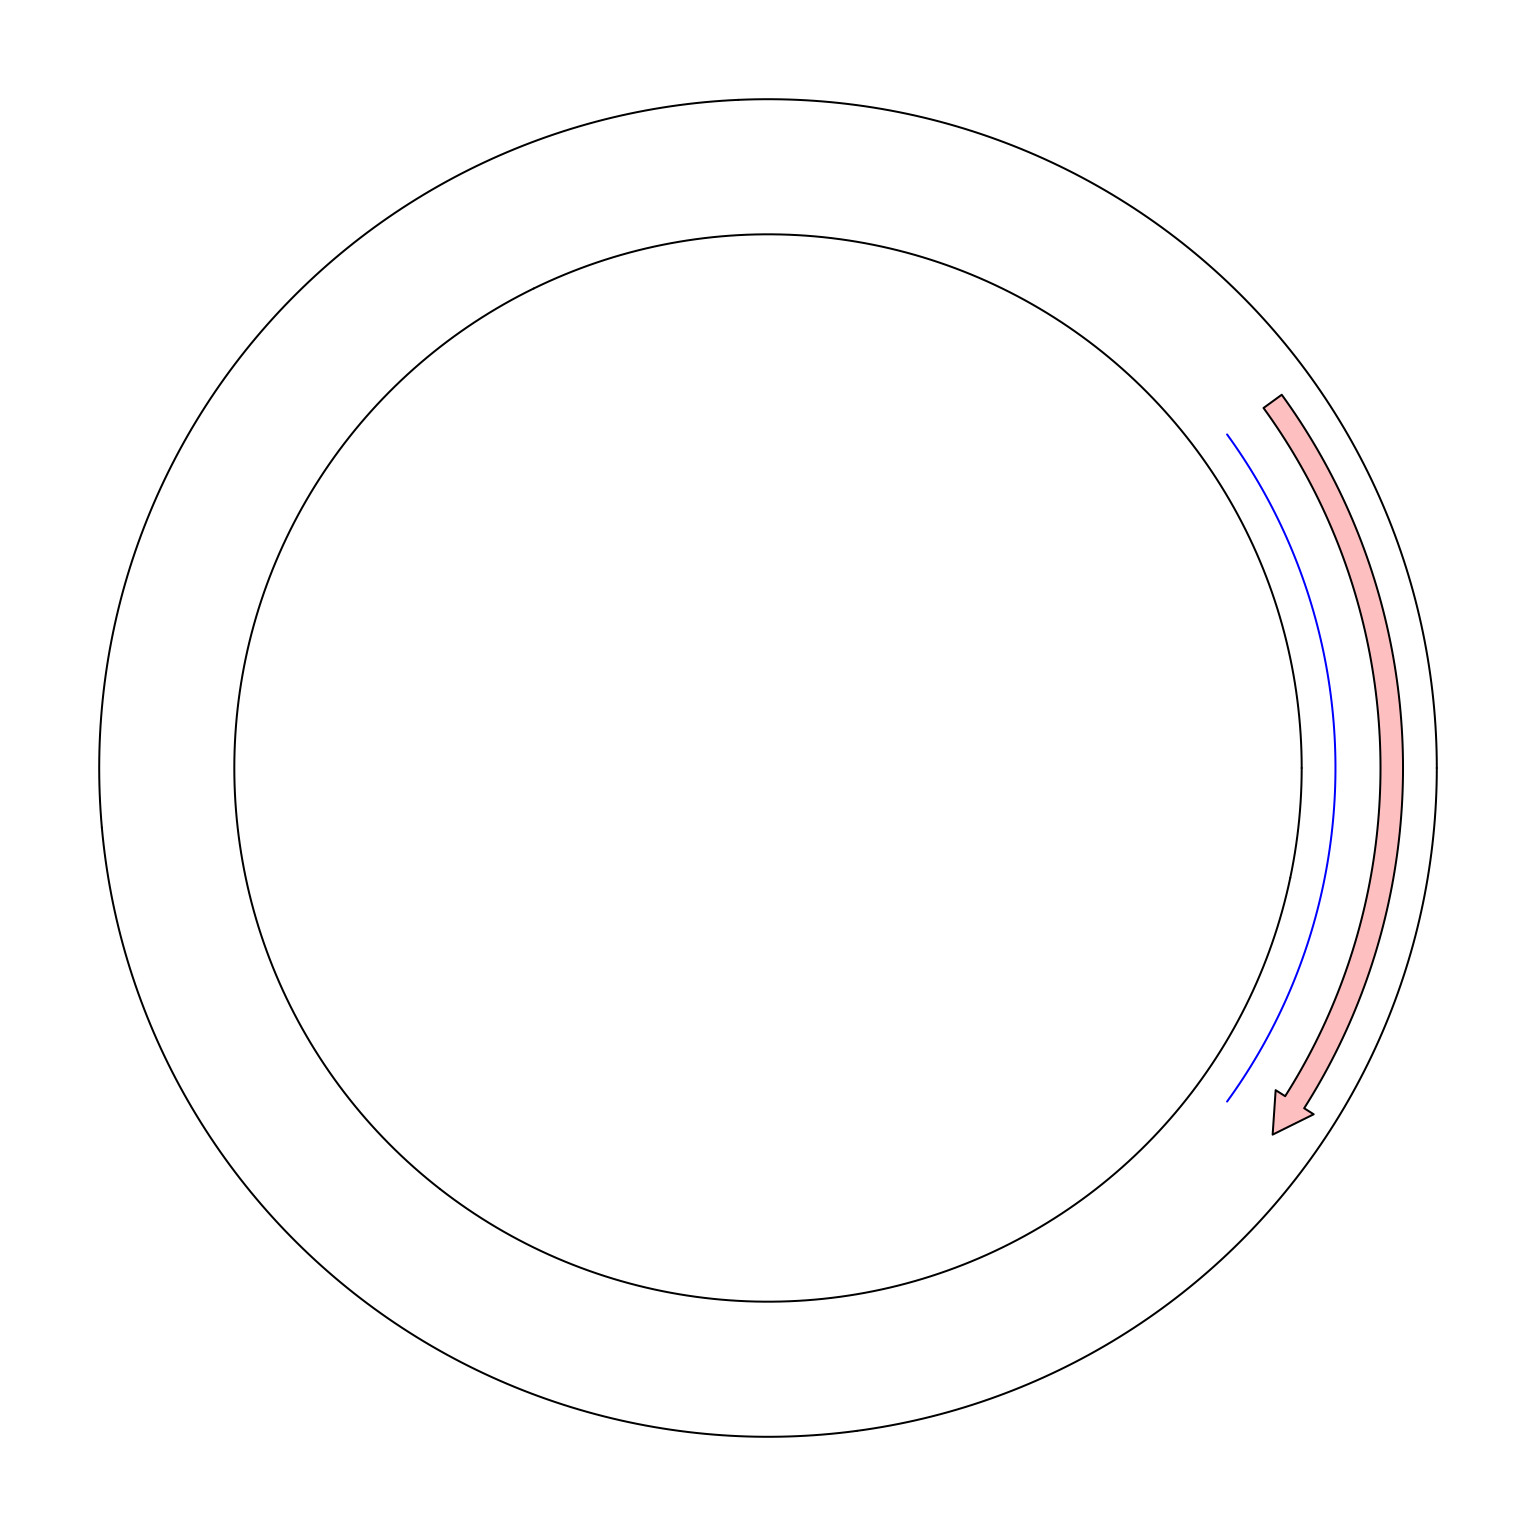
circos.clear()
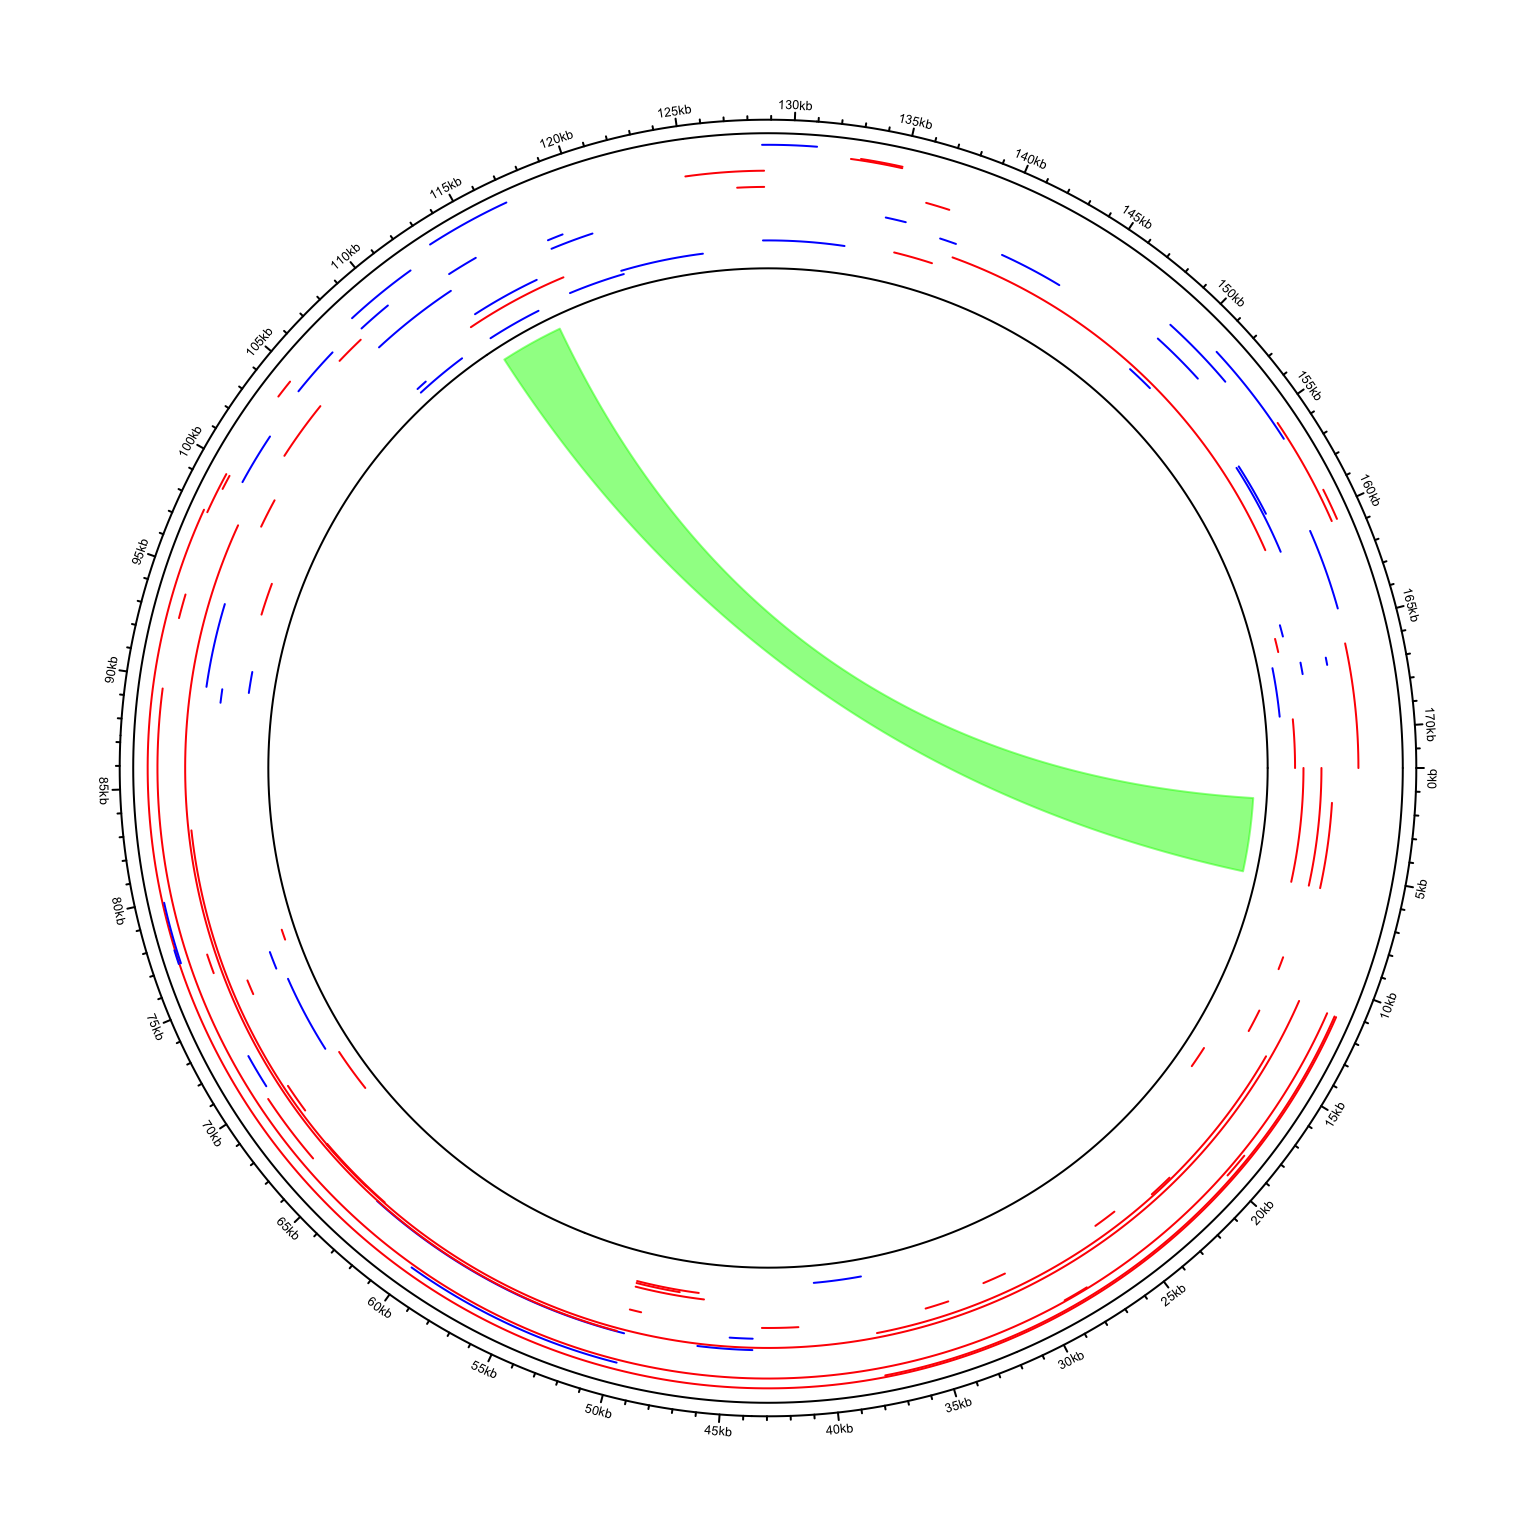
In the next example, I visualize genome of the Human gammaherpesvirus 4. The genomic coordinates of genes are from https://www.ncbi.nlm.nih.gov/datasets/genome/GCF_002402265.1/. As you can see here, start position in the first row in larger than the end position.
download.file("https://ftp.ncbi.nlm.nih.gov/genomes/all/GCF/002/402/265/GCF_002402265.1_ASM240226v1/GCF_002402265.1_ASM240226v1_genomic.gtf.gz", dest = "GCF_002402265.1_ASM240226v1_genomic.gtf.gz")
df = read.csv("GCF_002402265.1_ASM240226v1_genomic.gtf.gz", skip = 3, header = FALSE, sep = "\t")
head(df)
##            V1     V2          V3   V4   V5 V6 V7 V8
## 1 NC_007605.1 RefSeq        gene 1691 5856  .  +  .
## 2 NC_007605.1 RefSeq         CDS 1736 5689  .  +  0
## 3 NC_007605.1 RefSeq start_codon 1736 1738  .  +  0
## 4 NC_007605.1 RefSeq  stop_codon 5690 5692  .  +  0
## 5 NC_007605.1 RefSeq  transcript 6629 6795  .  +  .
## 6 NC_007605.1 RefSeq        exon 6629 6795  .  +  .
##                                                                                                                                                                                                               V9
## 1                                        gene_id HHV4_BNRF1; transcript_id ; db_xref GeneID:3783722; gbkey Gene; gene BNRF1; gene_biotype protein_coding; locus_tag HHV4_BNRF1; note gamma gene; FGARAT family;
## 2 gene_id HHV4_BNRF1; transcript_id unassigned_transcript_1; db_xref UniProtKB/TrEMBL:Q777H3; gbkey CDS; gene BNRF1; locus_tag HHV4_BNRF1; product tegument protein G75; protein_id YP_401633.1; exon_number 1;
## 3 gene_id HHV4_BNRF1; transcript_id unassigned_transcript_1; db_xref UniProtKB/TrEMBL:Q777H3; gbkey CDS; gene BNRF1; locus_tag HHV4_BNRF1; product tegument protein G75; protein_id YP_401633.1; exon_number 1;
## 4 gene_id HHV4_BNRF1; transcript_id unassigned_transcript_1; db_xref UniProtKB/TrEMBL:Q777H3; gbkey CDS; gene BNRF1; locus_tag HHV4_BNRF1; product tegument protein G75; protein_id YP_401633.1; exon_number 1;
## 5                                                         gene_id unassigned_gene_1; transcript_id unassigned_transcript_2; gbkey misc_RNA; product EBER-1 (pol III transcript); transcript_biotype transcript;
## 6                                                          gene_id unassigned_gene_1; transcript_id unassigned_transcript_2; product EBER-1 (pol III transcript); transcript_biotype transcript; exon_number 1;
df = df[df[, 3] == "gene", c(1, 4, 5, 7)]
file.remove("GCF_002402265.1_ASM240226v1_genomic.gtf.gz")
## [1] TRUE
I wrote a helper function circos.initializeCircularGenome() especially for circular genomes.
In other parts of the code, just use circlize in the normal way.
circos.initializeCircularGenome("NC_007605.1", genome_size = 171823)
circos.genomicTrack(df, ylim = c(0, 1), panel.fun = function(region, value, ...) {
    circos.genomicLines(region, value = runif(nrow(region)), type = "segment",
        col = ifelse(value[, 1] == "+", "Red", "blue"))
})
circos.genomicLink(df[1, ], df[60, ], col = "#00FF0080")