For most annotation functions implemented in ComplexHeatmap, they only draw one same type of annotation graphics, e.g. anno_points()
only draws points. From ComplexHeatmap version 2.9.4, I added a new annotation function anno_customize(), with which you can completely
freely define graphics for every annotation cell.
The input for anno_customize() should be a categorical vector.
library(ComplexHeatmap)
x = c("a", "a", "a", "b", "b", "b", "c", "c", "d", "d")
For each level, you need to define a graphics function for it.
graphics = list(
    "a" = function(x, y, w, h) grid.rect(x, y, w*0.8, h*0.33, gp = gpar(fill = "red")),
    "b" = function(x, y, w, h) grid.text("A", x, y, gp = gpar(col = "darkgreen")),
    "c" = function(x, y, w, h) grid.points(x, y, gp = gpar(col = "orange"), pch = 16),
    "d" = function(x, y, w, h) {
        img = png::readPNG(system.file("extdata", "Rlogo.png", package = "circlize"))
        grid.raster(img, x, y, width = unit(0.8, "snpc"), height = unit(0.8, "snpc")*nrow(img)/ncol(img))
    }
)
When adding graphics, each annotation cell is an independent viewport, thus, the self-defined graphics function accepts four arguments: x and y: the center
of the viewport of the annotation cell, w and h: the width and height of the viewport. In the example above, we set a horizontal bar for "a", a text for "b",
a point for "c" and an image for "d".
Then we add this new annotation to both row and column of the heatmap, just in the same way as normal annotations.
m = matrix(rnorm(100), 10)
Heatmap(m,
    top_annotation = HeatmapAnnotation(foo = anno_customize(x, graphics = graphics)),
    right_annotation = rowAnnotation(bar = anno_customize(x, graphics = graphics)))
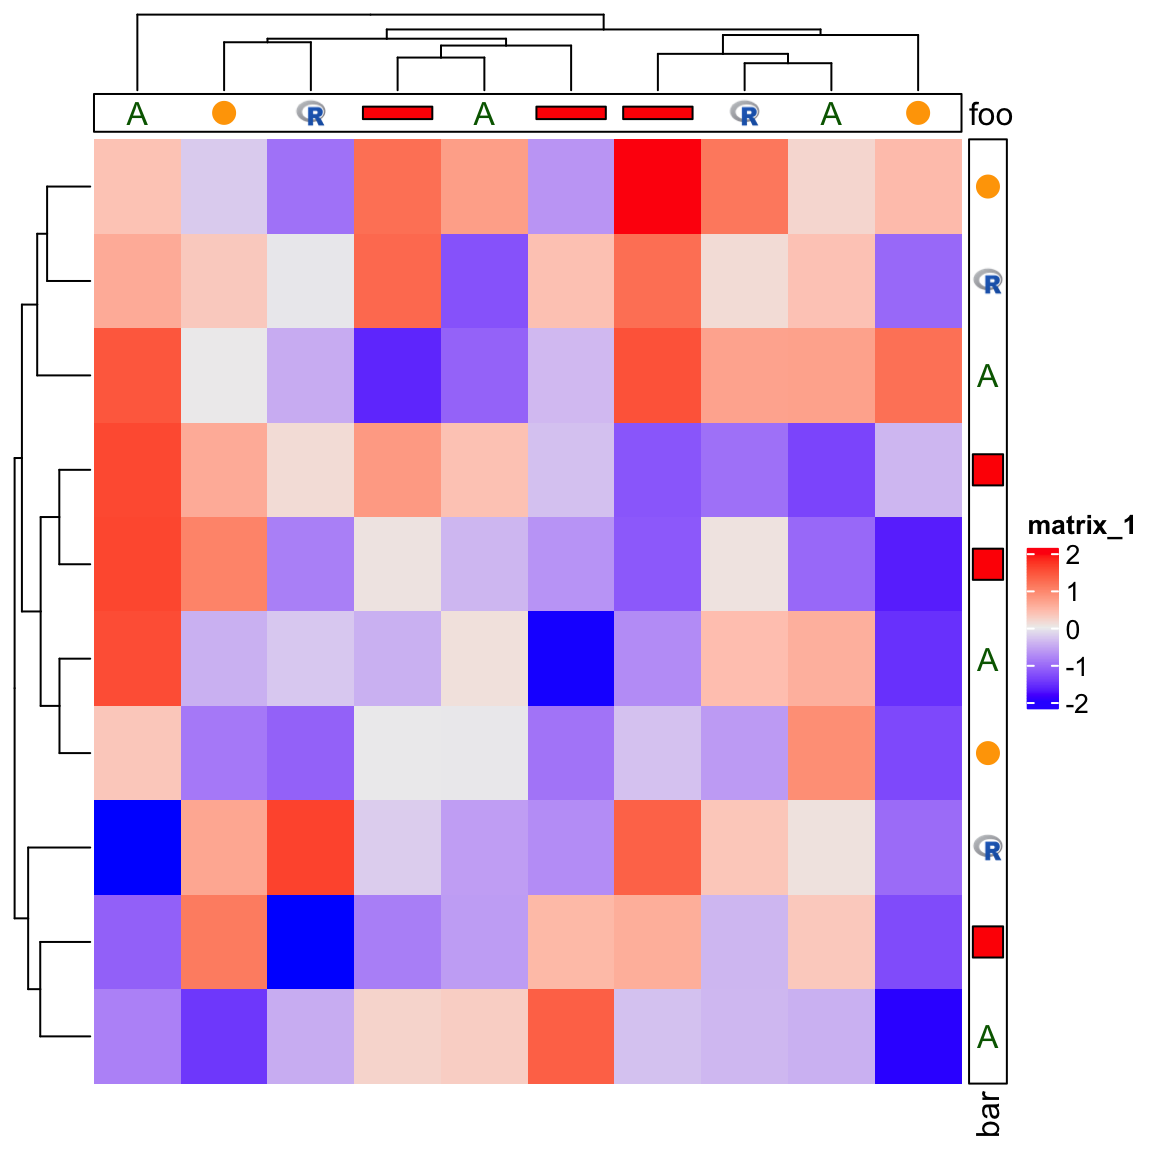
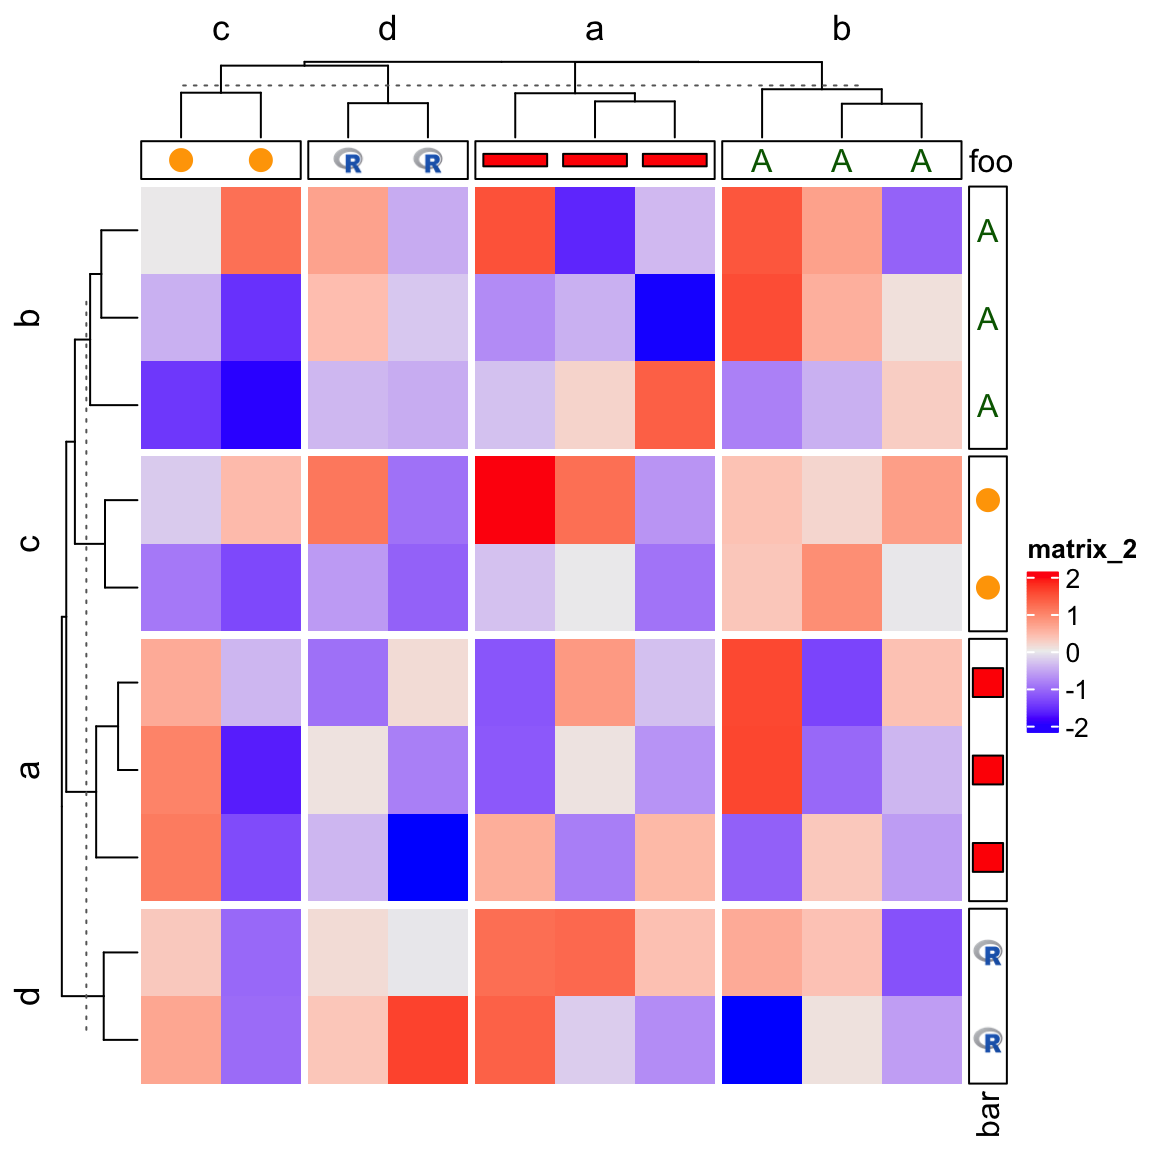
Reordering and splitting are automatically adjusted.
Heatmap(m,
    top_annotation = HeatmapAnnotation(foo = anno_customize(x, graphics = graphics)),
    right_annotation = rowAnnotation(bar = anno_customize(x, graphics = graphics)),
    column_split = x, row_split = x)
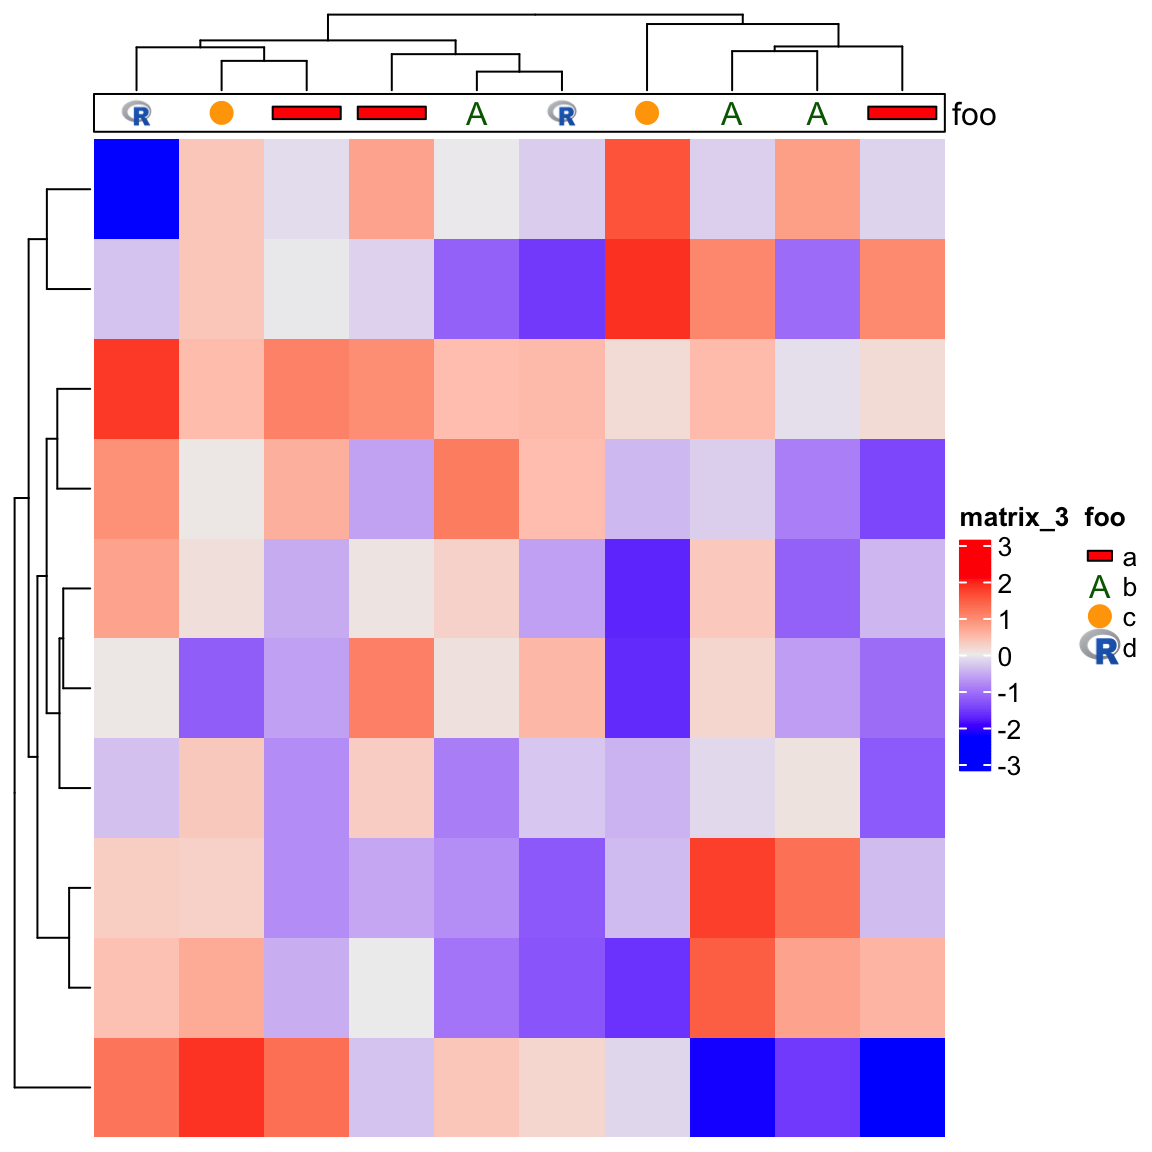
Legend() function also accepts a graphics argument, so it is easy to add legends for the “customized annotations”.
m = matrix(rnorm(100), 10)
ht = Heatmap(m,
    top_annotation = HeatmapAnnotation(foo = anno_customize(x, graphics = graphics)))
lgd = Legend(title = "foo", at = names(graphics), graphics = graphics)
draw(ht, annotation_legend_list = lgd)
Session info
sessionInfo()
## R version 4.3.3 (2024-02-29)
## Platform: x86_64-apple-darwin20 (64-bit)
## Running under: macOS 26.3.1
##
## Matrix products: default
## BLAS:   /Library/Frameworks/R.framework/Versions/4.3-x86_64/Resources/lib/libRblas.0.dylib
## LAPACK: /Library/Frameworks/R.framework/Versions/4.3-x86_64/Resources/lib/libRlapack.dylib;  LAPACK version 3.11.0
##
## locale:
## [1] zh_CN.UTF-8/zh_CN.UTF-8/zh_CN.UTF-8/C/zh_CN.UTF-8/zh_CN.UTF-8
##
## time zone: Asia/Shanghai
## tzcode source: internal
##
## attached base packages:
## [1] grid      stats     graphics  grDevices utils     datasets  methods
## [8] base
##
## other attached packages:
## [1] ComplexHeatmap_2.23.1 knitr_1.45
##
## loaded via a namespace (and not attached):
##  [1] jsonlite_1.8.8      highr_0.10          compiler_4.3.3
##  [4] rjson_0.2.21        crayon_1.5.2        Rcpp_1.0.12
##  [7] magick_2.8.3        parallel_4.3.3      cluster_2.1.6
## [10] jquerylib_0.1.4     IRanges_2.36.0      png_0.1-8
## [13] yaml_2.3.8          fastmap_1.1.1       R6_2.5.1
## [16] shape_1.4.6.1       Cairo_1.6-2         BiocGenerics_0.48.1
## [19] iterators_1.0.14    GetoptLong_1.0.5    circlize_0.4.16
## [22] bookdown_0.39       bslib_0.7.0         RColorBrewer_1.1-3
## [25] rlang_1.1.3         cachem_1.0.8        xfun_0.43
## [28] sass_0.4.9          GlobalOptions_0.1.2 doParallel_1.0.17
## [31] cli_3.6.2           magrittr_2.0.3      digest_0.6.35
## [34] foreach_1.5.2       clue_0.3-65         lifecycle_1.0.4
## [37] S4Vectors_0.40.2    evaluate_0.23       blogdown_1.19
## [40] codetools_0.2-19    stats4_4.3.3        colorspace_2.1-0
## [43] rmarkdown_2.26      matrixStats_1.3.0   tools_4.3.3
## [46] htmltools_0.5.8.1