Visualize enrichment of genome-level signals over a type of genomic features.
Basic
| 软件包 | 链接 |
|---|---|
| Language | R, C++ |
| Bioconductor | https://bioconductor.org/packages/EnrichedHeatmap/ |
| GitHub | https://github.com/jokergoo/EnrichedHeatmap |
| Documentation | https://jokergoo.github.io/EnrichedHeatmap/ |
| Publication | Zuguang Gu, et al., EnrichedHeatmap: an R/Bioconductor package for comprehensive visualization of genomic signal associations. BMC Genomics 2018. |
Example
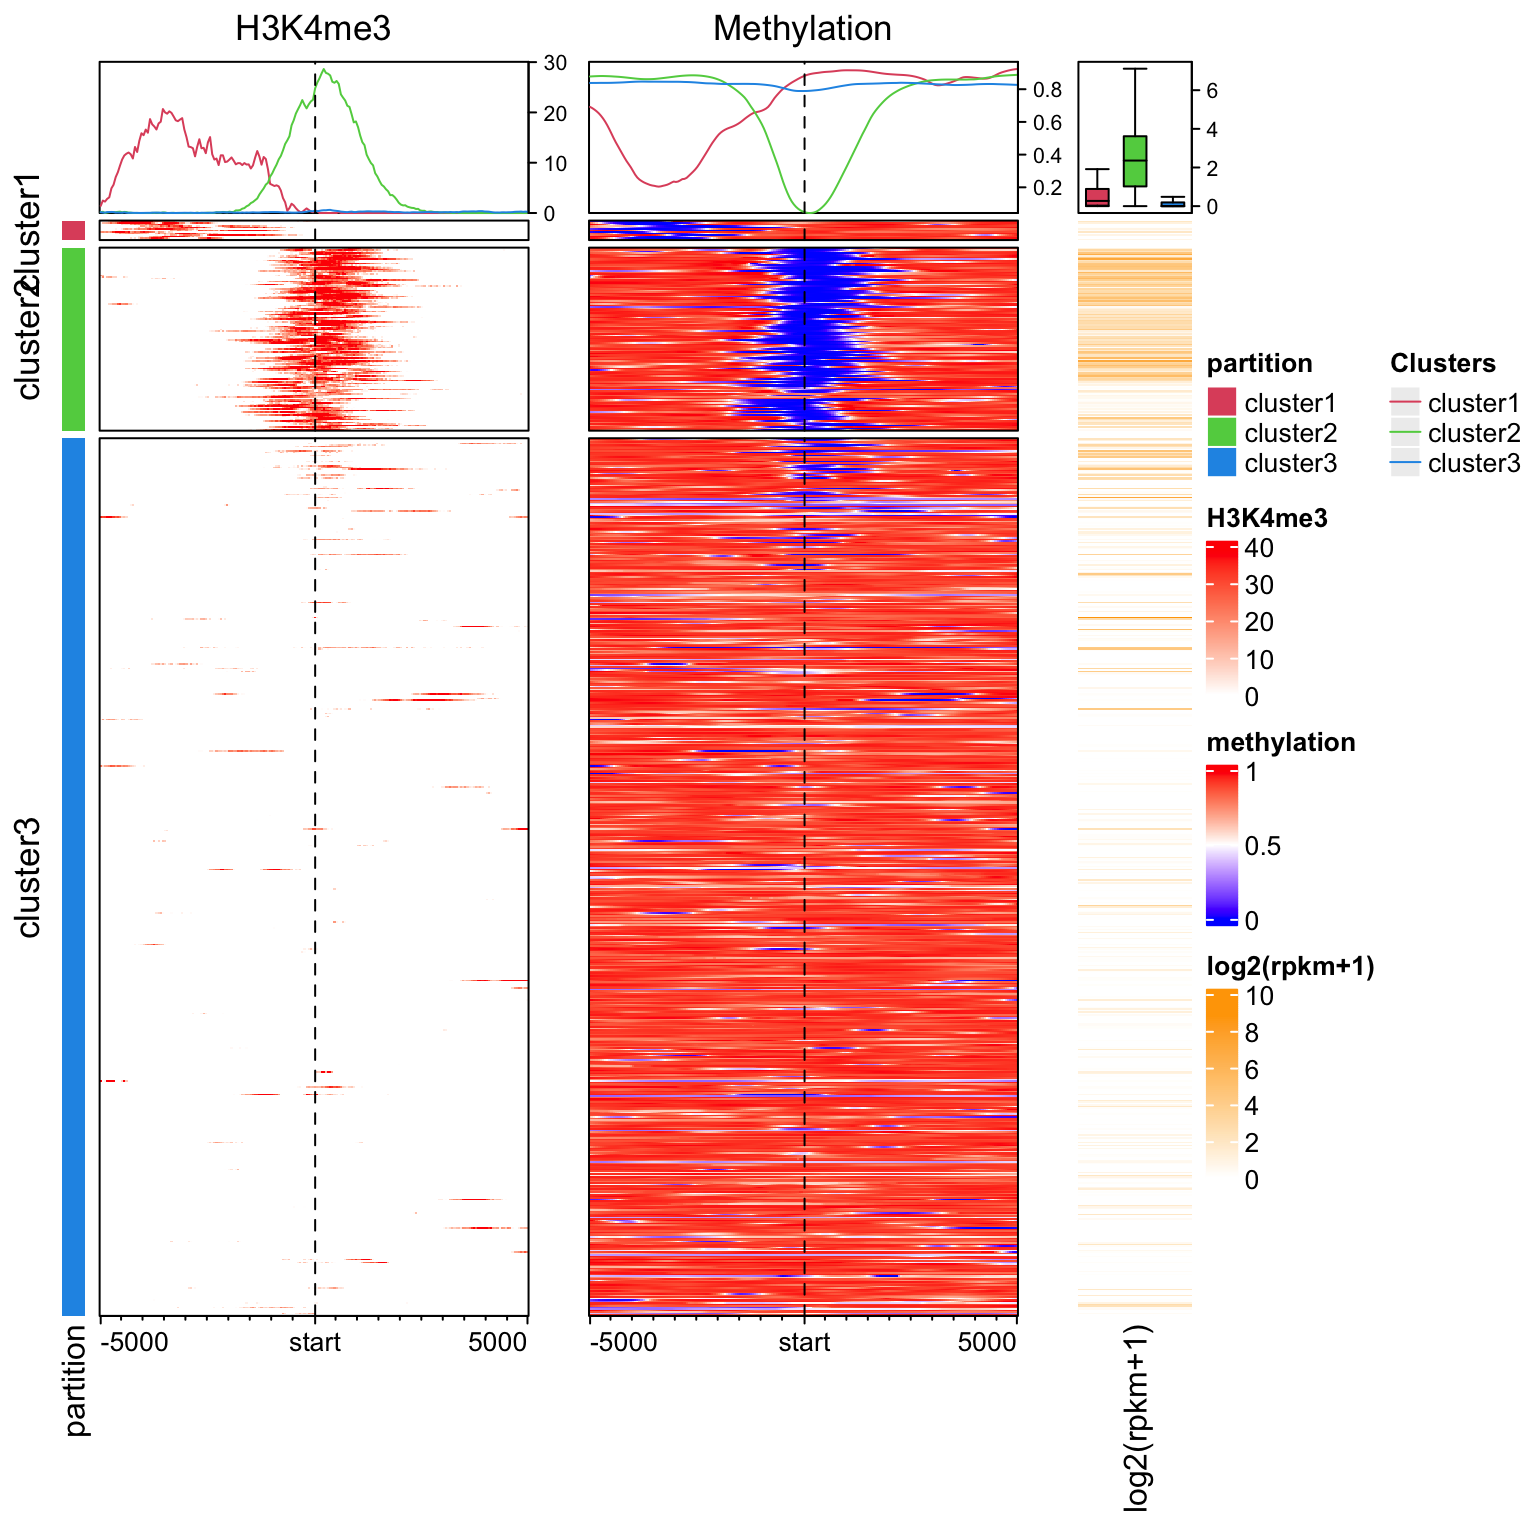
Enrichment of H3K4me3 and DNA methylation around TSS.
library(EnrichedHeatmap)
load(system.file("extdata", "chr21_test_data.RData", package = "EnrichedHeatmap"))
tss = promoters(genes, upstream = 0, downstream = 1)

mat1 = normalizeToMatrix(H3K4me3, tss, value_column = "coverage",
    extend = 5000, mean_mode = "w0", w = 50, keep = c(0, 0.99))

mat2 = normalizeToMatrix(meth, tss, value_column = "meth", mean_mode = "absolute",
    extend = 5000, w = 50, background = NA, smooth = TRUE)

library(circlize)
col_fun = colorRamp2(quantile(mat1, c(0, 0.99)), c("white", "red"))
meth_col_fun = colorRamp2(c(0, 0.5, 1), c("blue", "white", "red"))

partition = paste0("cluster", kmeans(mat1, centers = 3)$cluster)
lgd = Legend(at = c("cluster1", "cluster2", "cluster3"), title = "Clusters",
    type = "lines", legend_gp = gpar(col = 2:4))
ht_list = Heatmap(partition, col = structure(2:4, names = paste0("cluster", 1:3)), name = "partition",
              show_row_names = FALSE, width = unit(3, "mm")) +
          EnrichedHeatmap(mat1, col = col_fun, name = "H3K4me3",
              top_annotation = HeatmapAnnotation(lines = anno_enriched(gp = gpar(col = 2:4))),
              column_title = "H3K4me3") +
          EnrichedHeatmap(mat2, col = meth_col_fun, name = "methylation",
              top_annotation = HeatmapAnnotation(lines = anno_enriched(gp = gpar(col = 2:4))),
              column_title = "Methylation") +
          Heatmap(log2(rpkm+1), col = c("white", "orange"), name = "log2(rpkm+1)",
              show_row_names = FALSE, width = unit(15, "mm"),
              top_annotation = HeatmapAnnotation(summary = anno_summary(gp = gpar(fill = 2:4),
                outline = FALSE, axis_param = list(side = "right"))))
draw(ht_list, split = partition, annotation_legend_list = list(lgd),
    ht_gap = unit(c(2, 8, 8), "mm"))