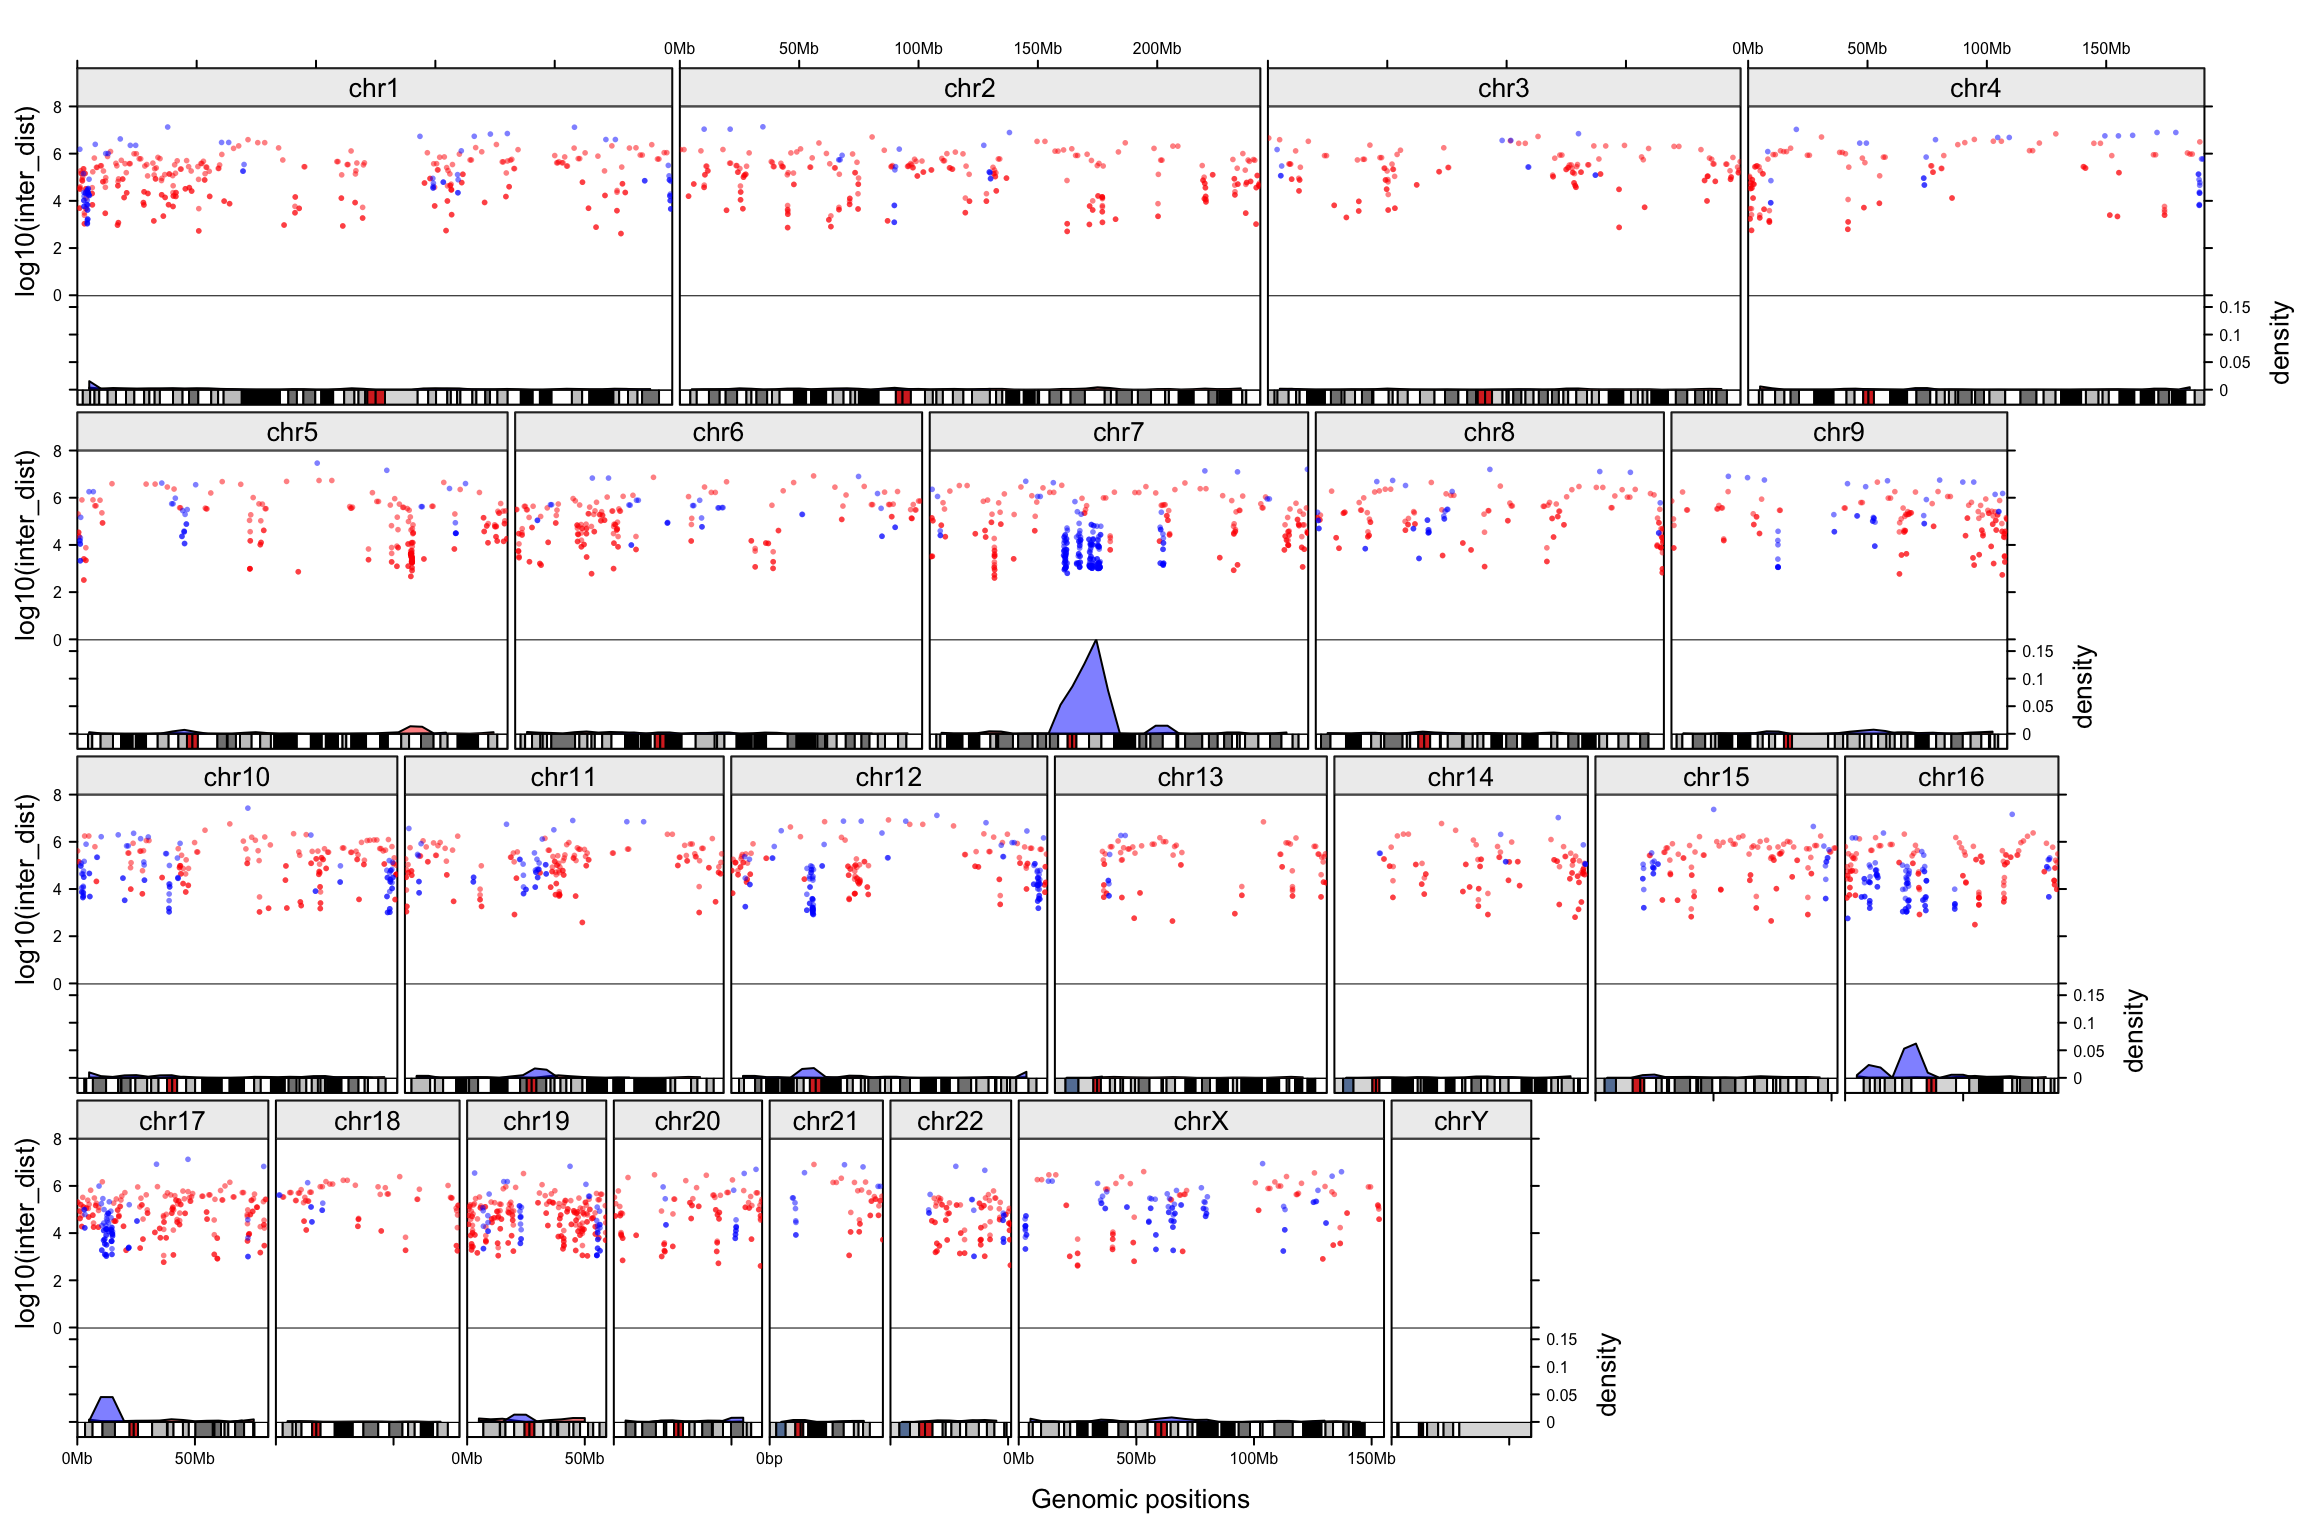
Genomic trellis layout
Basic
| 软件包 | 链接 |
|---|---|
| Language | R |
| Bioconductor | https://bioconductor.org/packages/gtrellis/ |
| GitHub | https://github.com/jokergoo/gtrellis |
| Documentation | https://jokergoo.github.io/gtrellis/ |
| Publication | Zuguang Gu, et al., gtrellis: an R/Bioconductor package for making genome-level Trellis graphics. BMC Bioinformatics 2016. |
Example
library(gtrellis)

load(system.file("extdata", "DMR.RData", package = "circlize"))
DMR_hyper_density = circlize::genomicDensity(DMR_hyper, window.size = 1e7)
DMR_hyper_rainfall = circlize::rainfallTransform(DMR_hyper)
DMR_hypo_density = circlize::genomicDensity(DMR_hypo, window.size = 1e7)
DMR_hypo_rainfall = circlize::rainfallTransform(DMR_hypo)

add_graphics = function() {
    add_points_track(DMR_hyper_rainfall, log10(DMR_hyper_rainfall[[4]]),
        pch = 16, size = unit(1, "mm"), gp = gpar(col = "#FF000080"))
    add_points_track(DMR_hypo_rainfall, log10(DMR_hypo_rainfall[[4]]), track = current_track(),
        pch = 16, size = unit(1, "mm"), gp = gpar(col = "#0000FF80"))

    # track for genomic density
    add_lines_track(DMR_hyper_density, DMR_hyper_density[[4]], area = TRUE,
        gp = gpar(fill = "#FF000080"))
    add_lines_track(DMR_hypo_density, DMR_hypo_density[[4]], area = TRUE, track = current_track(),
        gp = gpar(fill = "#0000FF80"))
}

gtrellis_layout(n_track = 2, nrow = 4, compact = TRUE,
    track_axis = TRUE,
    track_height = unit.c(unit(1, "null"),
                          unit(0.5, "null")),
    track_ylim = c(0, 8, c(0, max(c(DMR_hyper_density[[4]], DMR_hypo_density[[4]])))),
    track_ylab = c("log10(inter_dist)", "density"),
    add_name_track = TRUE, add_ideogram_track = TRUE)
add_graphics()