Visualize genomic data using Hilbert Curve.
Basic
| 软件包 | 链接 |
|---|---|
| Language | R |
| Bioconductor | https://bioconductor.org/packages/HilbertCurve/ |
| GitHub | https://github.com/jokergoo/HilbertCurve |
| Documentation | https://jokergoo.github.io/HilbertCurve/ |
| Publication | Zuguang Gu, et al., HilbertCurve: an R/Bioconductor package for high-resolution visualization of genomic data. Bioinformatics 2016. |
Example
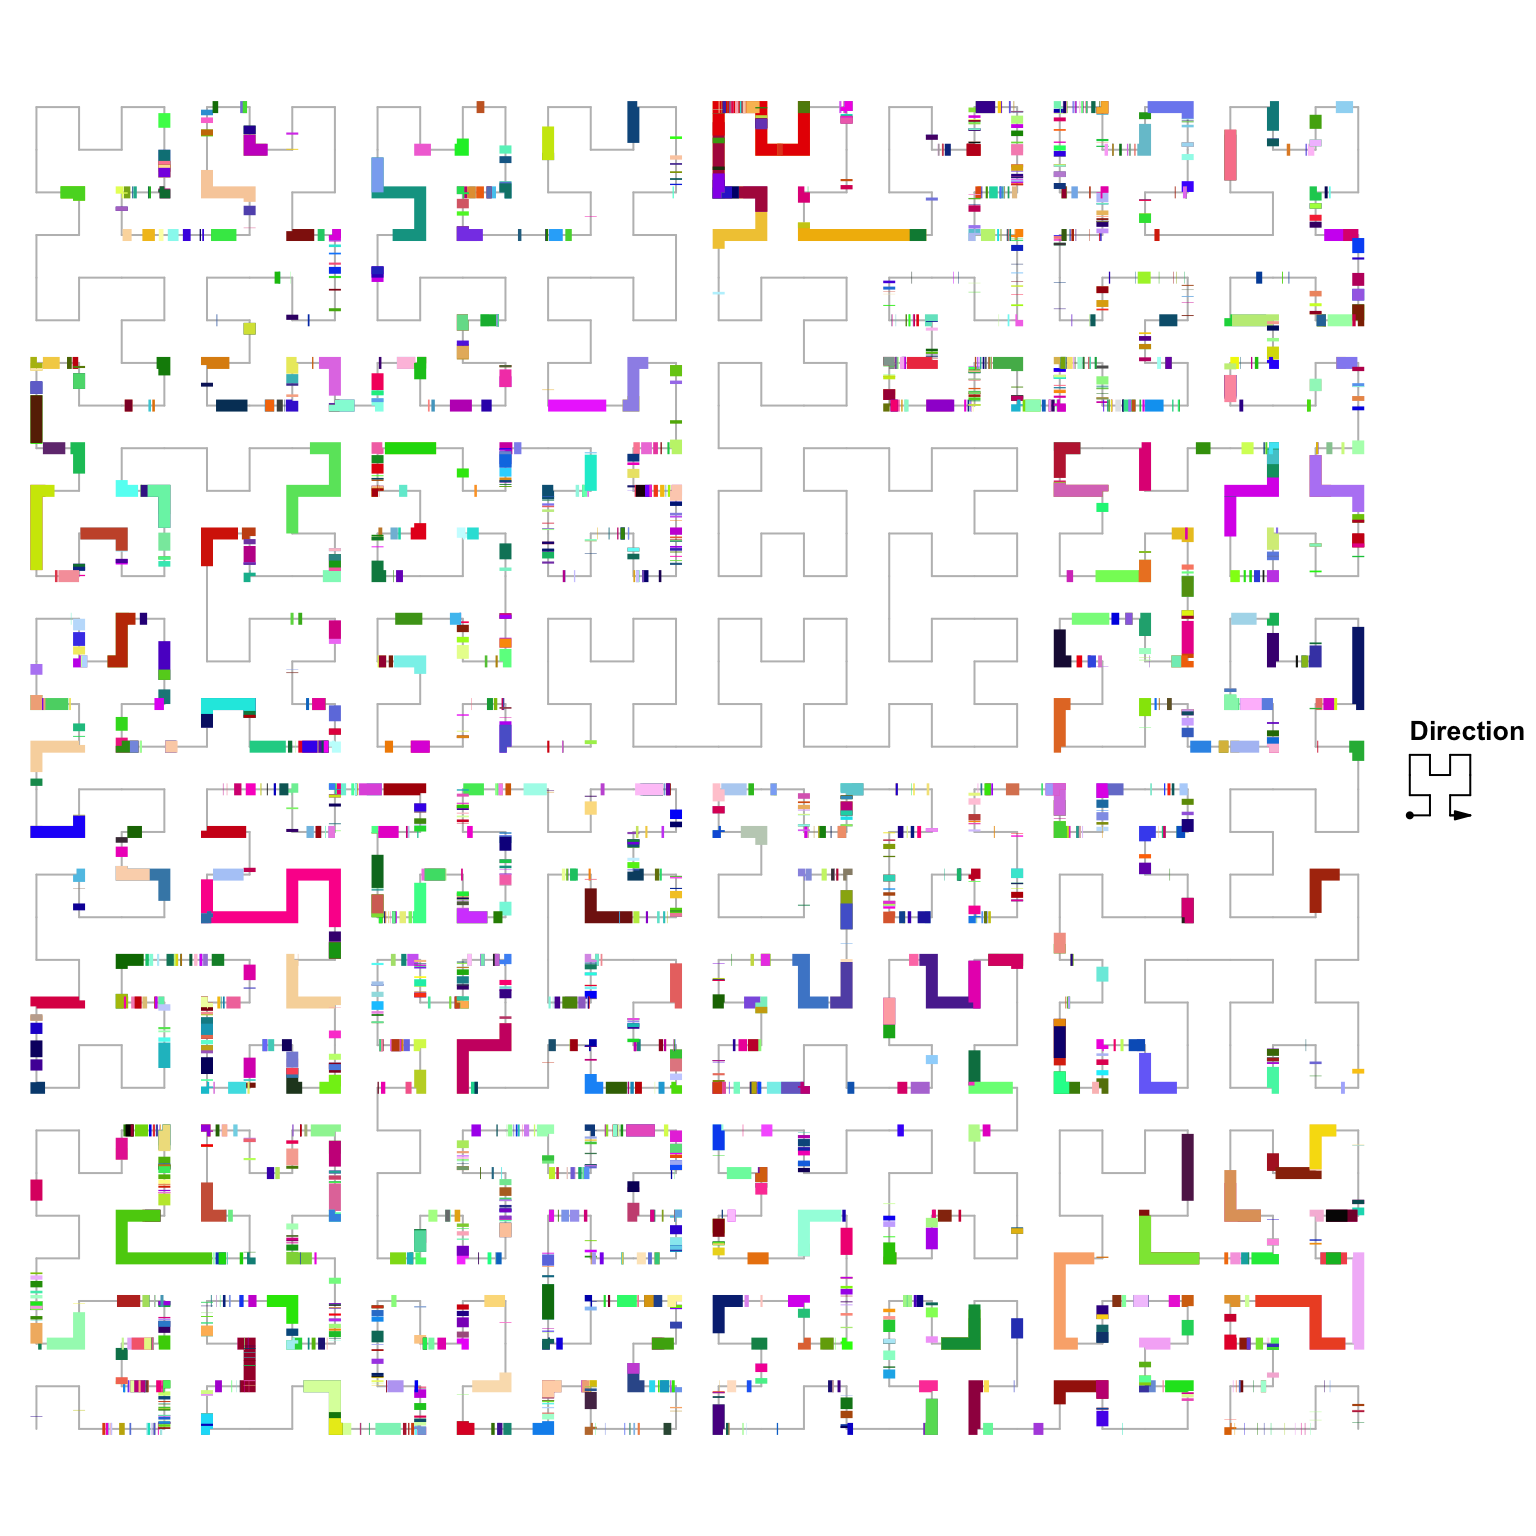
Distribution of genes on human chromosome 1.
library(GenomicRanges)
library(HilbertCurve)
library(circlize)
load(system.file("extdata", "refseq_chr1.RData", package = "HilbertCurve"))
hc = GenomicHilbertCurve(chr = "chr1", level = 5, reference = TRUE,
    reference_gp = gpar(lty = 1, col = "grey"), arrow = FALSE)
hc_segments(hc, g, gp = gpar(lwd = 6, col = rand_color(length(g))))