Archimedean spiral visualization.
Basic
| 软件包 | 链接 |
|---|---|
| Language | R |
| CRAN | https://cran.r-project.org/package=spiralize |
| GitHub | https://github.com/jokergoo/spiralize |
| Documentation | https://jokergoo.github.io/spiralize/ |
| Publication | Zuguang Gu, et al., spiralize: an R package for visualizing data on spirals. Bioinformatics 2022. |
Example
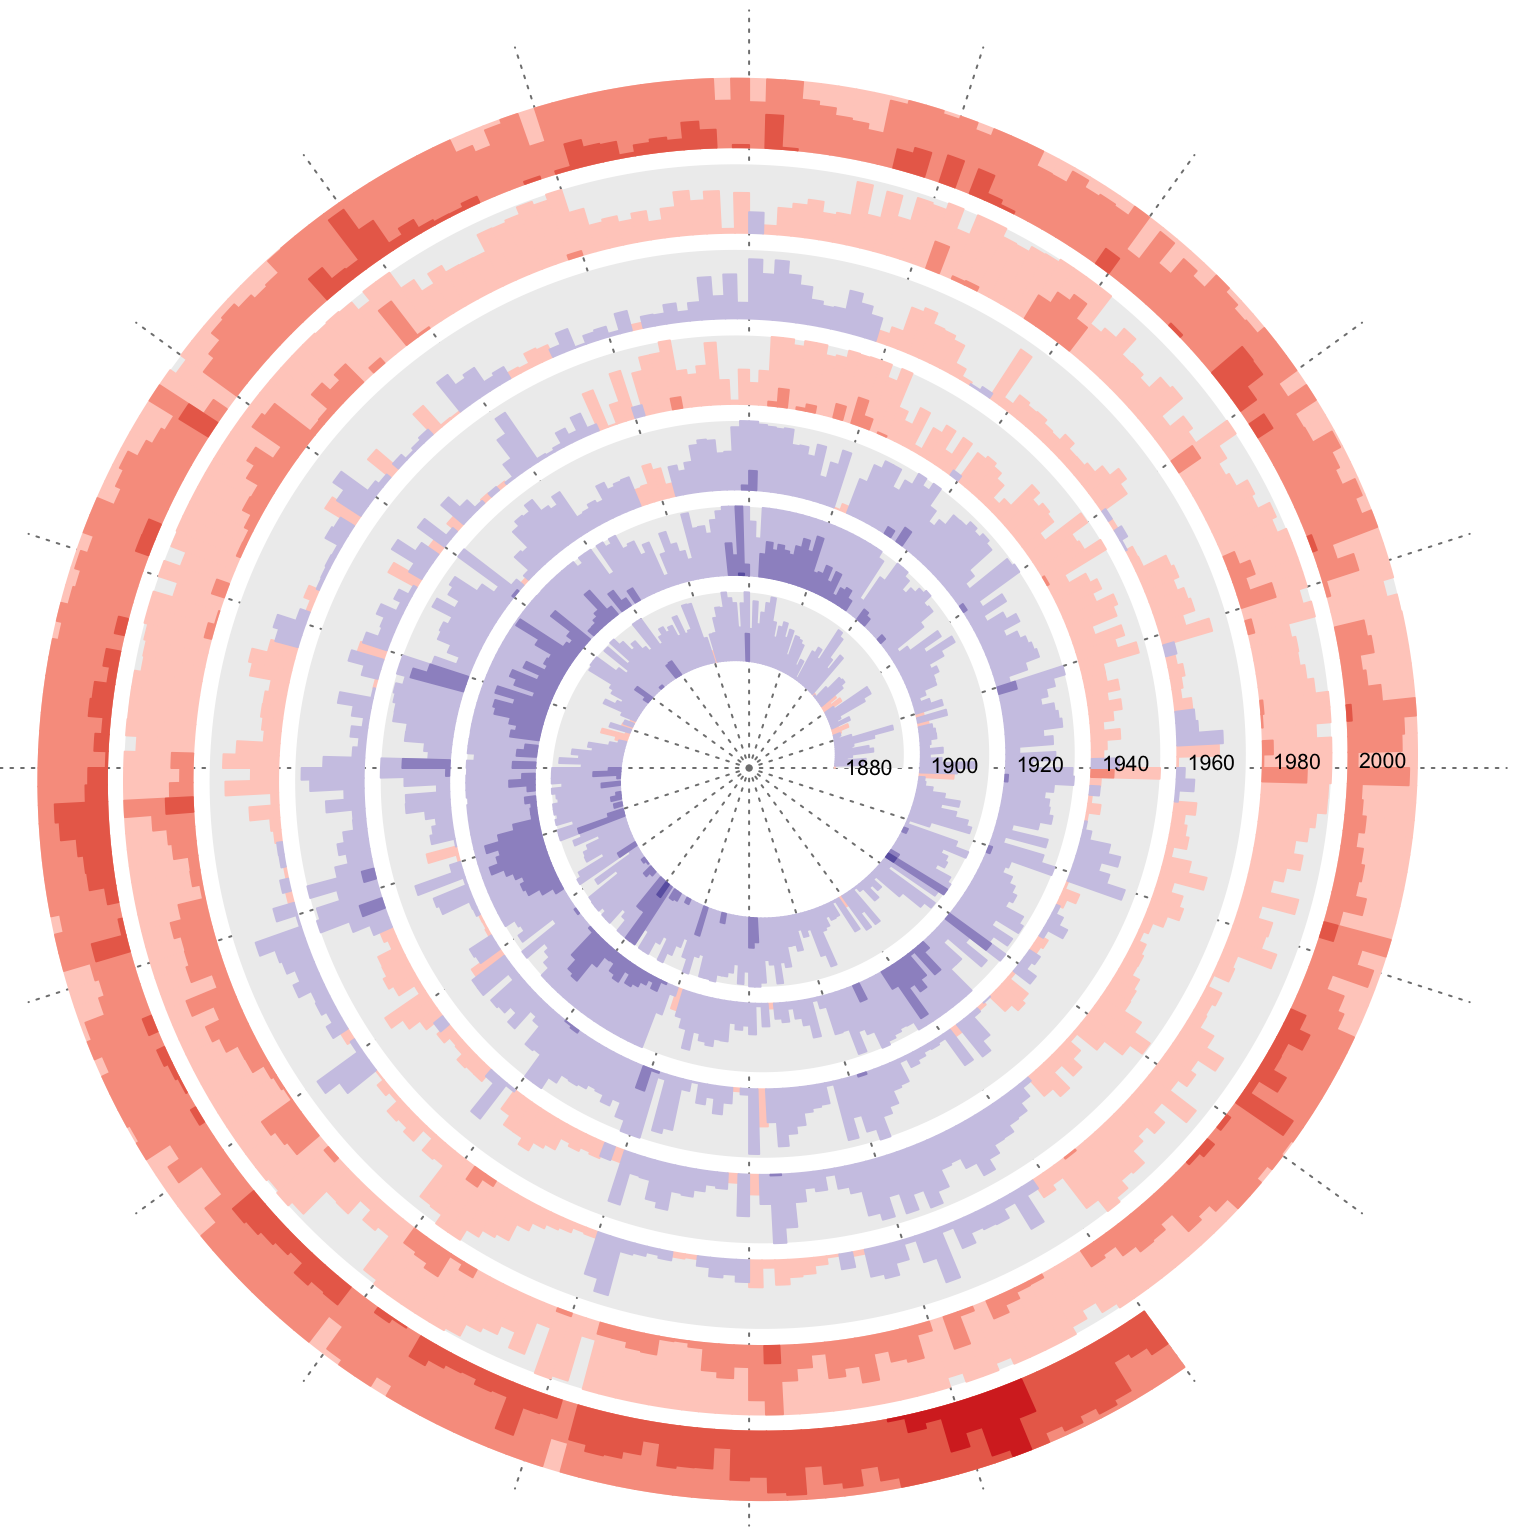
Global temperature change in the recent 20 years.
library(spiralize)
df = readRDS(system.file("extdata", "global_temperature.rds", package = "spiralize"))
df = df[df$Source == "GCAG", ]

spiral_initialize_by_time(xlim = range(df$Date), unit_on_axis = "months", period = "year",
    period_per_loop = 20, polar_lines_by = 360/20, vp_param = list(x = unit(0, "npc"), just = "left"))
spiral_track()
lt = spiral_horizon(df$Date, df$Mean, use_bar = TRUE)

spiral_text("1880-01-01", 0.5, "1880", gp = gpar(fontsize = 8))
spiral_text("1900-01-01", 0.5, "1900", gp = gpar(fontsize = 8))
spiral_text("1920-01-01", 0.5, "1920", gp = gpar(fontsize = 8))
spiral_text("1940-01-01", 0.5, "1940", gp = gpar(fontsize = 8))
spiral_text("1960-01-01", 0.5, "1960", gp = gpar(fontsize = 8))
spiral_text("1980-01-01", 0.5, "1980", gp = gpar(fontsize = 8))
spiral_text("2000-01-01", 0.5, "2000", gp = gpar(fontsize = 8))