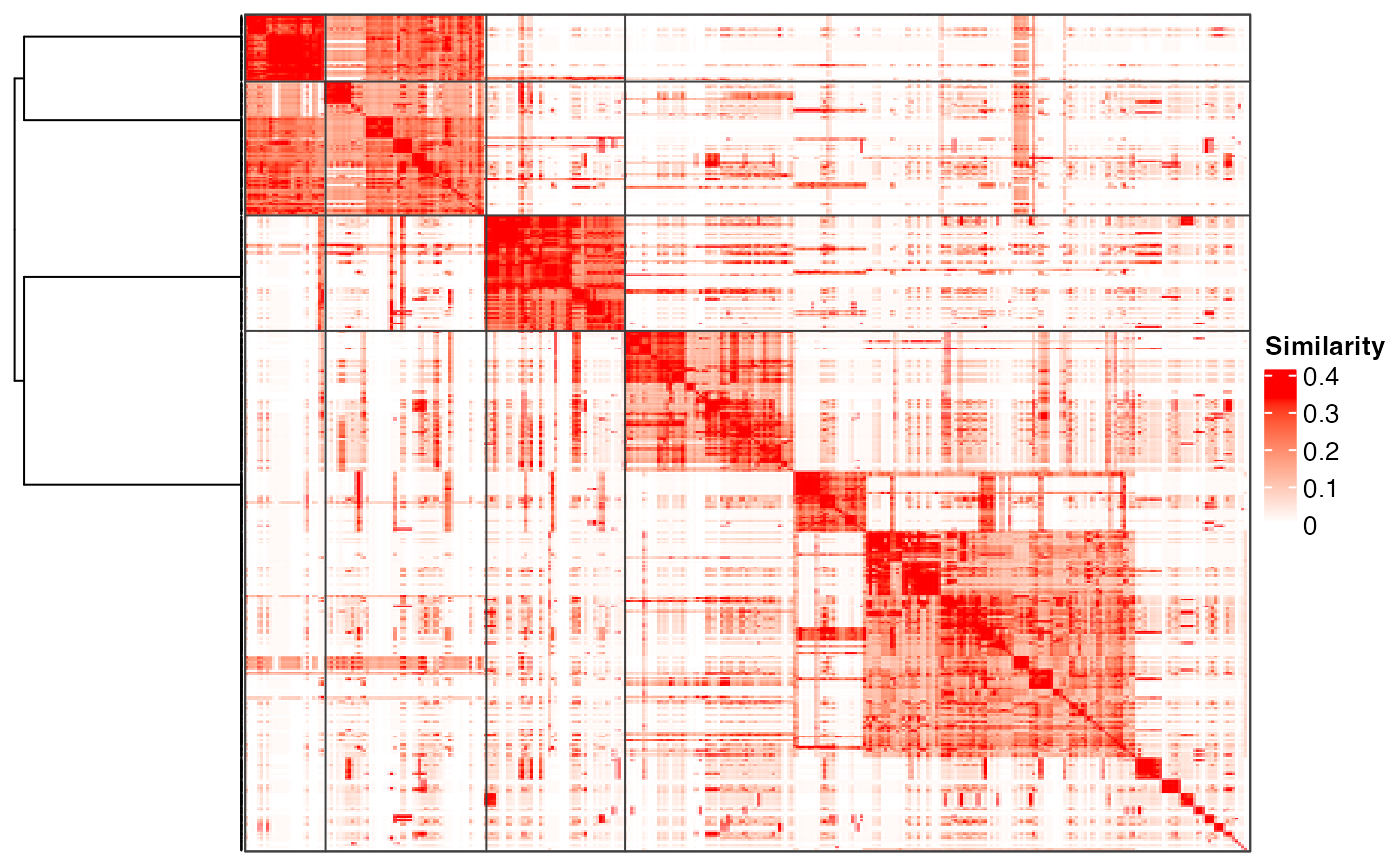
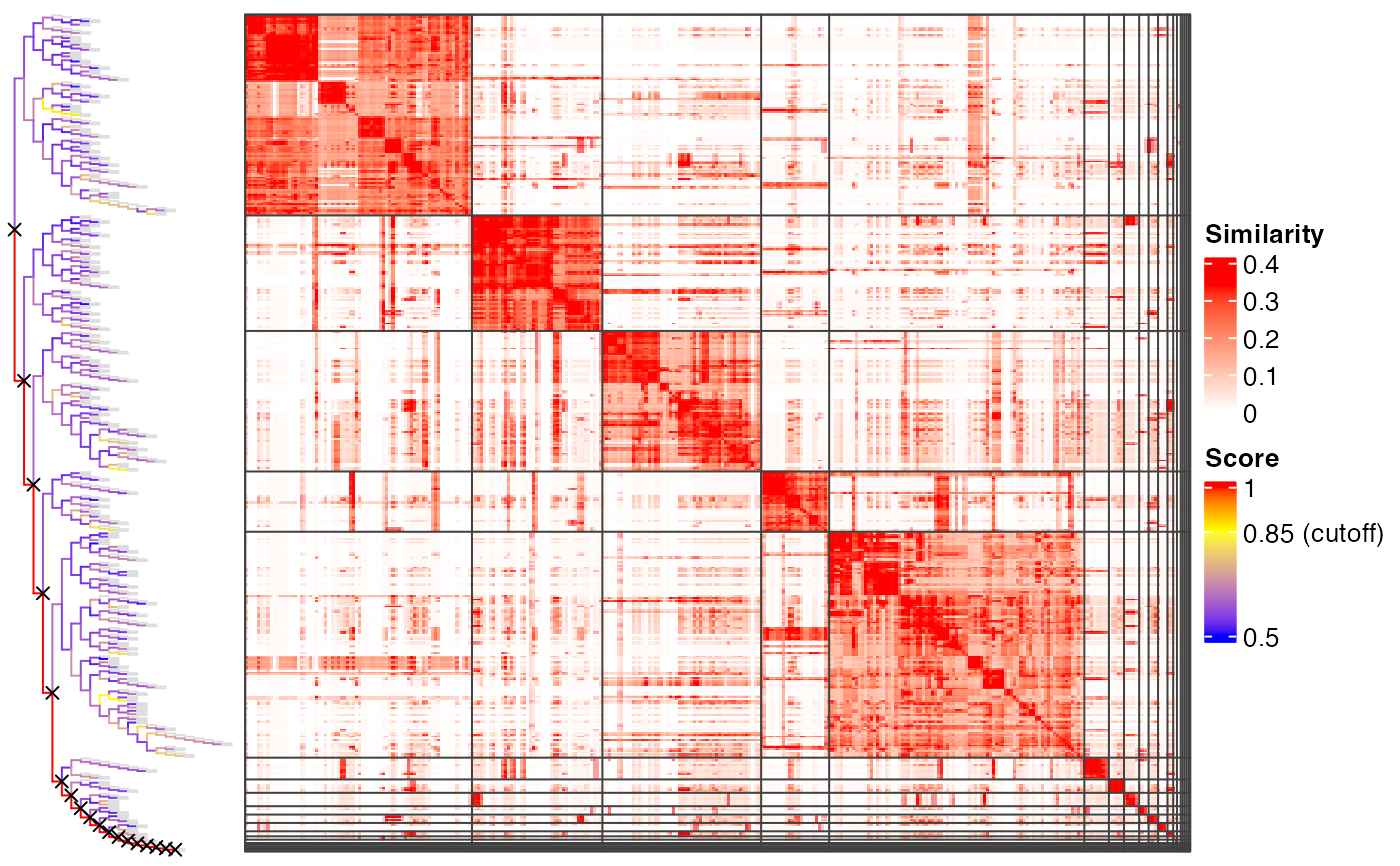
Visualize the process of binary cut
plot_binary_cut.RdVisualize the process of binary cut
plot_binary_cut(mat, value_fun = area_above_ecdf, cutoff = 0.85,
    partition_fun = partition_by_pam, dend = NULL, dend_width = unit(3, "cm"),
    depth = NULL, show_heatmap_legend = TRUE, ...)
Arguments
- mat
The similarity matrix.
- value_fun
A function that calculates the scores for the four submatrices on a node.
- cutoff
The cutoff for splitting the dendrogram.
- partition_fun
A function to split each node into two groups. Pre-defined functions in this package are
partition_by_kmeanspp,partition_by_pamandpartition_by_hclust.- dend
A dendrogram object, used internally.
- depth
Depth of the recursive binary cut process.
- dend_width
Width of the dendrogram on the plot.
- show_heatmap_legend
Whether to show the heatmap legend.
- ...
Other arguments.
Details
After the functions which perform clustering are executed, such as simplifyGO or
binary_cut, the dendrogram is temporarily saved and plot_binary_cut directly
uses this dendrogram.
Examples
# \donttest{
mat = readRDS(system.file("extdata", "random_GO_BP_sim_mat.rds",
package = "simplifyEnrichment"))
plot_binary_cut(mat, depth = 1)
#> use the cached dendrogram.
 plot_binary_cut(mat, depth = 2)
#> use the cached dendrogram.
plot_binary_cut(mat, depth = 2)
#> use the cached dendrogram.
 plot_binary_cut(mat)
#> use the cached dendrogram.
plot_binary_cut(mat)
#> use the cached dendrogram.
 # }
# }