circlize 0.4.10 is now on CRAN. Besides the bug fixes, following are the user-visible changes/features.
library(circlize)
set.seed(123)
Add circos.barplot(), circos.boxplot() and circos.violin()
circos.barplot(), circos.boxplot() and circos.violin() are used inside the panel.fun. Please note
the values on x-axes are the integer indices of bars, boxes or violins for which xlim should
be properly set in circos.initialize().
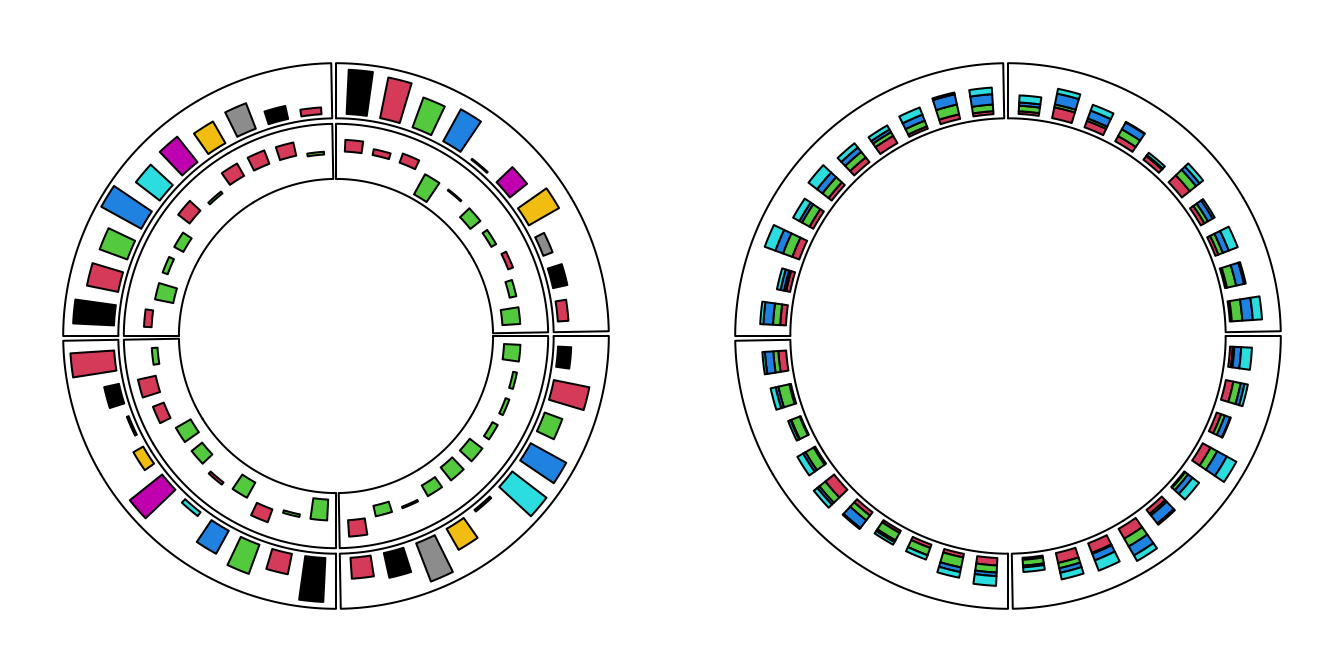
Barplots
For circular barplots, you can either specify a vector which generates a “normal” barplot, or a matrix which generates a stacked barplot.
par(mfrow = c(1, 2))
circos.initialize(fa = letters[1:4], xlim = c(0, 10))
circos.track(ylim = c(0, 1), panel.fun = function(x, y) {
    value = runif(10)
    circos.barplot(value, 1:10 - 0.5, col = 1:10)
})
circos.track(ylim = c(-1, 1), panel.fun = function(x, y) {
    value = runif(10, min = -1, max = 1)
    circos.barplot(value, 1:10 - 0.5, col = ifelse(value > 0, 2, 3))
})
circos.clear()

circos.initialize(fa = letters[1:4], xlim = c(0, 10))
circos.track(ylim = c(0, 4), panel.fun = function(x, y) {
    value = matrix(runif(10*4), ncol = 4)
    circos.barplot(value, 1:10 - 0.5, col = 2:5)
})
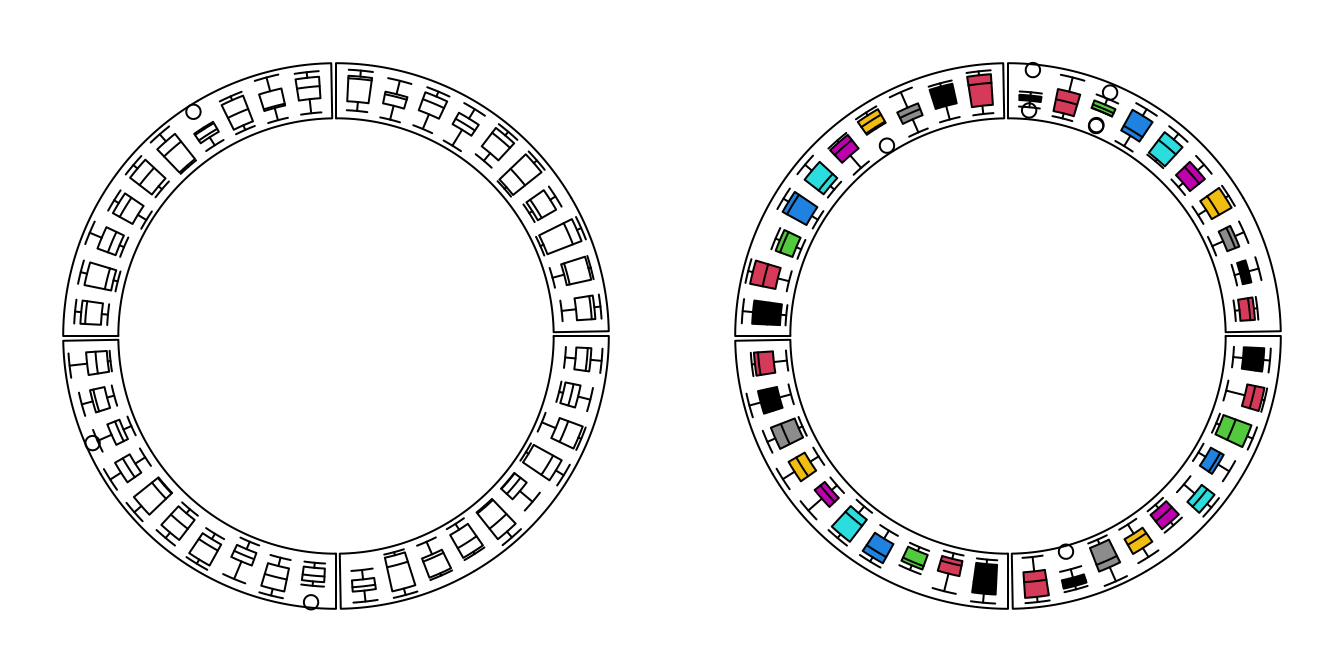
circos.clear()Boxplot
For circular boxplots, the boxes can be drawn one-by-one by providing a vector for each box, or drawn in batch with a list/matrix as input.
par(mfrow = c(1, 2))
circos.initialize(fa = letters[1:4], xlim = c(0, 10))
circos.track(ylim = c(0, 1), panel.fun = function(x, y) {
    for(pos in seq(0.5, 9.5, by = 1)) {
        value = runif(10)
        circos.boxplot(value, pos)
    }
})
circos.clear()

circos.initialize(fa = letters[1:4], xlim = c(0, 10))
circos.track(ylim = c(0, 1), panel.fun = function(x, y) {
    value = replicate(runif(10), n = 10, simplify = FALSE)
    circos.boxplot(value, 1:10 - 0.5, col = 1:10)
})
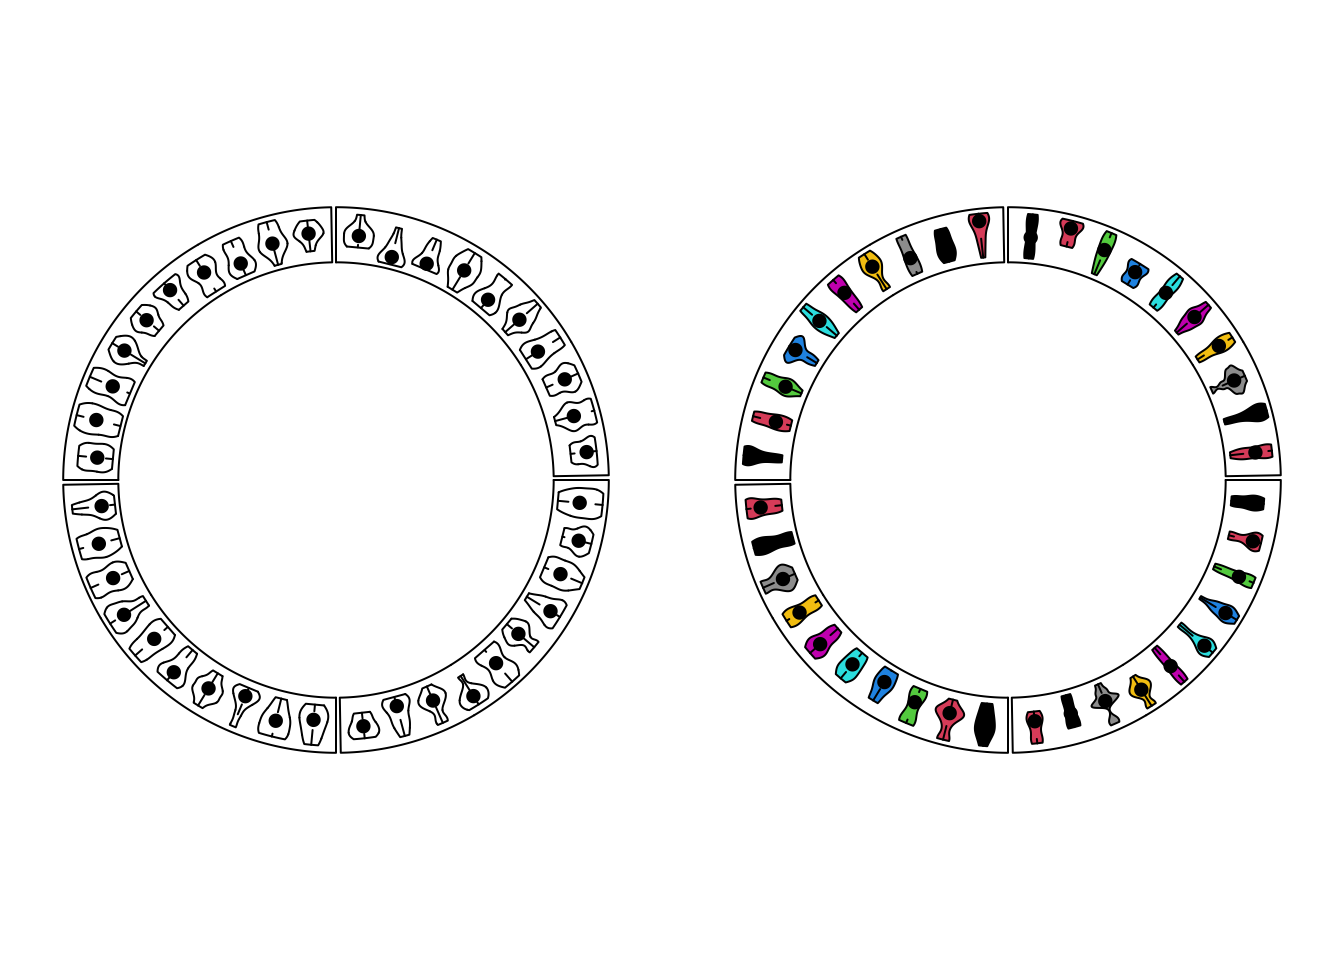
circos.clear()Violin plots
For circular violin plots, the violins can be drawn one-by-one by providing a vector for each violin, or drawn in batch with a list/matrix as input.
Please note, to make it comparable between violins, max_density argument
should be set.
par(mfrow = c(1, 2))
circos.initialize(fa = letters[1:4], xlim = c(0, 10))
circos.track(ylim = c(0, 1), panel.fun = function(x, y) {
    for(pos in seq(0.5, 9.5, by = 1)) {
        value = runif(10)
        circos.violin(value, pos)
    }
})
circos.clear()

circos.initialize(fa = letters[1:4], xlim = c(0, 10))
circos.track(ylim = c(0, 1), panel.fun = function(x, y) {
    value = replicate(runif(10), n = 10, simplify = FALSE)
    circos.violin(value, 1:10 - 0.5, col = 1:10)
})
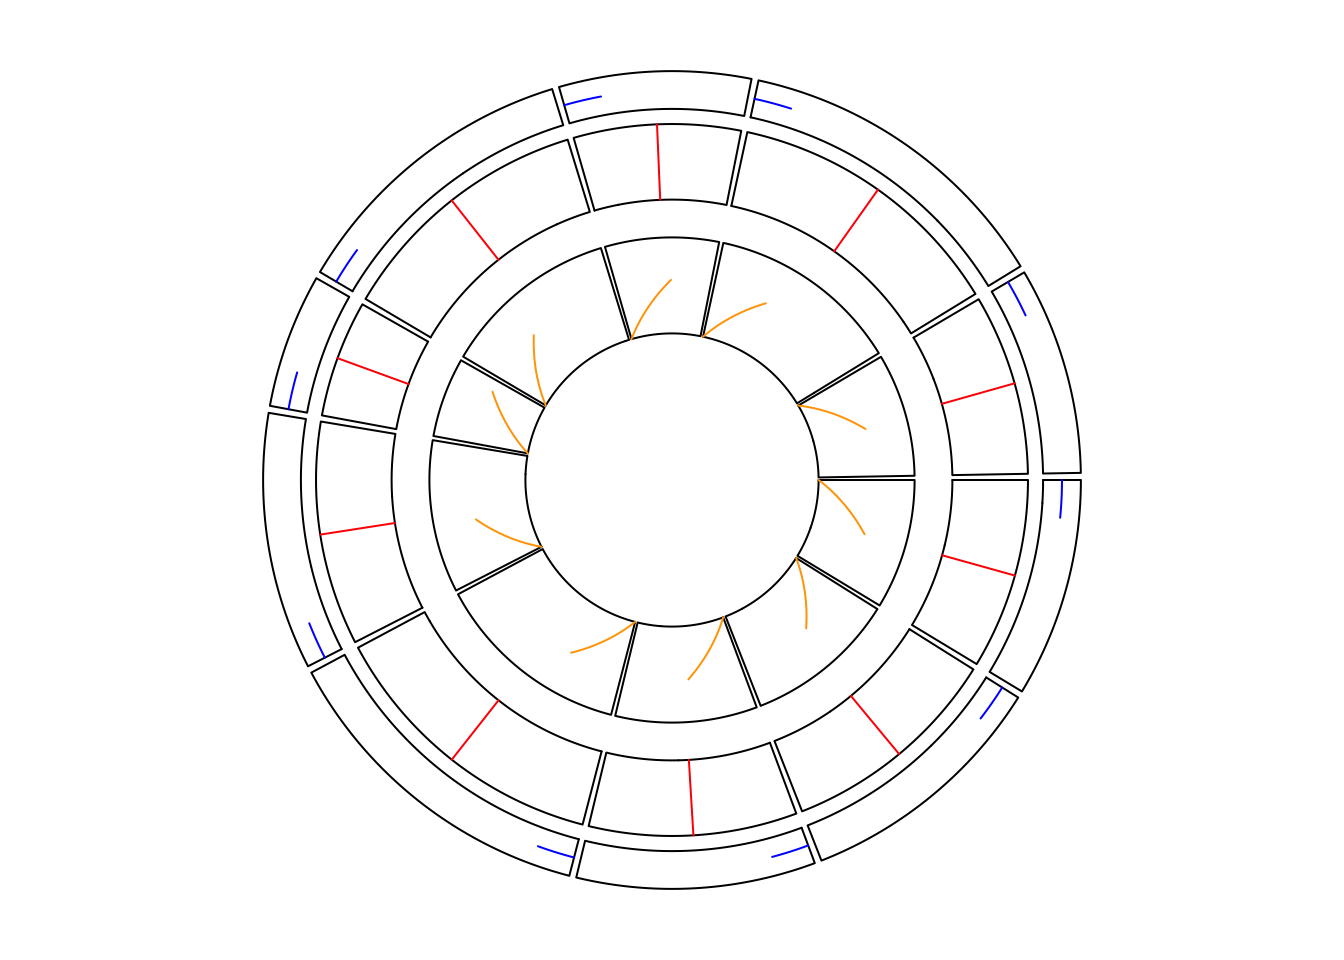
circos.clear()Physical units
In the older versions, the widths/heights/lengths are specified by
convert_x()/convert_y()/convert_height() functions, however, the
function names are not straightforward. Now there are following functions that
control the physical size:
mm_x()/cm_x()/inch_x(): on x-axes in the cells.mm_y()/cm_y()/inch_y(): on y-axes in the cells.mm_h()/cm_h()/inch_h(): control the height of track and the gap between tracks.
See the following example:
fa = letters[1:10]
circos.par(cell.padding = c(0, 0, 0, 0), track.margin = c(0, 0))
circos.initialize(fa, xlim = cbind(rep(0, 10), runif(10, 0.5, 1.5)))
circos.track(ylim = c(0, 1), track.height = mm_h(5),
    panel.fun = function(x, y) {
        circos.lines(c(0, 0 + mm_x(5)), c(0.5, 0.5), col = "blue")
    })
set_track_gap(mm_h(2))
circos.track(ylim = c(0, 1), track.height = cm_h(1),
    panel.fun = function(x, y) {
        xcenter = get.cell.meta.data("xcenter")
        circos.lines(c(xcenter, xcenter), c(0, cm_y(1)), col = "red")
    })
set_track_gap(mm_h(5))
circos.track(ylim = c(0, 1), track.height = inch_h(0.5),
    panel.fun = function(x, y) {
        line_length_on_x = cm_x(1*sqrt(2)/2)
        line_length_on_y = cm_y(1*sqrt(2)/2)
        circos.lines(c(0, line_length_on_x), c(0, line_length_on_y), col = "orange")
    })
circos.clear()Set gaps between tracks
In the older version, you need to set track.height parameter either in
circos.par() or in circos.track() to control the space between tracks. Now
there is a new set_track_gap() function which simplifies the setting of gaps
between two tracks. With the mm_h()/cm_h()/inch_h() functions, it is
very easy to set the gaps with physical units.
circos.initialize(fa = letters[1:10], xlim = c(0, 1))
circos.track(ylim = c(0, 1))
set_track_gap(mm_h(2)) # 2mm
circos.track(ylim = c(0, 1))
set_track_gap(cm_h(0.5)) # 0.5cm
circos.track(ylim = c(0, 1))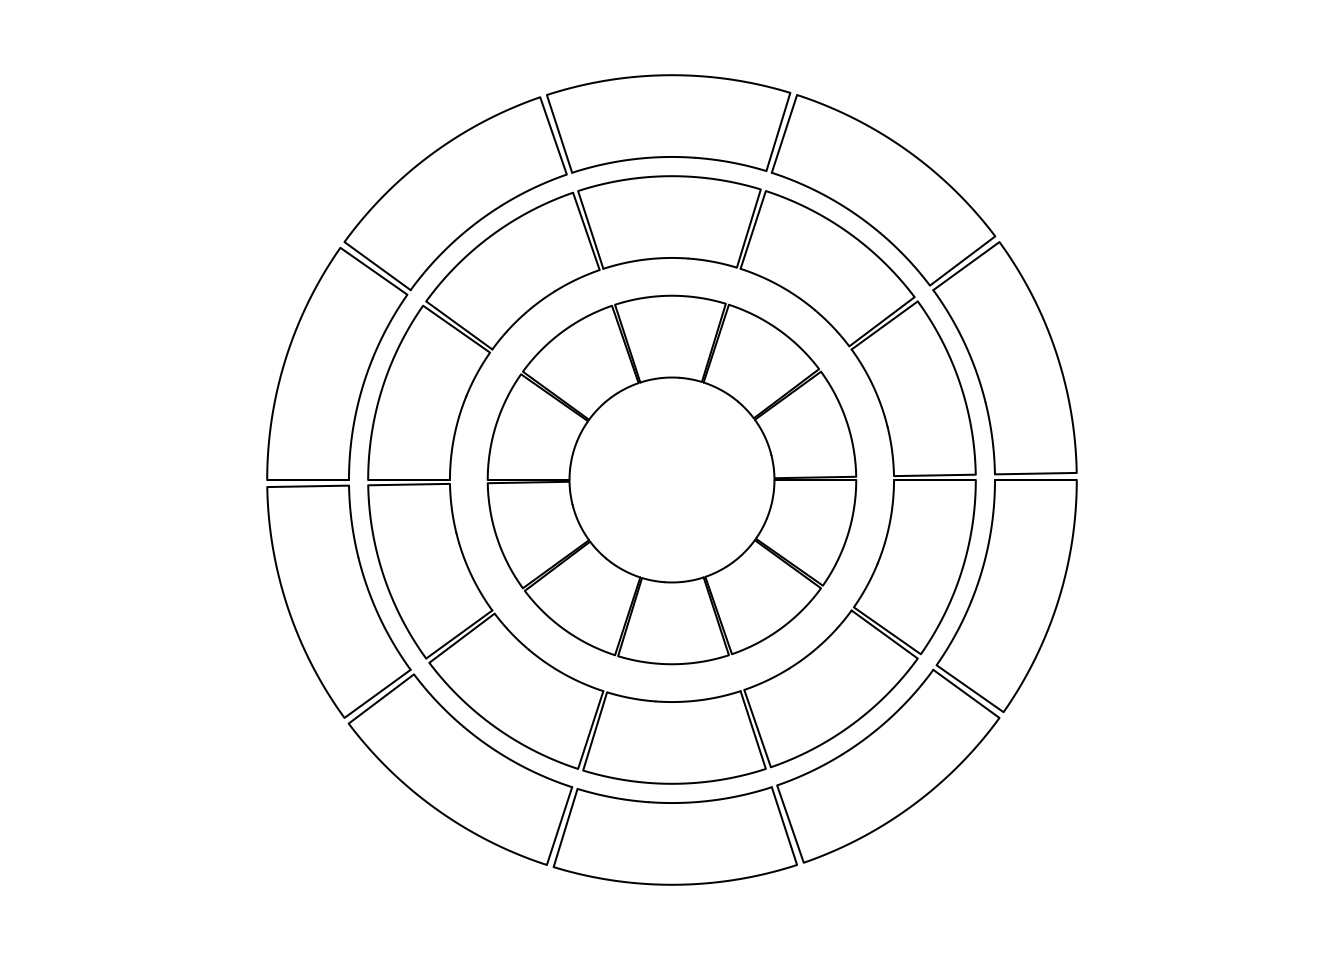
circos.clear()gap.degree with names
circos.par() is aimed to be designed to be independent to the number or the
order of sectors, however, there is an exception. The gap.degree parameter
controls the spaces between two neighbouring sectors. When it is set as a
scalar, the gap is the same to every two neighbouring sectors and it works
fine. It can also be a vector which has the same length as the number of
sectors and it can cause problems:
- When you change the order of the sectors, you also need to manually change
the order of
gap.degree. - in
chordDiagram()function, by default the tiny sectors are removed to improve the visualization, which means, thegap.degreeshould be adjusted. - Also in
chordDiagram(), sometimes it is not very straightforward to find out the order of sectors, thus, it is difficult to set a propergap.degree.
Now, from version 0.4.10, the value of gap.degree can be set as a named
vector where the names are the names of the sectors. In this case, the
gap.degree vector can be automatically reordered or subsetted according to
the sector ordering in the plot.
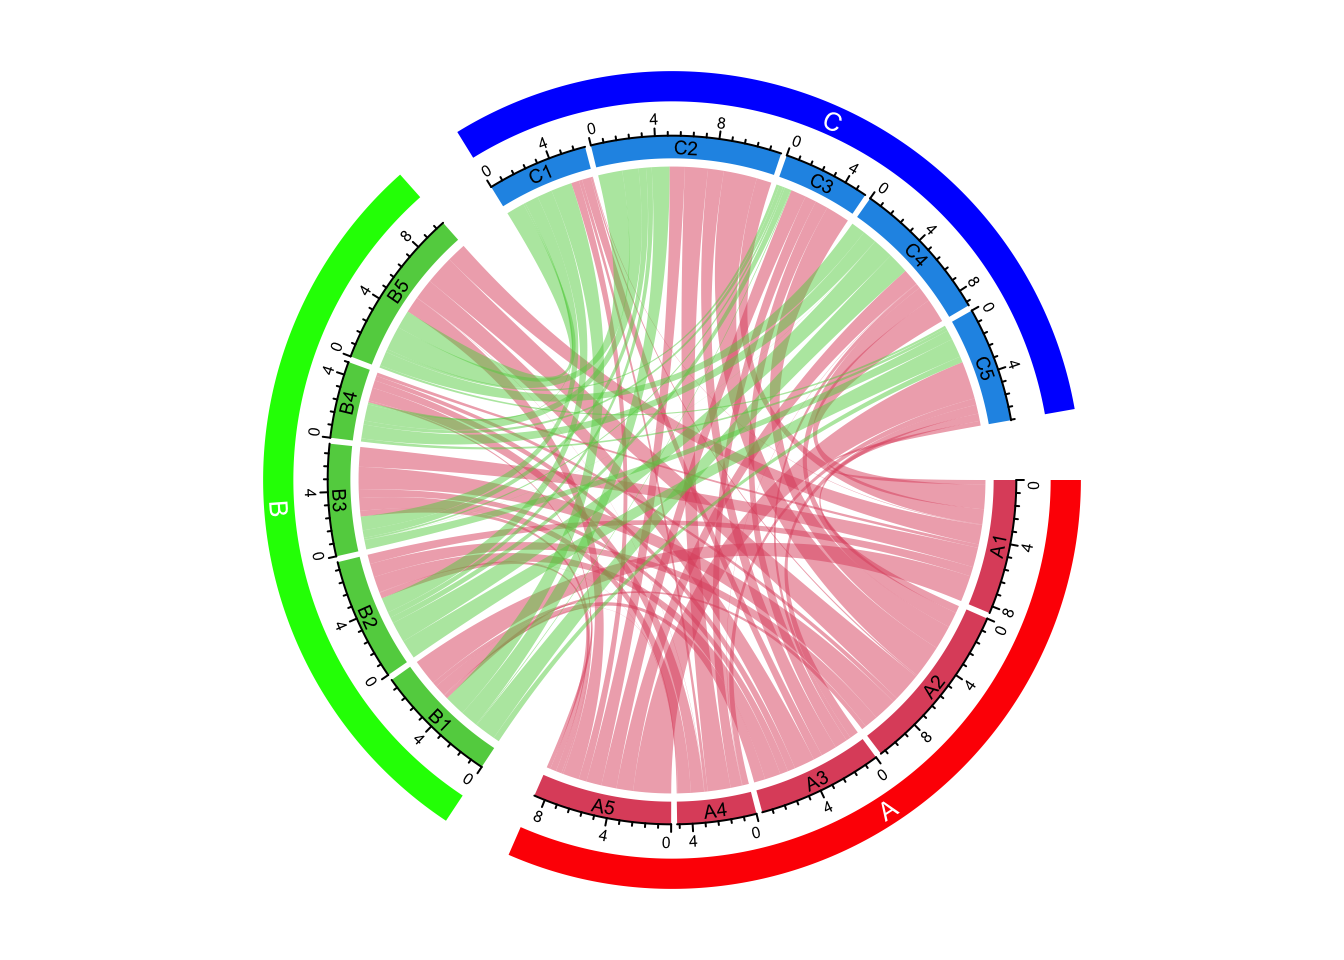
Multi-group Chord diagram
Please see https://jokergoo.github.io/2020/06/08/multiple-group-chord-diagram/. An example is
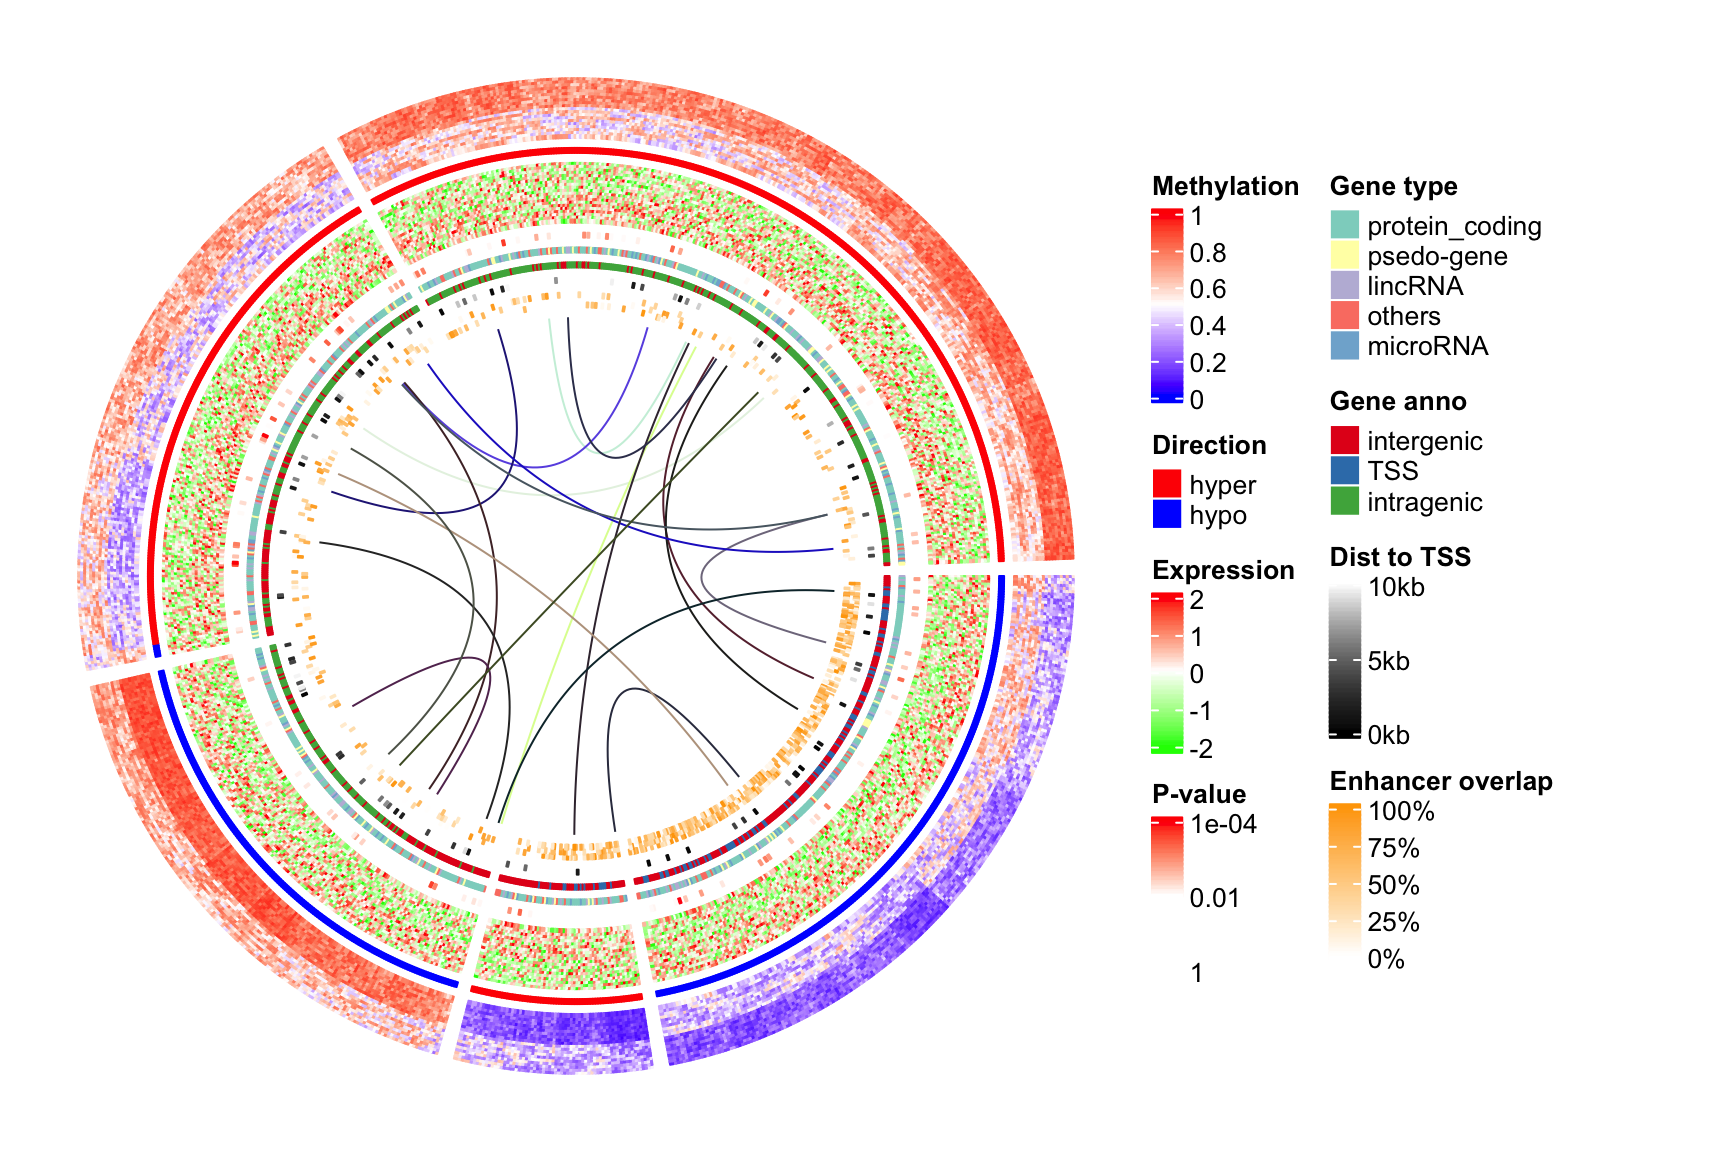
Circular Heatmaps
Please see https://jokergoo.github.io/2020/05/21/make-circular-heatmaps/. An example is