Plot Chord Diagram
chordDiagram.RdPlot Chord Diagram
chordDiagram(
    x,
    grid.col = NULL,
    grid.border = NA,
    transparency = 0.5,
    col = NULL,
    row.col = NULL,
    column.col = NULL,
    order = NULL,
    directional = 0,
    xmax = NULL,
    symmetric = FALSE,
    keep.diagonal = FALSE,
    direction.type = "diffHeight",
    diffHeight = mm_h(2),
    link.target.prop = TRUE,
    target.prop.height = mm_h(1),
    reduce = 1e-5,
    self.link = 2,
    preAllocateTracks = NULL,
    annotationTrack = c("name", "grid", "axis"),
    annotationTrackHeight = mm_h(c(3, 2)),
    link.border = NA,
    link.lwd = par("lwd"),
    link.lty = par("lty"),
    link.auto = TRUE,
    link.sort = FALSE,
    link.decreasing = TRUE,
    link.arr.length = ifelse(link.arr.type == "big.arrow", 0.02, 0.4),
    link.arr.width = link.arr.length/2,
    link.arr.type = "triangle",
    link.arr.lty = par("lty"),
    link.arr.lwd = par("lwd"),
    link.arr.col = par("col"),
    link.largest.ontop = FALSE,
    link.visible = TRUE,
    link.rank = NULL,
    link.zindex = NULL,
    link.overlap = FALSE,
    scale = FALSE,
    group = NULL,
    big.gap = 10,
    small.gap = 1,
    ...)
Arguments
| x | a matrix or a data frame. The function will pass all argument to |
|---|---|
| grid.col | pass to |
| grid.border | pass to |
| transparency | pass to |
| col | pass to |
| row.col | pass to |
| column.col | pass to |
| order | pass to |
| directional | pass to |
| xmax | maximum value on x-axes, the value should be a named vector. |
| symmetric | pass to |
| keep.diagonal | pass to |
| direction.type | pass to |
| diffHeight | pass to |
| link.target.prop | pass to |
| target.prop.height | pass to |
| reduce | pass to |
| self.link | pass to |
| preAllocateTracks | pass to |
| annotationTrack | pass to |
| annotationTrackHeight | pass to |
| link.border | pass to |
| link.lwd | pass to |
| link.lty | pass to |
| link.auto | pass to |
| link.sort | pass to |
| link.decreasing | pass to |
| link.arr.length | pass to |
| link.arr.width | pass to |
| link.arr.type | pass to |
| link.arr.lty | pass to |
| link.arr.lwd | pass to |
| link.arr.col | pass to |
| link.largest.ontop | pass to |
| link.visible | pass to |
| link.rank | This is argument is removed. |
| link.zindex | order to add links to the circle, a large value means to add it later. |
| link.overlap | pass to |
| scale | scale each sector to same width |
| group | It contains the group labels and the sector names are used as the names in the vector. |
| big.gap | Gap between the two sets of sectors. If the input is a matrix, the two sets are row sectors and column sectors. If the input is a data frame, the two sets correspond to the first column and the second column. It only works when there is no intersection between the two sets. |
| small.gap | Small gap between sectors. |
| ... | pass to |
Details
Chord diagram is a way to visualize numeric tables ( http://circos.ca/intro/tabular_visualization/ ), especially useful when the table represents information of directional relations. This function visualize tables in a circular way.
This function is flexible and contains some settings that may be a little difficult to understand. Please refer to vignette for better explanation.
See also
Value
A data frame which contains positions of links, columns are:
rnsector name corresponding to rows in the adjacency matrix or the first column in the adjacency list
cnsector name corresponding to columns in the adjacency matrix or the second column in the adjacency list
valuevalue for the interaction or relation
o1order of the link on the "from" sector
o2order of the link on the "to" sector
x1and position of the link on the "from" sector, the interval for the link on the "from" sector is c(x1-abs(value), x1)
x2and position of the link on the "to" sector, the interval for the link on the "from" sector is c(x2-abs(value), x2)
Examples
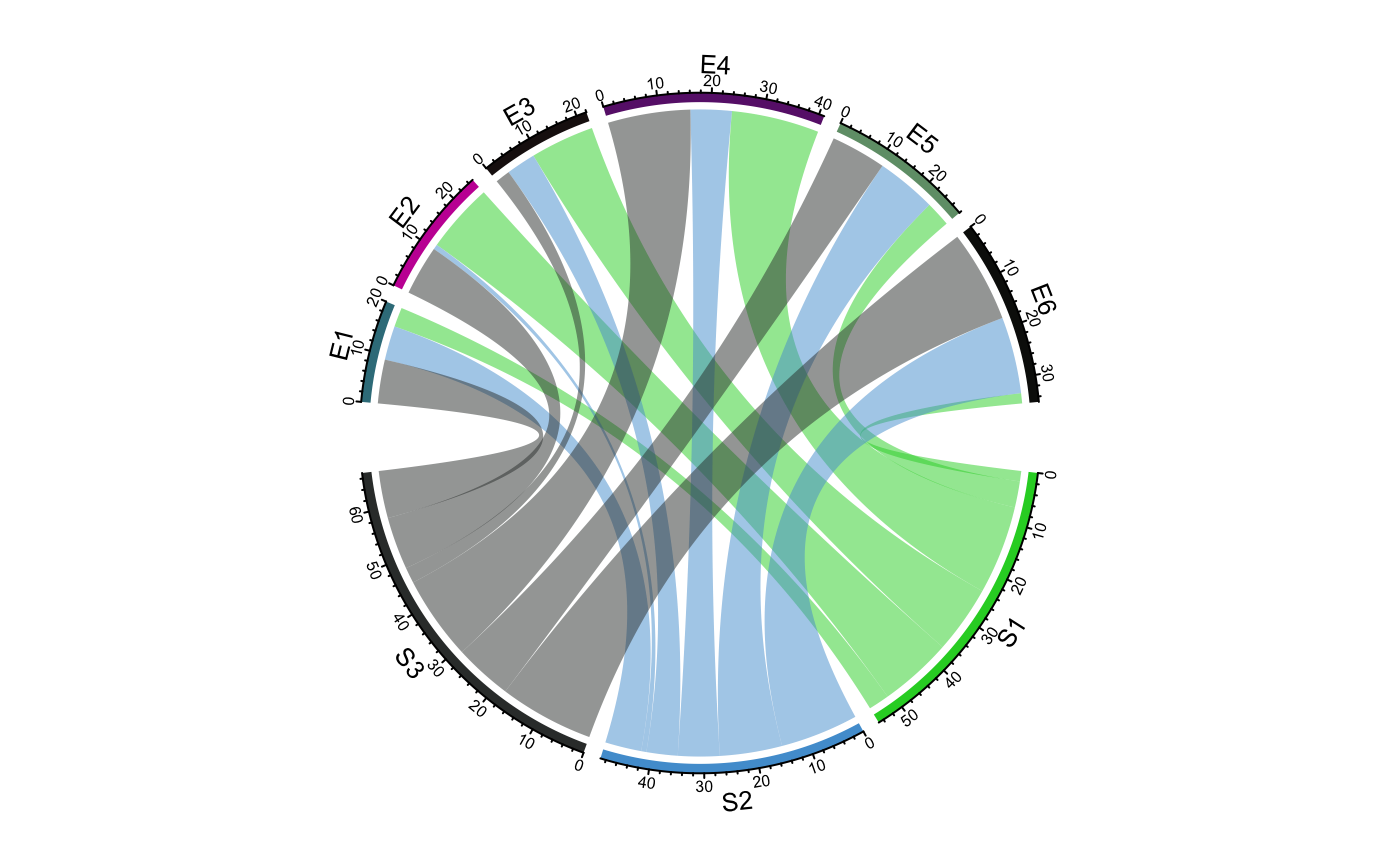
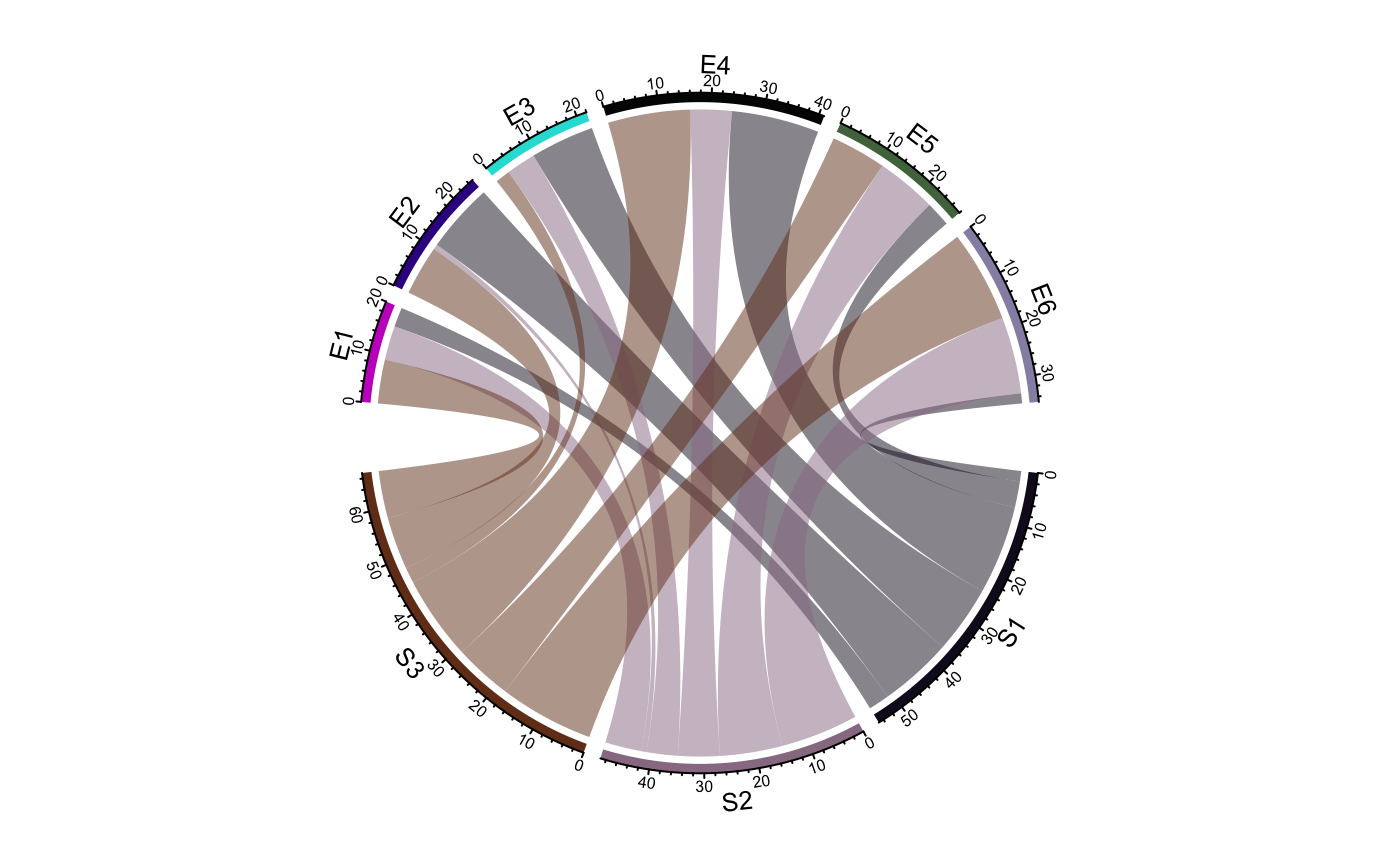
set.seed(999) mat = matrix(sample(18, 18), 3, 6) rownames(mat) = paste0("S", 1:3) colnames(mat) = paste0("E", 1:6) df = data.frame(from = rep(rownames(mat), times = ncol(mat)), to = rep(colnames(mat), each = nrow(mat)), value = as.vector(mat), stringsAsFactors = FALSE) chordDiagram(mat)chordDiagram(df)

