Add lines to a plotting region, specifically for genomic graphics
circos.genomicLines.RdAdd lines to a plotting region, specifically for genomic graphics
circos.genomicLines(
    region,
    value,
    numeric.column = NULL,
    sector.index = get.current.sector.index(),
    track.index = get.current.track.index(),
    posTransform = NULL,
    col = ifelse(area, "grey", "black"),
    lwd = par("lwd"),
    lty = par("lty"),
    type = "l",
    area = FALSE,
    area.baseline = NULL,
    border = "black",
    baseline = "bottom",
    pt.col = par("col"),
    cex = par("cex"),
    pch = par("pch"),
    ...)
Arguments
| region | A data frame contains 2 column which correspond to start positions and end positions. |
|---|---|
| value | A data frame contains values and other information. |
| numeric.column | Which column in |
| sector.index | Index of sector. |
| track.index | Index of track. |
| posTransform | Self-defined function to transform genomic positions, see |
| col | col of lines/areas. If there are more than one numeric column, the length of |
| lwd | Settings are similar as |
| lty | Settings are similar as |
| type | There is an additional option |
| area | Settings are similar as |
| area.baseline | Deprecated, use |
| baseline | Settings are similar as |
| border | Settings are similar as |
| pt.col | Settings are similar as |
| cex | Settings are similar as |
| pch | Settings are similar as |
| ... | Mysterious parameters. |
Details
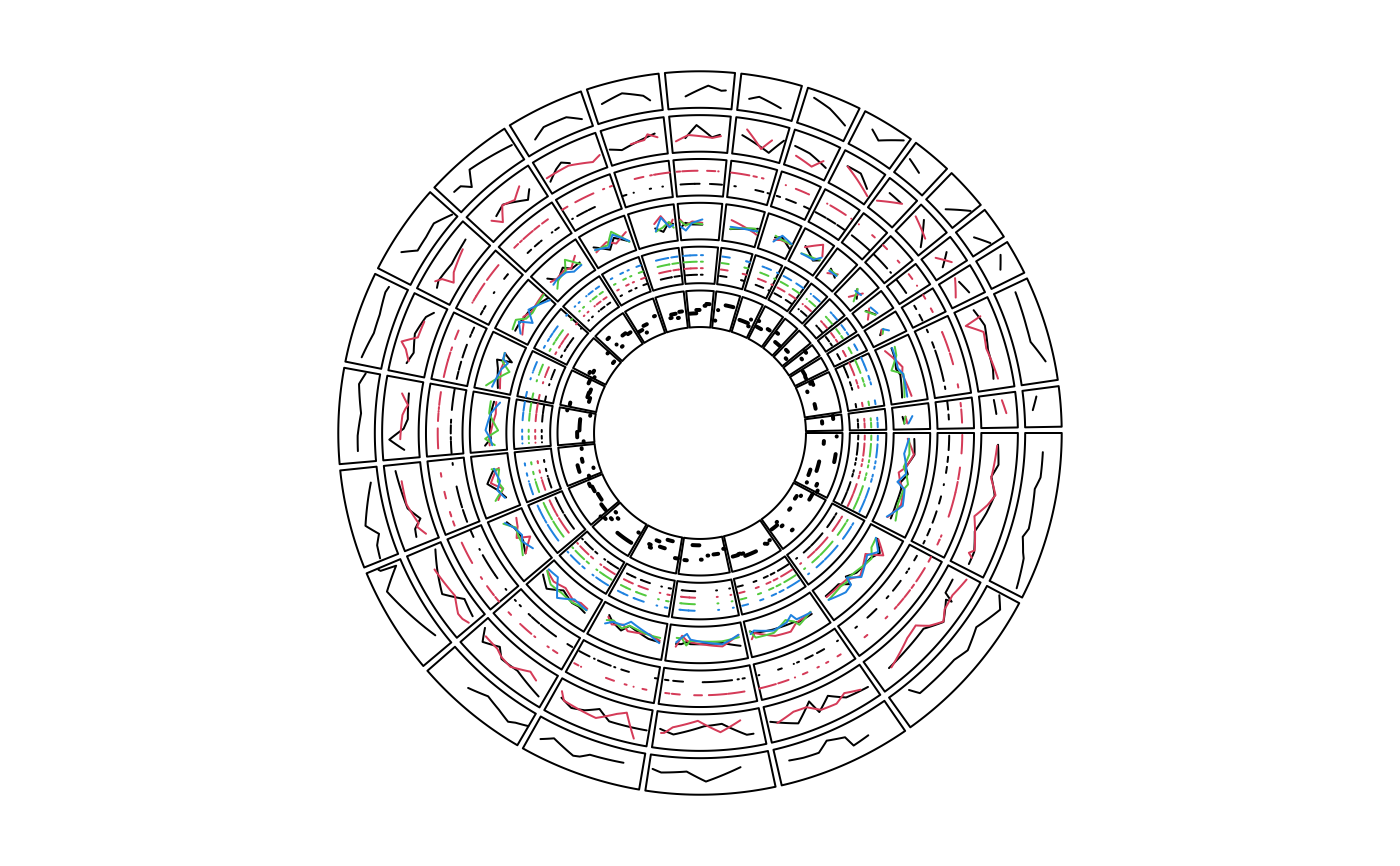
The function is a low-level graphical function and usually is put in panel.fun when using circos.genomicTrack.
The function behaviours differently from different formats of input, see the examples in the "Examples" Section or go to https://jokergoo.github.io/circlize_book/book/modes-of-input.html for more details.
Examples
# \donttest{ ### test bed circos.par("track.height" = 0.1) circos.initializeWithIdeogram(plotType = NULL)bed = generateRandomBed(nr = 100) circos.genomicTrack(bed, panel.fun = function(region, value, ...) { circos.genomicLines(region, value, type = "l", ...) })bed1 = generateRandomBed(nr = 100) bed2 = generateRandomBed(nr = 100) bed_list = list(bed1, bed2) circos.genomicTrack(bed_list, panel.fun = function(region, value, ...) { i = getI(...) circos.genomicLines(region, value, col = i, ...) })circos.genomicTrack(bed_list, stack = TRUE, panel.fun = function(region, value, ...) { i = getI(...) circos.genomicLines(region, value, col = i, ...) })bed = generateRandomBed(nr = 100, nc = 4) circos.genomicTrack(bed, panel.fun = function(region, value, ...) { circos.genomicLines(region, value, col = 1:4, ...) })circos.genomicTrack(bed, stack = TRUE, panel.fun = function(region, value, ...) { i = getI(...) circos.genomicLines(region, value, col = i, ...) })bed = generateRandomBed(nr = 100) circos.genomicTrack(bed, panel.fun = function(region, value, ...) { circos.genomicLines(region, value, type = "segment", lwd = 2, ...) })circos.clear() # }