Draw rectangle-like grid, specifically for genomic graphics
circos.genomicRect.RdDraw rectangle-like grid, specifically for genomic graphics
circos.genomicRect(
    region,
    value = NULL,
    ytop = NULL,
    ybottom = NULL,
    ytop.column = NULL,
    ybottom.column = NULL,
    sector.index = get.current.sector.index(),
    track.index = get.current.track.index(),
    posTransform = NULL,
    col = NA,
    border = "black",
    lty = par("lty"),
    ...)
Arguments
| region | A data frame contains 2 column which correspond to start positions and end positions. |
|---|---|
| value | A data frame contains values and other information. |
| ytop | A vector or a single value indicating top position of rectangles. |
| ybottom | A vector or a single value indicating bottom position of rectangles. |
| ytop.column | If |
| ybottom.column | If |
| sector.index | Index of sector. |
| track.index | Index of track. |
| posTransform | Self-defined function to transform genomic positions, see |
| col | The length of |
| border | Settings are similar as |
| lty | Settings are similar as |
| ... | Mysterious parameters. |
Details
The function is a low-level graphical function and usually is put in panel.fun when using circos.genomicTrack.
The function behaviours differently from different formats of input, see the examples in the "Examples" Section or go to https://jokergoo.github.io/circlize_book/book/modes-of-input.html for more details.
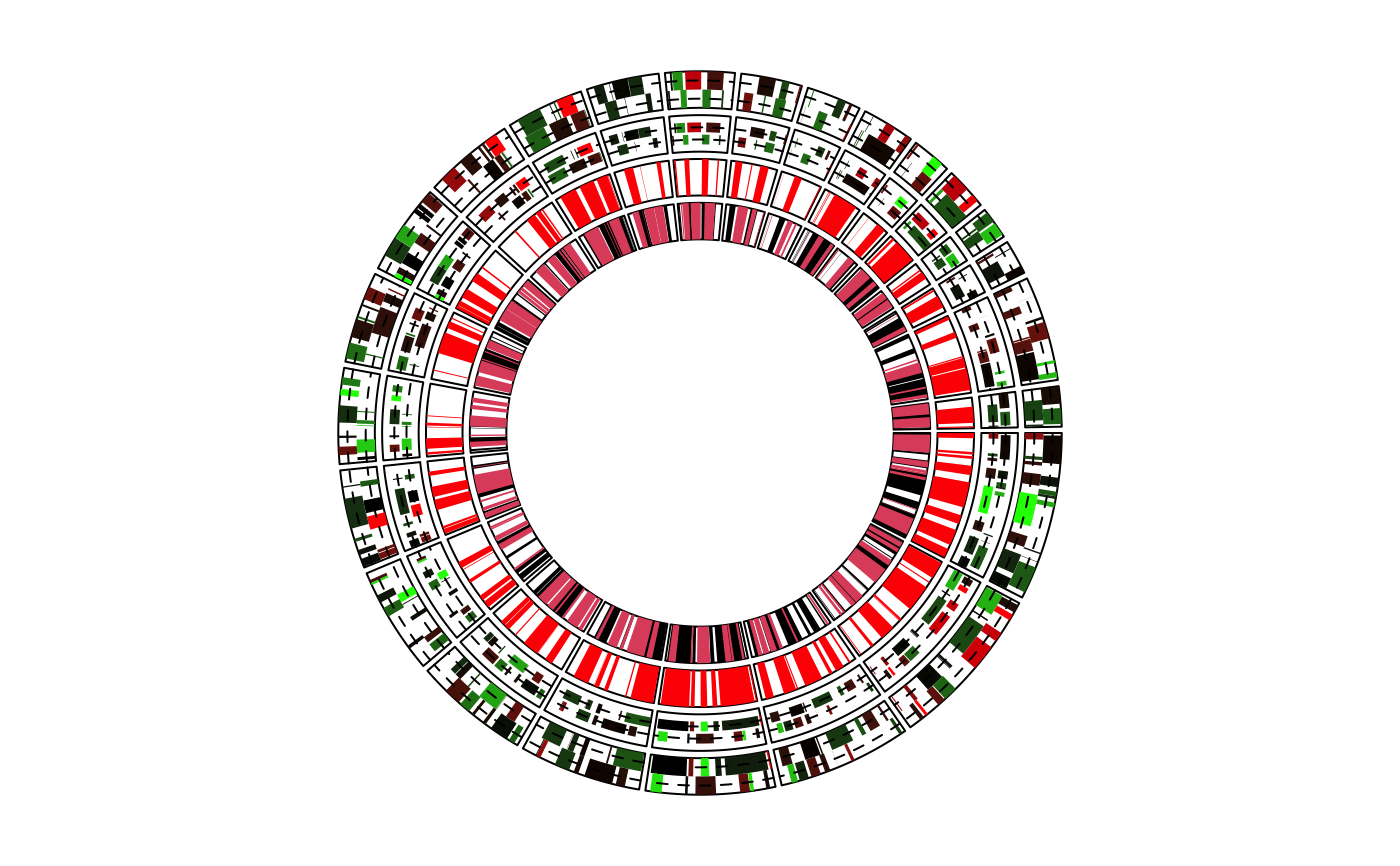
Examples
# \donttest{ circos.par("track.height" = 0.1, cell.padding = c(0, 0, 0, 0)) circos.initializeWithIdeogram(plotType = NULL)bed1 = generateRandomBed(nr = 100) bed2 = generateRandomBed(nr = 100) bed_list = list(bed1, bed2) f = colorRamp2(breaks = c(-1, 0, 1), colors = c("green", "black", "red")) circos.genomicTrack(bed_list, stack = TRUE, panel.fun = function(region, value, ...) { circos.genomicRect(region, value, col = f(value[[1]]), border = NA, ...) i = getI(...) cell.xlim = get.cell.meta.data("cell.xlim") circos.lines(cell.xlim, c(i, i), lty = 2, col = "#000000") })circos.genomicTrack(bed_list, ylim = c(0, 3), panel.fun = function(region, value, ...) { i = getI(...) circos.genomicRect(region, value, ytop = i+0.4, ybottom = i-0.4, col = f(value[[1]]), border = NA, ...) cell.xlim = get.cell.meta.data("cell.xlim") circos.lines(cell.xlim, c(i, i), lty = 2, col = "#000000") })circos.genomicTrack(bed1, panel.fun = function(region, value, ...) { circos.genomicRect(region, value, col = "red", border = NA, ...) })circos.genomicTrack(bed_list, panel.fun = function(region, value, ...) { i = getI(...) circos.genomicRect(region, value, col = i, border = NA, ...) })circos.clear() # }