Joyplot Annotation
anno_joyplot.RdJoyplot Annotation
anno_joyplot(x, which = c("column", "row"), gp = gpar(fill = "#000000"),
    scale = 2, transparency = 0.6,
    axis = TRUE, axis_param = default_axis_param(which),
    width = NULL, height = NULL)
Arguments
| x | A matrix or a list. If |
|---|---|
| which | Whether it is a column annotation or a row annotation? |
| gp | Graphic parameters for the boxes. The length of the graphic parameters should be one or the number of observations. |
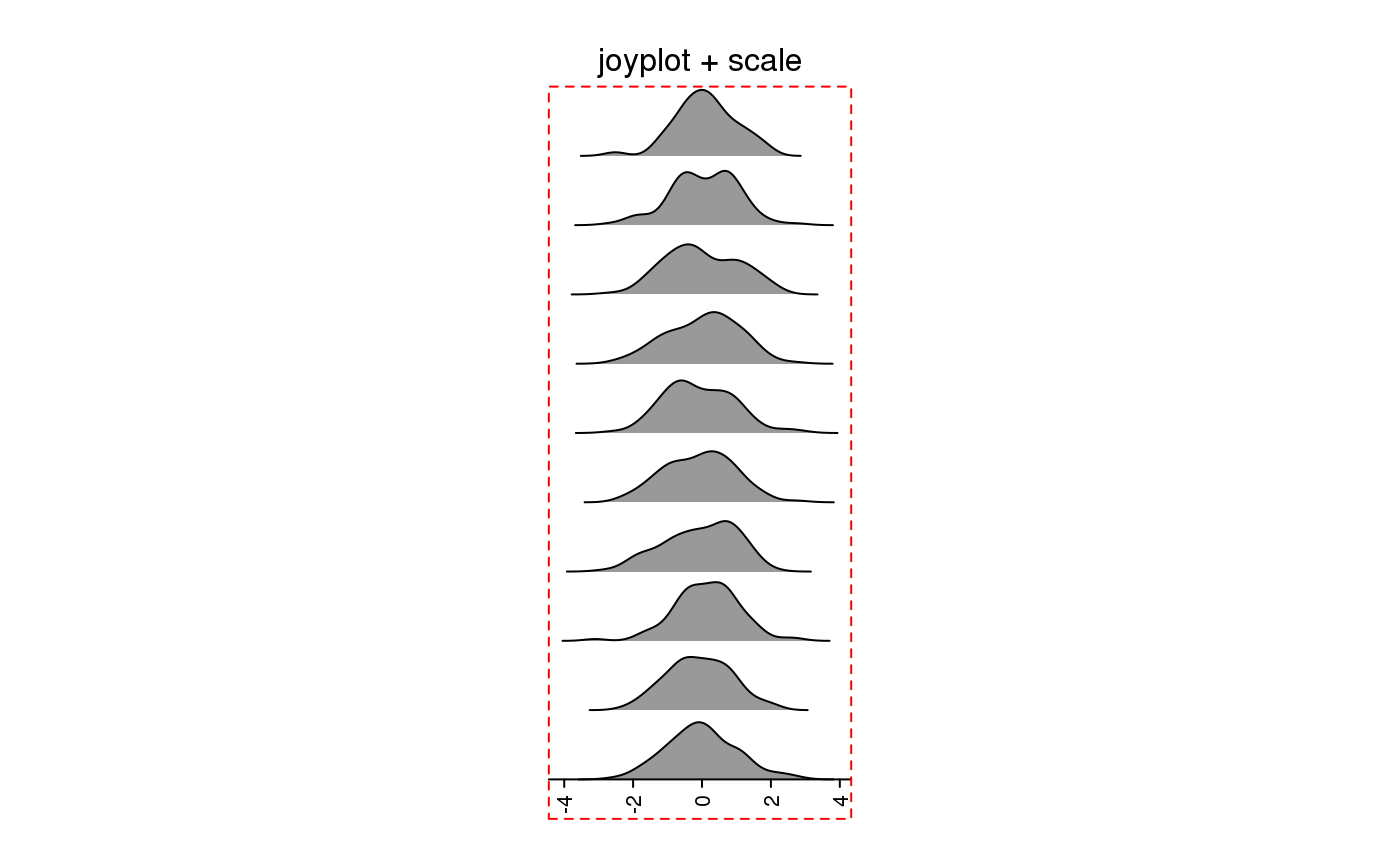
| scale | Relative height of the curve. A value higher than 1 increases the height of the curve. |
| transparency | Transparency of the filled colors. Value should be between 0 and 1. |
| axis | Whether to add axis? |
| axis_param | parameters for controlling axis. See |
| width | Width of the annotation. The value should be an absolute unit. Width is not allowed to be set for column annotation. |
| height | Height of the annotation. The value should be an absolute unit. Height is not allowed to be set for row annotation. |
Value
An annotation function which can be used in HeatmapAnnotation.
See also
https://jokergoo.github.io/ComplexHeatmap-reference/book/heatmap-annotations.html#joyplot-annotation
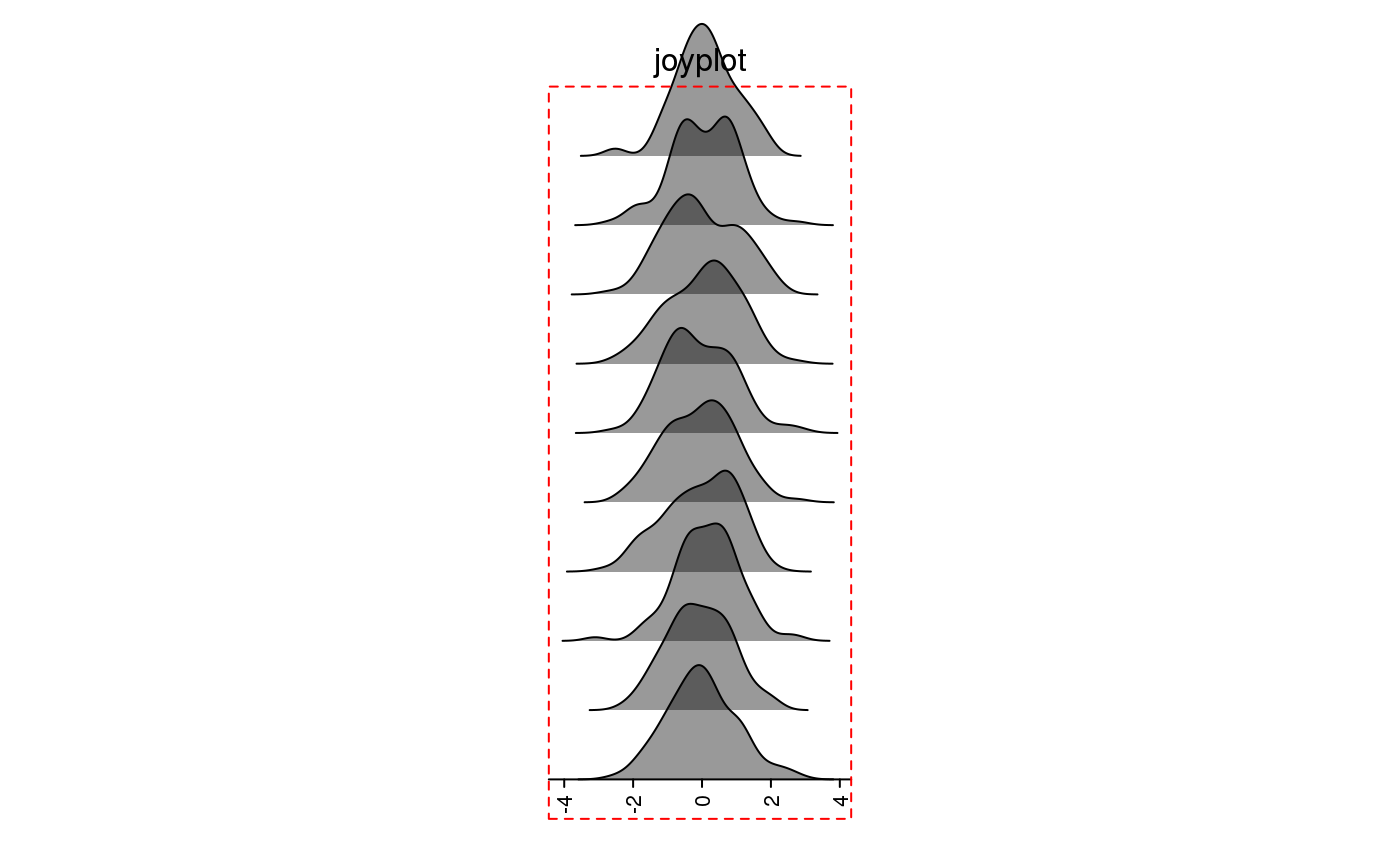
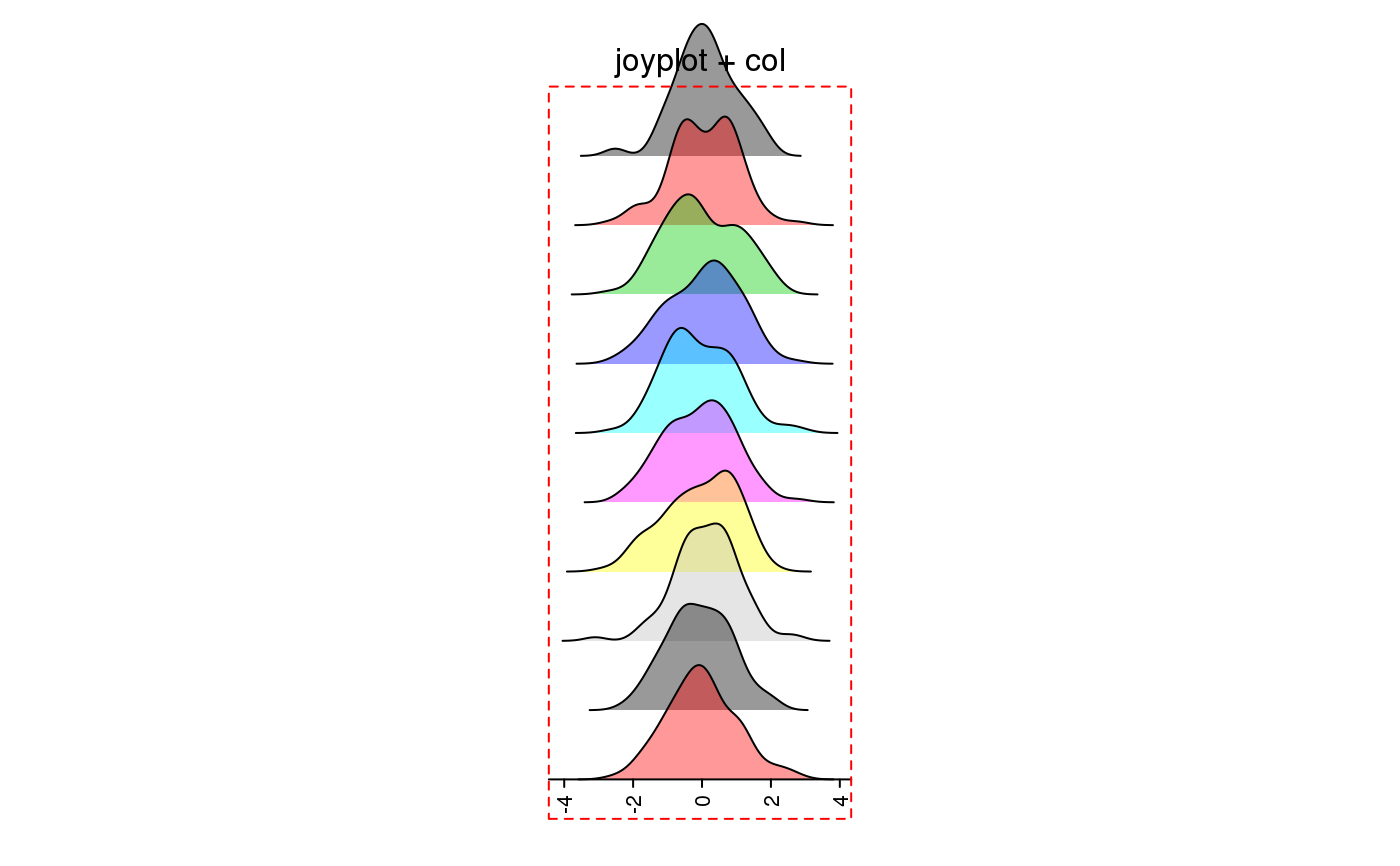
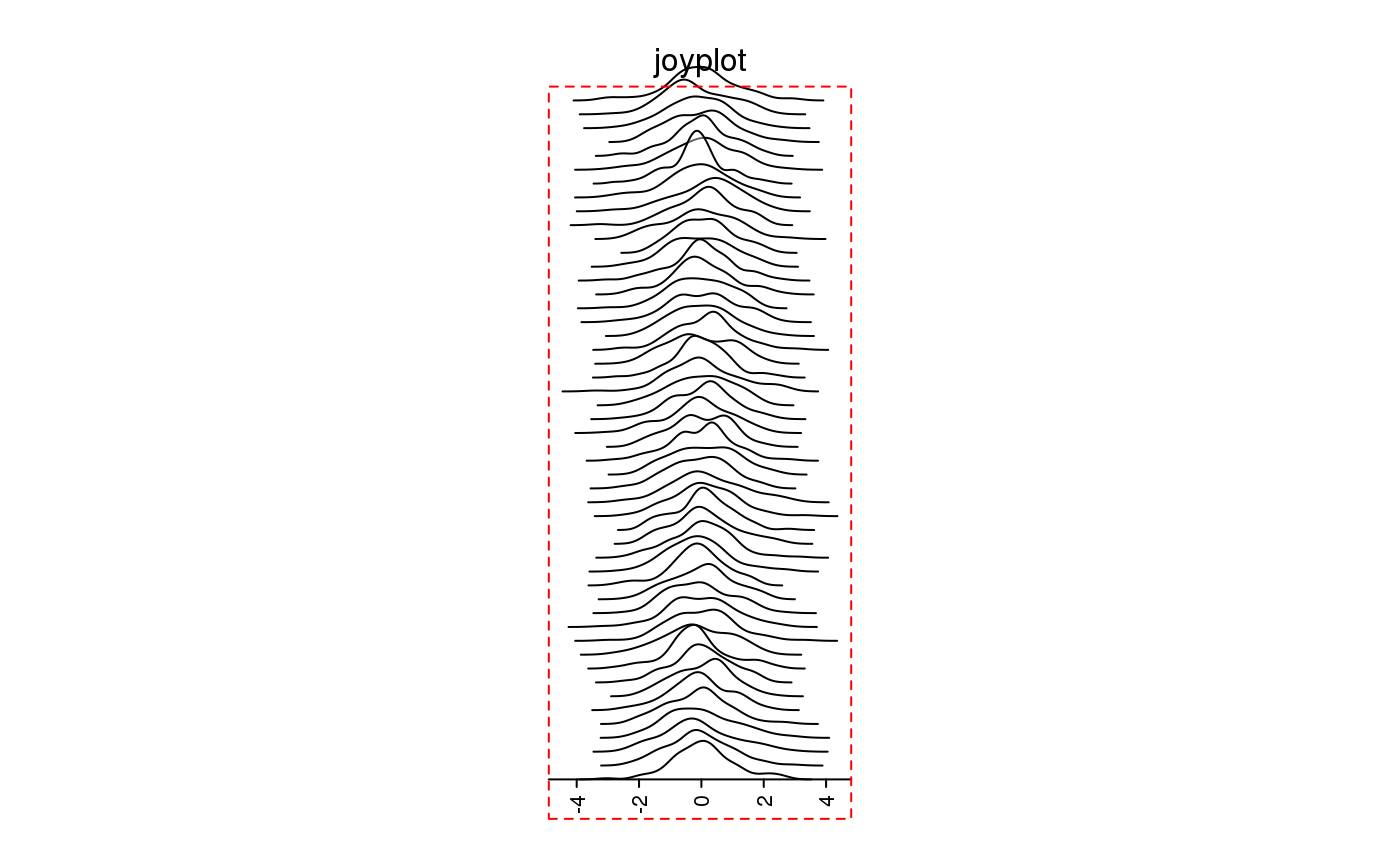
Examples
m = matrix(rnorm(1000), nc = 10) lt = apply(m, 2, function(x) data.frame(density(x)[c("x", "y")])) anno = anno_joyplot(lt, width = unit(4, "cm"), which = "row") draw(anno, test = "joyplot")anno = anno_joyplot(lt, width = unit(4, "cm"), which = "row", gp = gpar(fill = 1:10)) draw(anno, test = "joyplot + col")anno = anno_joyplot(lt, width = unit(4, "cm"), which = "row", scale = 1) draw(anno, test = "joyplot + scale")m = matrix(rnorm(5000), nc = 50) lt = apply(m, 2, function(x) data.frame(density(x)[c("x", "y")])) anno = anno_joyplot(lt, width = unit(4, "cm"), which = "row", gp = gpar(fill = NA), scale = 4) draw(anno, test = "joyplot")