Summary Annotation
anno_summary.RdSummary Annotation
anno_summary(which = c("column", "row"), border = TRUE, bar_width = 0.8,
    axis = TRUE, axis_param = default_axis_param(which),
    ylim = NULL, extend = 0.05, outline = TRUE, box_width = 0.6,
    pch = 1, size = unit(2, "mm"), gp = gpar(),
    width = NULL, height = NULL)
Arguments
| which | Whether it is a column annotation or a row annotation? |
|---|---|
| border | Wether draw borders of the annotation region? |
| bar_width | Relative width of the bars. The value should be smaller than one. |
| axis | Whether to add axis? |
| axis_param | parameters for controlling axis. See |
| ylim | Data ranges. |
| extend | The extension to both side of |
| outline | Whether draw outline of boxplots? |
| box_width | Relative width of boxes. The value should be smaller than one. |
| pch | Point style. |
| size | Point size. |
| gp | Graphic parameters. |
| width | Width of the annotation. The value should be an absolute unit. Width is not allowed to be set for column annotation. |
| height | Height of the annotation. The value should be an absolute unit. Height is not allowed to be set for row annotation. |
Details
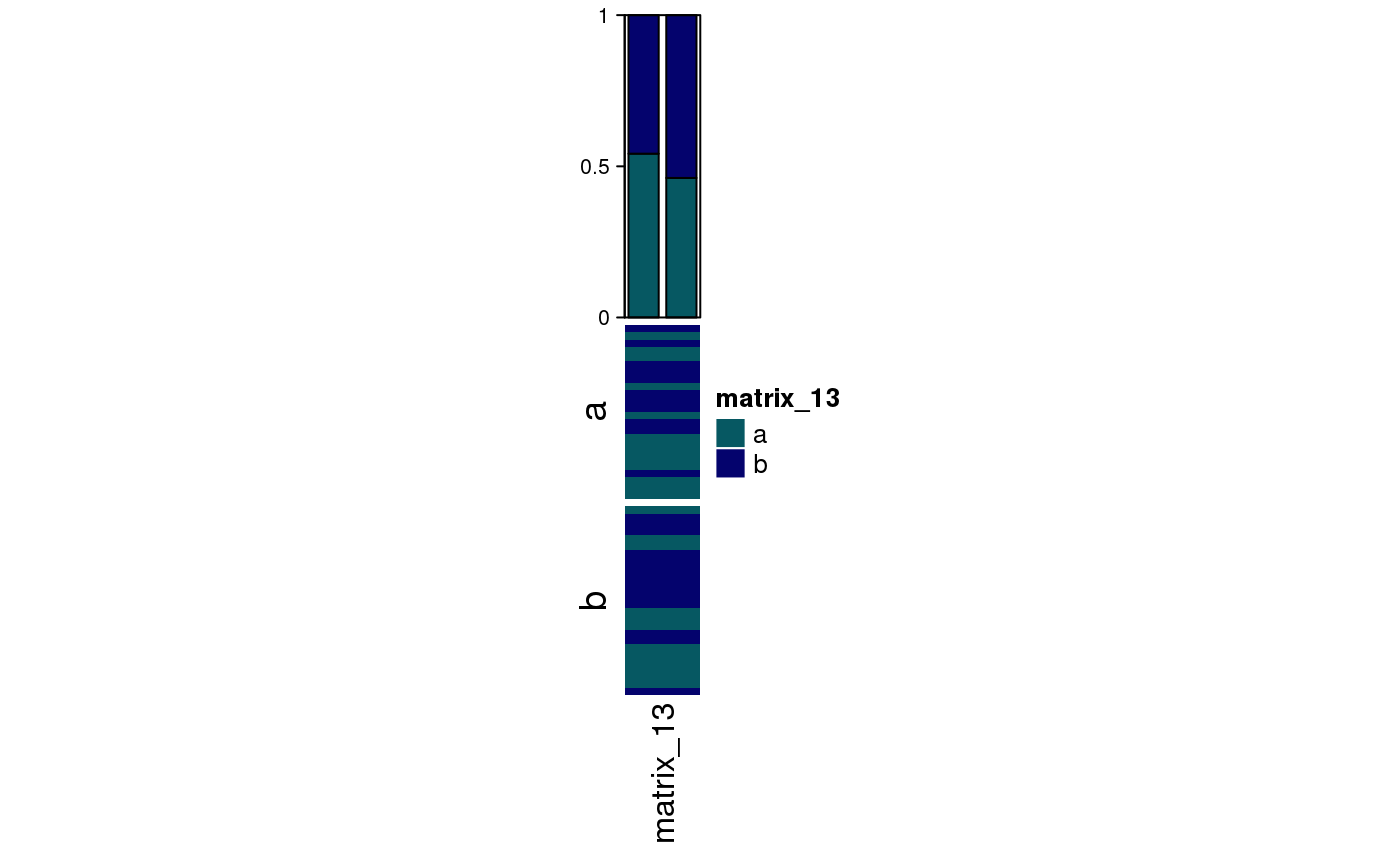
anno_summary is a special annotation function that it only works for one-column or one-row heatmap.
It shows the summary of the values in the heatmap. If the values in the heatmap is discrete,
the proportion of each level (the sum is normalized to 1) is visualized as stacked barplot. If the heatmap
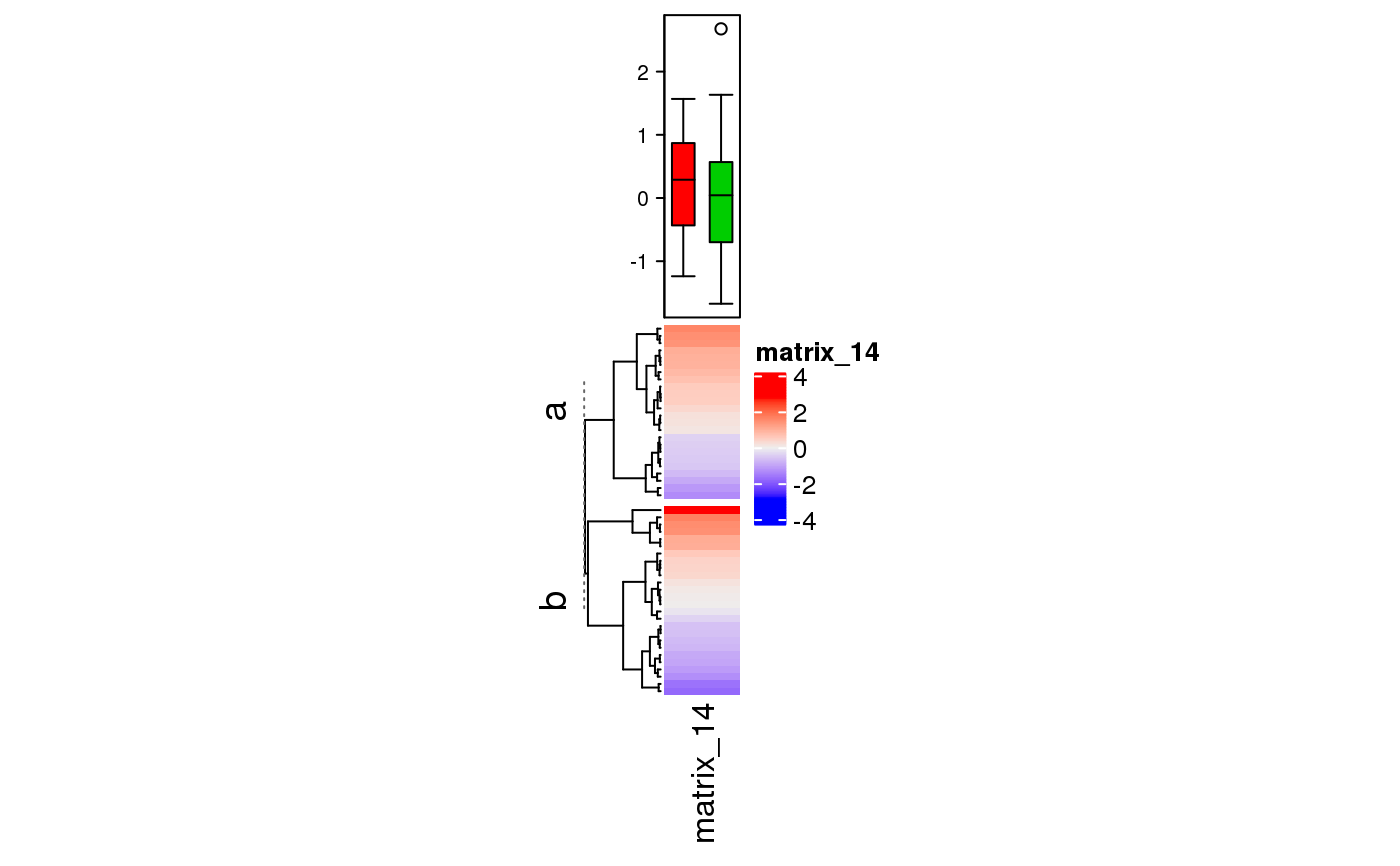
is split into multiple slices, multiple bars are put in the annotation. If the value is continuous, boxplot is used.
In the barplot, the color schema is used as the same as the heatmap, while for the boxplot, the color needs
to be controlled by gp.
Value
An annotation function which can be used in HeatmapAnnotation.
See also
https://jokergoo.github.io/ComplexHeatmap-reference/book/heatmap-annotations.html#summary-annotation
Examples
ha = HeatmapAnnotation(summary = anno_summary(height = unit(4, "cm"))) v = sample(letters[1:2], 50, replace = TRUE) split = sample(letters[1:2], 50, replace = TRUE) Heatmap(v, top_annotation = ha, width = unit(1, "cm"), split = split)ha = HeatmapAnnotation(summary = anno_summary(gp = gpar(fill = 2:3), height = unit(4, "cm"))) v = rnorm(50) Heatmap(v, top_annotation = ha, width = unit(1, "cm"), split = split)