Calculate and add genomic density track
circos.genomicDensity.RdCalculate and add genomic density track
circos.genomicDensity(
    data,
    ylim.force = FALSE,
    window.size = NULL,
    overlap = TRUE,
    count_by = c("percent", "number"),
    col = ifelse(area, "grey", "black"),
    lwd = par("lwd"),
    lty = par("lty"),
    type = "l",
    area = TRUE,
    area.baseline = NULL,
    baseline = 0,
    border = NA,
    ...)
Arguments
| data | A bed-file-like data frame or a list of data frames. If the input is a list of data frames. there will be multiple density plot in one same track. |
|---|---|
| ylim.force | Whether to force upper bound of |
| window.size | Pass to |
| overlap | Pass to |
| count_by | Pass to |
| col | Colors. It should be length of one. If |
| lwd | Width of lines, the same setting as |
| lty | Style of lines, the same setting as |
| type | Type of lines, see |
| area | See |
| area.baseline | Deprecated, use |
| baseline | See |
| border | See |
| ... | Pass to |
Details
This function is a high-level graphical function, and it will create a new track.
If you have multiple sets of genomic regions, you should make sure the density ranges
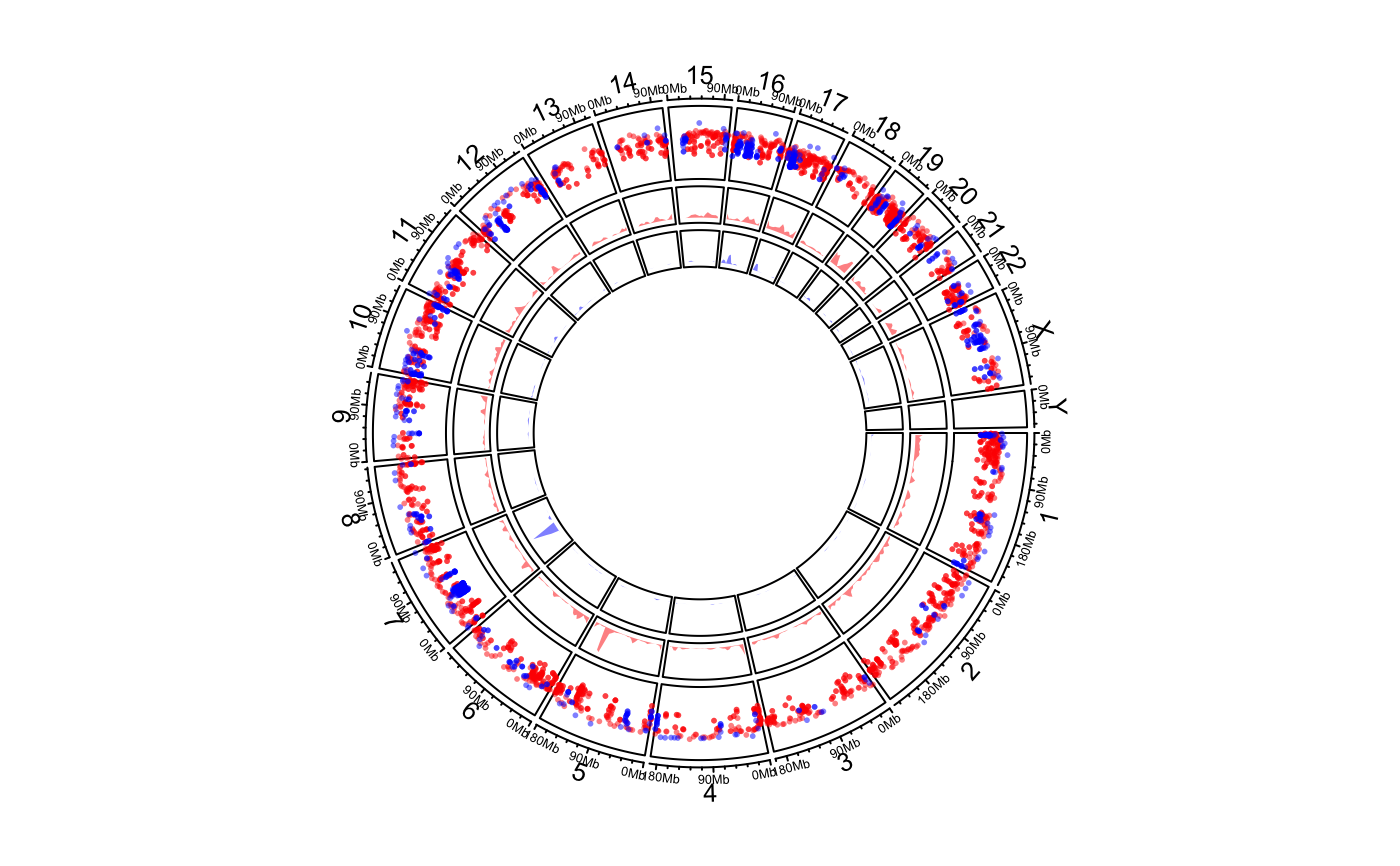
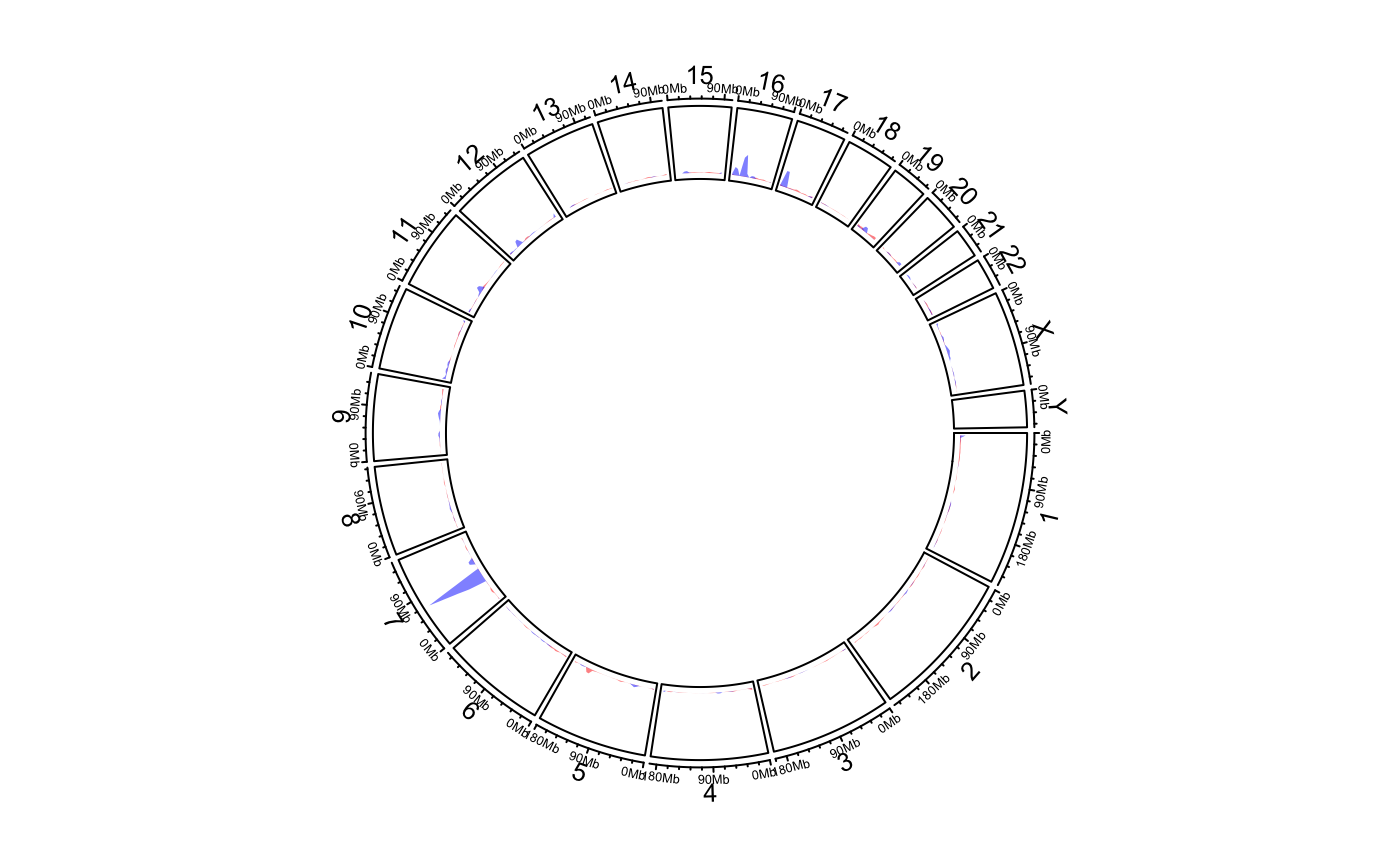
for all sets are similar, or I suggest you should put them into different tracks. One example
can be found in the "Examples" Section where the density range for bed_list[[2]] is too high
compared to the range for bed_list[[1]], thus, it is better to put the two sets of
regions into two separate tracks.
See also
Examples
load(system.file(package = "circlize", "extdata", "DMR.RData")) # rainfall # \donttest{ circos.initializeWithIdeogram(plotType = c("axis", "labels"))bed_list = list(DMR_hyper, DMR_hypo) circos.genomicRainfall(bed_list, pch = 16, cex = 0.4, col = c("#FF000080", "#0000FF80"))circos.clear() ############ draw the two densities in one track ############# circos.initializeWithIdeogram(plotType = c("axis", "labels"))circos.clear() # }