Draw polygon
circos.polygon.RdDraw polygon
circos.polygon(
    x, y,
    sector.index = get.current.sector.index(),
    track.index = get.current.track.index(),
    ...)
Arguments
| x | Data points on x-axis |
|---|---|
| y | Data points on y-axis |
| sector.index | Index for the sector |
| track.index | Index for the track |
| ... | pass to |
Details
similar as polygon.
Note: start point should overlap with the end point.
Examples
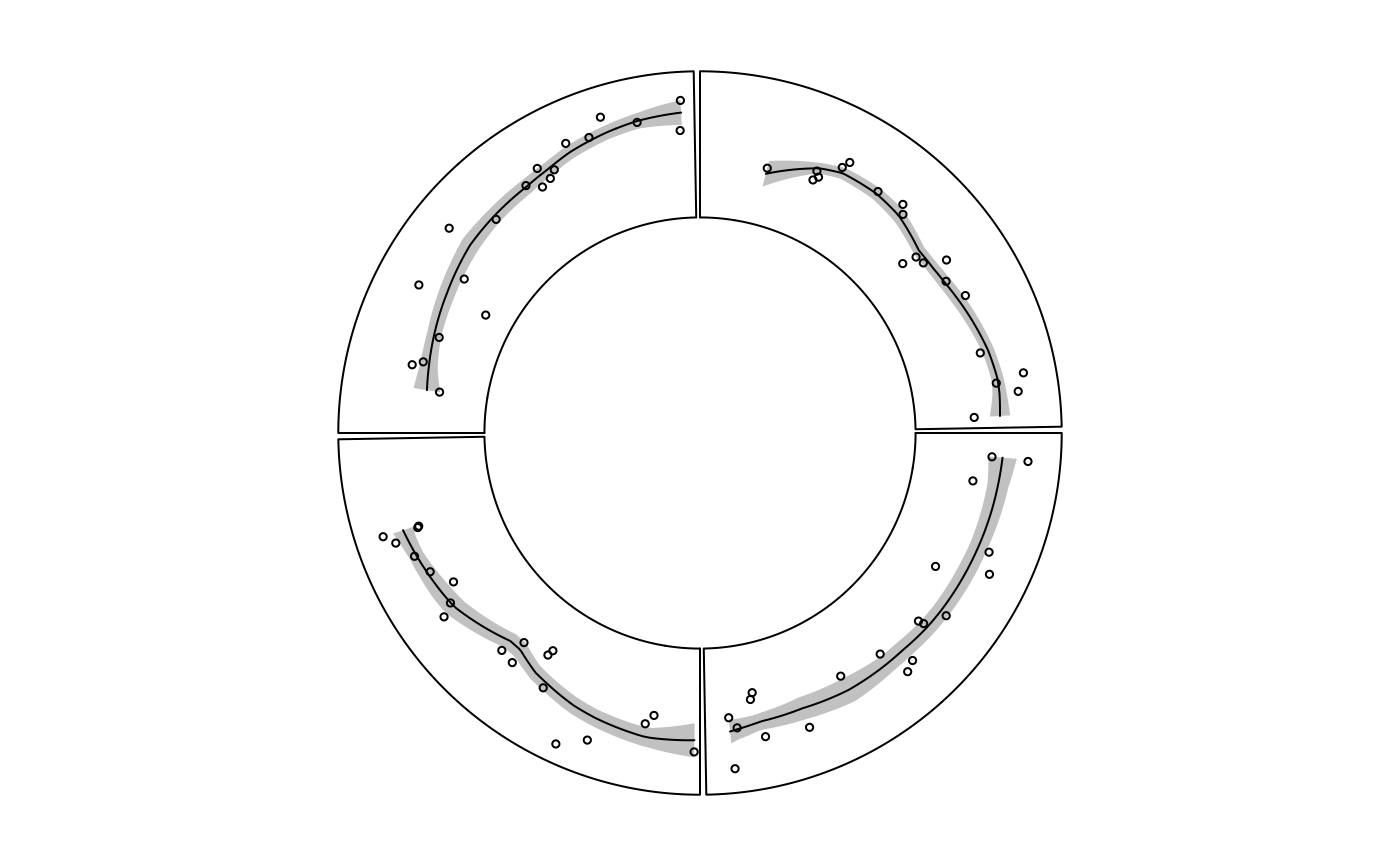
circos.trackPlotRegion(ylim = c(-3, 3), track.height = 0.4, panel.fun = function(x, y) { x1 = runif(20) y1 = x1 + rnorm(20) or = order(x1) x1 = x1[or] y1 = y1[or] loess.fit = loess(y1 ~ x1) loess.predict = predict(loess.fit, x1, se = TRUE) d1 = c(x1, rev(x1)) d2 = c(loess.predict$fit + loess.predict$se.fit, rev(loess.predict$fit - loess.predict$se.fit)) circos.polygon(d1, d2, col = "#CCCCCC", border = NA) circos.points(x1, y1, cex = 0.5) circos.lines(x1, loess.predict$fit) })