Draw and compare statistics for multiple methods
collect_stats-ConsensusPartitionList-method.RdDraw and compare statistics for multiple methods
# S4 method for ConsensusPartitionList
collect_stats(object, k, layout_nrow = 2, all_stats = FALSE, ...)
Arguments
- object
A
ConsensusPartitionList-classobject.- k
Number of subgroups.
- layout_nrow
Number of rows in the layout
- all_stats
Whether to show all statistics that were calculated. Used internally.
- ...
Other arguments
Details
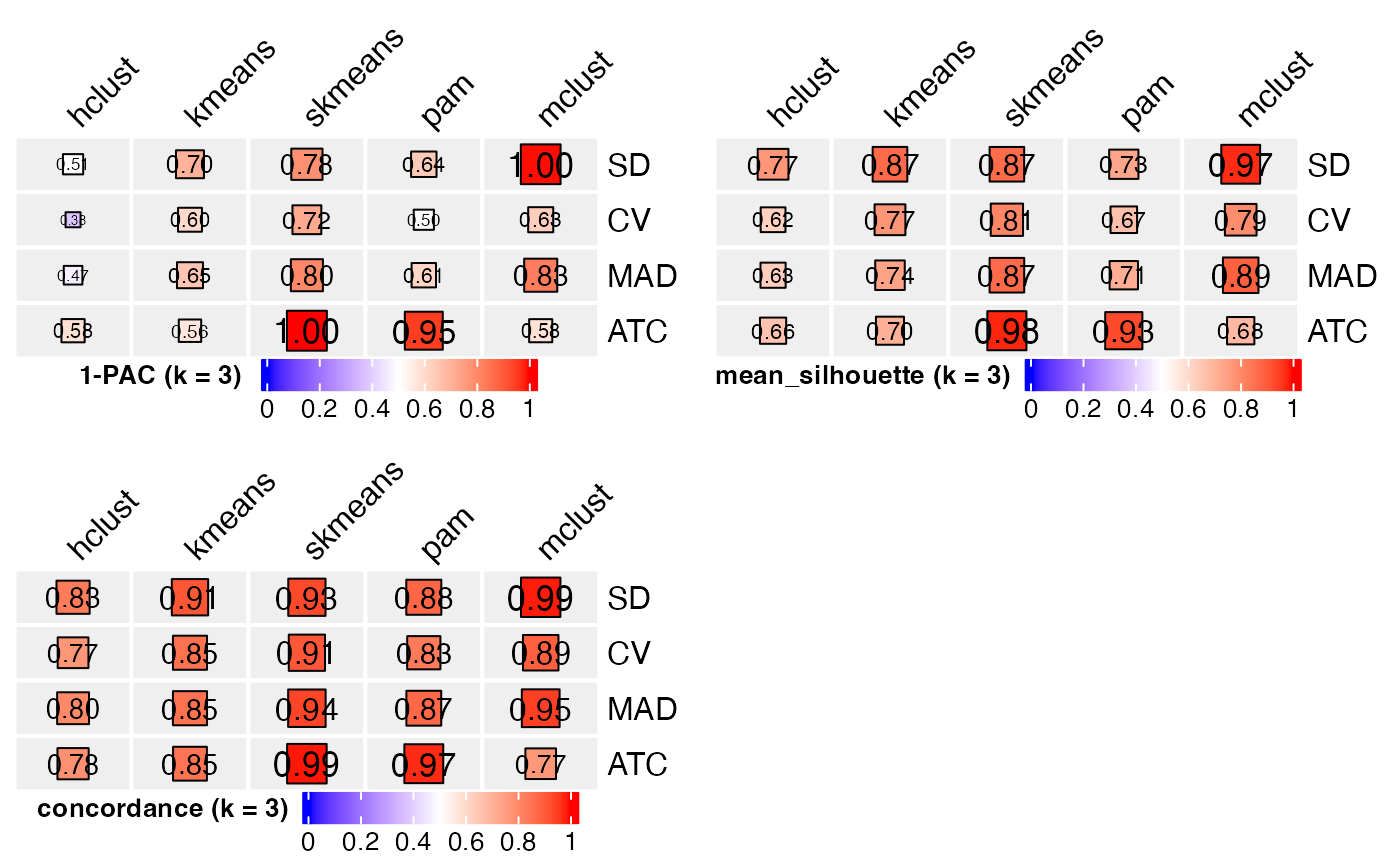
It draws heatmaps for statistics for multiple methods in parallel, so that users can compare which combination of methods gives the best results with given the number of subgroups.
Examples
data(golub_cola)
collect_stats(golub_cola, k = 3)
