Heatmap of the consensus matrix
consensus_heatmap-ConsensusPartition-method.RdHeatmap of the consensus matrix
# S4 method for ConsensusPartition
consensus_heatmap(object, k, internal = FALSE,
    anno = object@anno, anno_col = get_anno_col(object),
    show_row_names = FALSE, show_column_names = FALSE, row_names_gp = gpar(fontsize = 8),
    simplify = FALSE, ...)
Arguments
- object
A
ConsensusPartition-classobject.- k
Number of subgroups.
- internal
Used internally.
- anno
A data frame of annotations for the original matrix columns. By default it uses the annotations specified in
consensus_partitionorrun_all_consensus_partition_methods.- anno_col
A list of colors (color is defined as a named vector) for the annotations. If
annois a data frame,anno_colshould be a named list where names correspond to the column names inanno.- show_row_names
Whether plot row names on the consensus heatmap (which are the column names in the original matrix)
- show_column_names
Whether show column names.
- row_names_gp
Graphics parameters for row names.
- simplify
Internally used.
- ...
other arguments.
Details
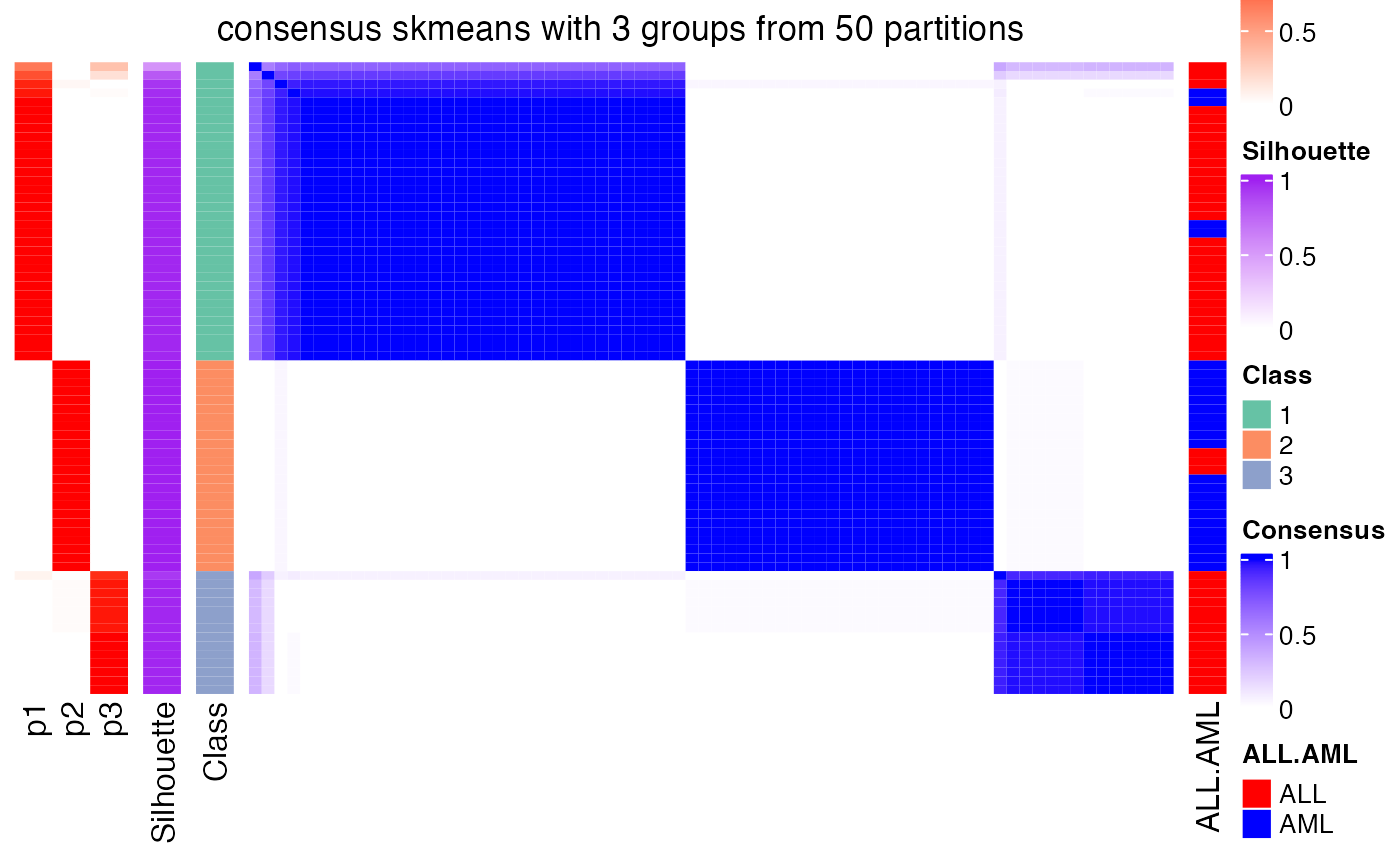
For row i and column j in the consensus matrix, the value of corresponding x_ij is the probability of sample i and sample j being in a same group from all partitions.
There are following heatmaps from left to right:
probability of the sample to stay in the corresponding group
silhouette scores which measure the distance of an item to the second closest subgroups.
predicted subgroups
consensus matrix.
more annotations if provided as
anno
One thing that is very important to note is that since we already know the consensus subgroups from consensus partition, in the heatmap, only rows or columns within the group is clustered.
Value
No value is returned.
Examples
data(golub_cola)
consensus_heatmap(golub_cola["ATC", "skmeans"], k = 3)