Visualize column after dimension reduction
dimension_reduction-DownSamplingConsensusPartition-method.RdVisualize samples (the matrix columns) after dimension reduction
# S4 method for DownSamplingConsensusPartition
dimension_reduction(object, k, top_n = NULL,
    method = c("PCA", "MDS", "t-SNE", "UMAP"),
    control = list(), color_by = NULL,
    internal = FALSE, nr = 5000,
    p_cutoff = 0.05, remove = FALSE,
    scale_rows = TRUE, verbose = TRUE, ...)
Arguments
- object
A
DownSamplingConsensusPartition-classobject.- k
Number of subgroups.
- top_n
Top n rows to use. By default it uses all rows in the original matrix.
- method
Which method to reduce the dimension of the data.
MDSusescmdscale,PCAusesprcomp.t-SNEusesRtsne.UMAPusesumap.- color_by
If annotation table is set, an annotation name can be set here.
- control
- internal
Internally used.
- nr
If number of matrix rows is larger than this value, random
nrrows are used.- p_cutoff
Cutoff of p-value of class label prediction. Data points with values higher than it will be mapped with cross symbols.
- remove
Whether to remove columns which have high p-values than the cutoff.
- scale_rows
Whether to perform scaling on matrix rows.
- verbose
Whether print messages.
- ...
Other arguments.
Details
This function is basically very similar as dimension_reduction,ConsensusPartition-method.
Value
No value is returned.
Examples
data(golub_cola_ds)
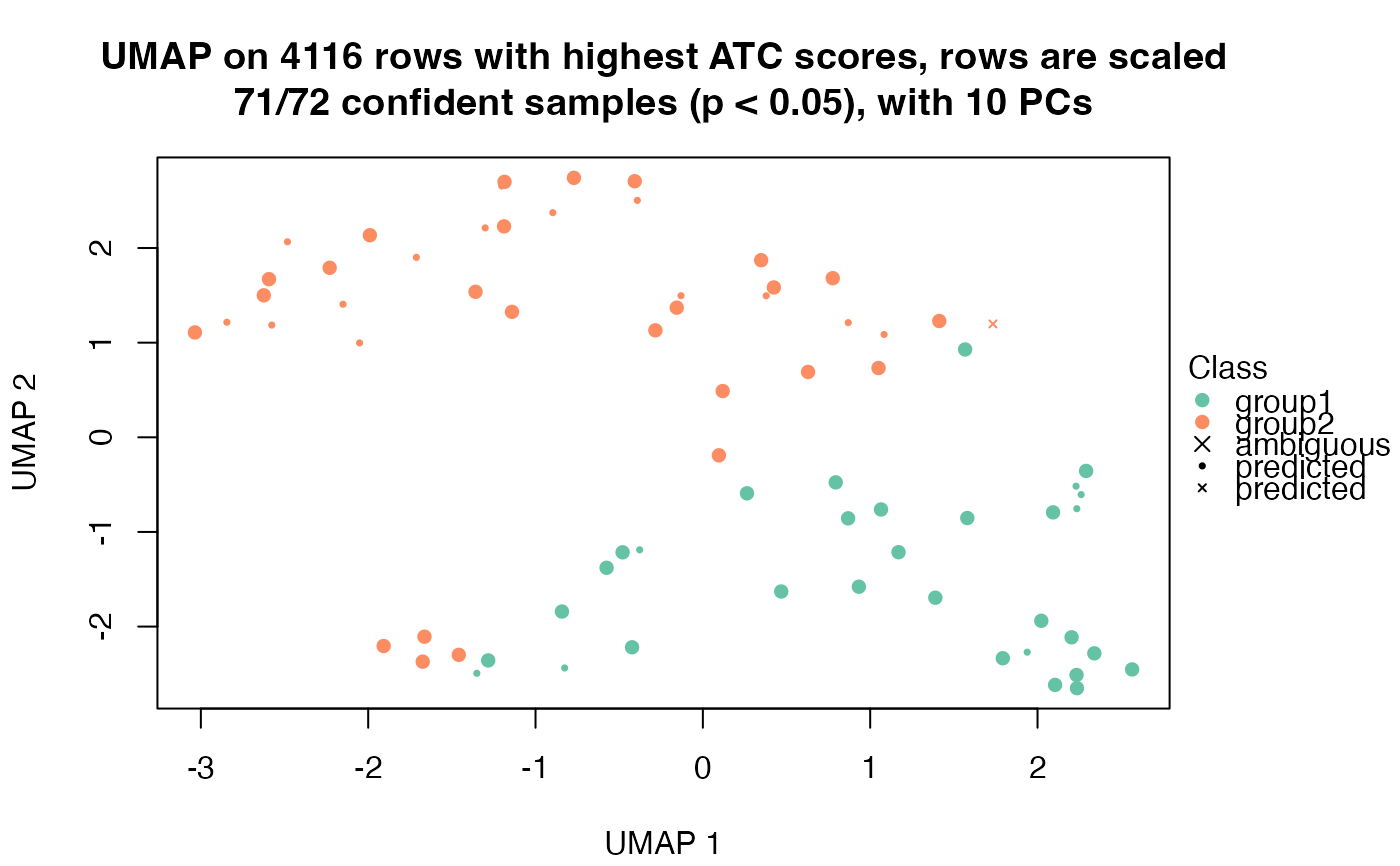
dimension_reduction(golub_cola_ds, k = 2)
#> use UMAP
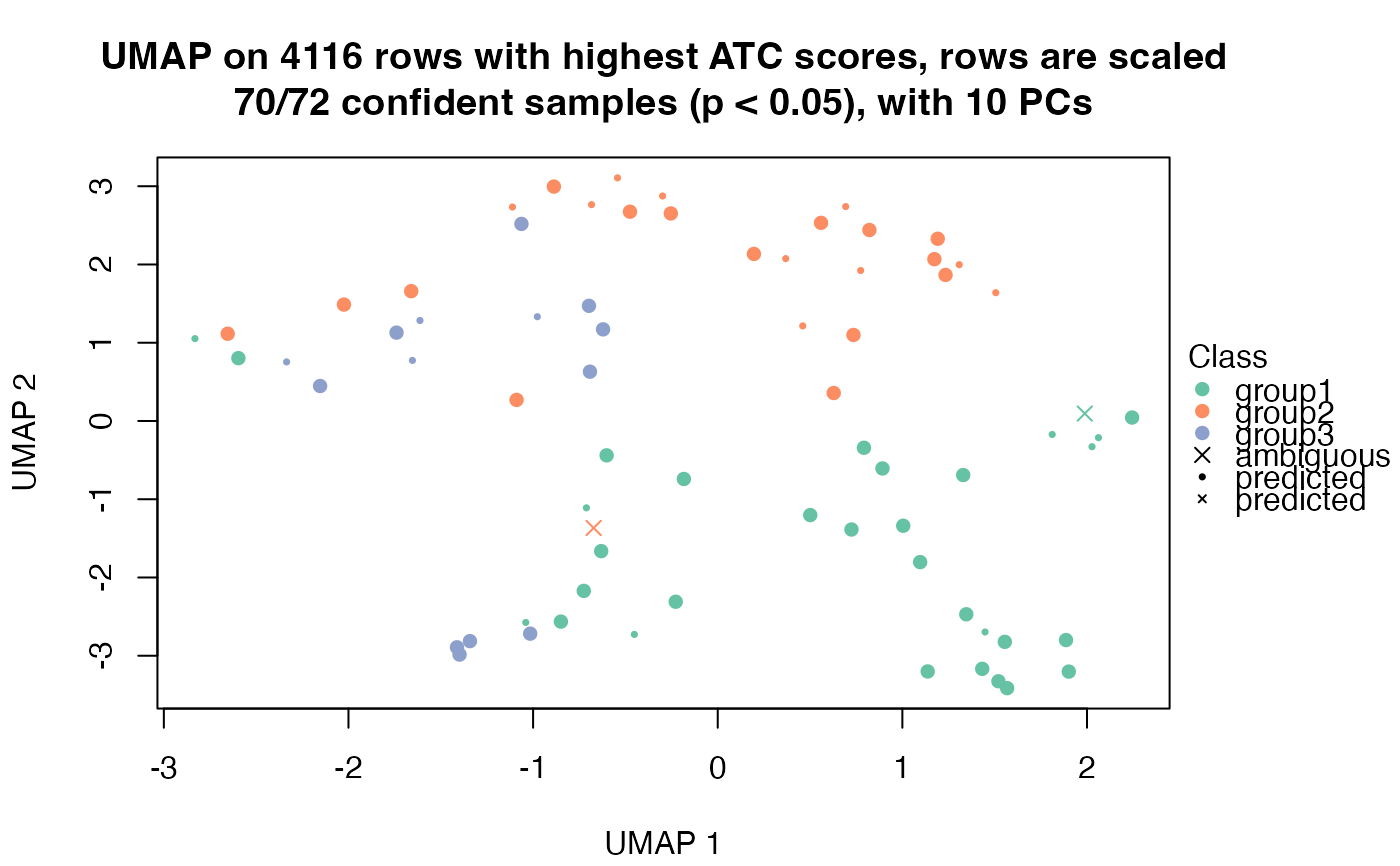
 dimension_reduction(golub_cola_ds, k = 3)
#> use UMAP
dimension_reduction(golub_cola_ds, k = 3)
#> use UMAP