Get signature rows
get_signatures-ConsensusPartition-method.RdGet signature rows
# S4 method for ConsensusPartition
get_signatures(object, k,
    col = if(scale_rows) c("green", "white", "red") else c("blue", "white", "red"),
    silhouette_cutoff = 0.5,
    fdr_cutoff = cola_opt$fdr_cutoff,
    top_signatures = NULL,
    group_diff = cola_opt$group_diff,
    scale_rows = object@scale_rows, .scale_mean = NULL, .scale_sd = NULL,
    row_km = NULL,
    diff_method = c("Ftest", "ttest", "samr", "pamr", "one_vs_others", "uniquely_high_in_one_group"),
    anno = get_anno(object),
    anno_col = get_anno_col(object),
    internal = FALSE,
    show_row_dend = FALSE,
    show_column_names = FALSE,
    column_names_gp = gpar(fontsize = 8),
    use_raster = TRUE,
    plot = TRUE, verbose = TRUE, seed = 888,
    left_annotation = NULL, right_annotation = NULL,
    simplify = FALSE, prefix = "", enforce = FALSE, hash = NULL, from_hc = FALSE,
    ...)
Arguments
- object
A
ConsensusPartition-classobject.- k
Number of subgroups.
- col
Colors for the main heatmap.
- silhouette_cutoff
Cutoff for silhouette scores. Samples with values less than it are not used for finding signature rows. For selecting a proper silhouette cutoff, please refer to https://www.stat.berkeley.edu/~s133/Cluster2a.html#tth_tAb1.
- fdr_cutoff
Cutoff for FDR of the difference test between subgroups.
- top_signatures
Top signatures with most significant fdr. Note since fdr might be same for multiple rows, the final number of signatures might not be exactly the same as the one that has been set.
- group_diff
Cutoff for the maximal difference between group means.
- scale_rows
Whether apply row scaling when making the heatmap.
- .scale_mean
Internally used.
- .scale_sd
Internally used.
- row_km
Number of groups for performing k-means clustering on rows. By default it is automatically selected.
- diff_method
Methods to get rows which are significantly different between subgroups, see 'Details' section.
- anno
A data frame of annotations for the original matrix columns. By default it uses the annotations specified in
consensus_partitionorrun_all_consensus_partition_methods.- anno_col
A list of colors (color is defined as a named vector) for the annotations. If
annois a data frame,anno_colshould be a named list where names correspond to the column names inanno.- internal
Used internally.
- show_row_dend
Whether show row dendrogram.
- show_column_names
Whether show column names in the heatmap.
- column_names_gp
Graphics parameters for column names.
- use_raster
Internally used.
- plot
Whether to make the plot.
- verbose
Whether to print messages.
- seed
Random seed.
- left_annotation
Annotation put on the left of the heatmap. It should be a
HeatmapAnnotation-classobject. The number of items should be the same as the number of the original matrix rows. The subsetting to the significant rows are automatically performed on the annotation object.- right_annotation
Annotation put on the right of the heatmap. Same format as
left_annotation.- simplify
Only used internally.
- prefix
Only used internally.
- enforce
The analysis is cached by default, so that the analysis with the same input will be automatically extracted without rerunning them. Set
enforcetoTRUEto enforce the funtion to re-perform the analysis.- hash
Userd internally.
- from_hc
Is the
ConsensusPartition-classobject a node of aHierarchicalPartitionobject?- ...
Other arguments.
Details
Basically the function applies statistical test for the difference in subgroups for every row. There are following methods which test significance of the difference:
- ttest
First it looks for the subgroup with highest mean value, compare to each of the other subgroups with t-test and take the maximum p-value. Second it looks for the subgroup with lowest mean value, compare to each of the other subgroups again with t-test and take the maximum p-values. Later for these two list of p-values take the minimal p-value as the final p-value.
- samr/pamr
use SAM (from samr package)/PAM (from pamr package) method to find significantly different rows between subgroups.
- Ftest
use F-test to find significantly different rows between subgroups.
- one_vs_others
For each subgroup i in each row, it uses t-test to compare samples in current subgroup to all other samples, denoted as p_i. The p-value for current row is selected as min(p_i).
- uniquely_high_in_one_group
The signatures are defined as, if they are uniquely up-regulated in subgroup A, then it must fit following criterions: 1. in a two-group t-test of A ~ other_merged_groups, the statistic must be > 0 (high in group A) and p-value must be significant, and 2. for other groups (excluding A), t-test in every pair of groups should not be significant.
diff_method can also be a self-defined function. The function needs two arguments which are the matrix for the analysis
and the predicted classes. The function should returns a vector of FDR from the difference test.
Value
A data frame with more than two columns:
which_row:row index corresponding to the original matrix.
fdr:the FDR.
km:the k-means groups if
row_kmis set.- other_columns:
the mean value (depending rows are scaled or not) in each subgroup.
Examples
data(golub_cola)
res = golub_cola["ATC", "skmeans"]
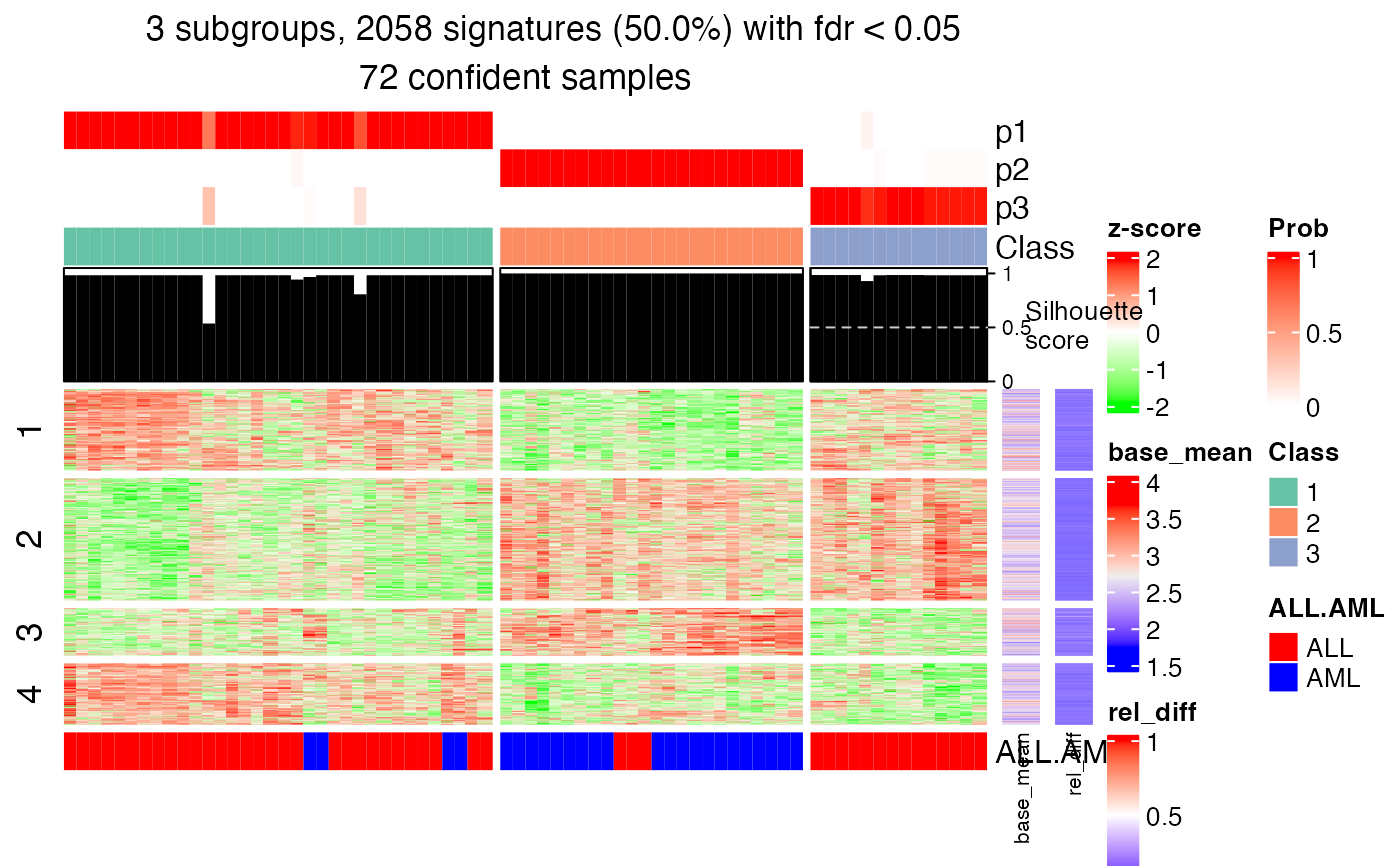
tb = get_signatures(res, k = 3)
#> * 72/72 samples (in 3 classes) remain after filtering by silhouette (>= 0.5).
#> * cache hash: 87c63a8cabc898f97a024514962787f7 (seed 888).
#> * calculating row difference between subgroups by Ftest.
#> * split rows into 4 groups by k-means clustering.
#> * 2058 signatures (50.0%) under fdr < 0.05, group_diff > 0.
#> - randomly sample 2000 signatures.
#> * making heatmaps for signatures.
 head(tb)
#> which_row fdr p_value mean_1 mean_2 mean_3 group_diff
#> 1 2 0.0005480204 0.000102654 1.747716 2.081334 2.004512 0.3336177
#> 2 3 0.0114427741 0.004095045 2.182303 2.251489 2.397769 0.2154661
#> 3 11 0.0035593360 0.001009916 2.342387 2.529442 2.380858 0.1870552
#> 4 12 0.0143153879 0.005335230 2.384353 2.549453 2.301059 0.2483942
#> 5 13 0.0201369424 0.008253407 2.737212 2.840578 3.423688 0.6864764
#> 6 14 0.0157851334 0.006036395 3.244110 3.371635 3.638171 0.3940607
#> scaled_mean_1 scaled_mean_2 scaled_mean_3 group_diff_scaled km
#> 1 -0.4997955 0.53497043 0.2966968 1.0347659 2
#> 2 -0.3093980 0.02013769 0.7168734 1.0262713 2
#> 3 -0.3509730 0.58915719 -0.1576207 0.9401302 3
#> 4 -0.1531394 0.49786781 -0.4815776 0.9794454 3
#> 5 -0.2321462 -0.08925855 0.7167982 0.9489443 2
#> 6 -0.2998939 0.02113042 0.6920903 0.9919842 2
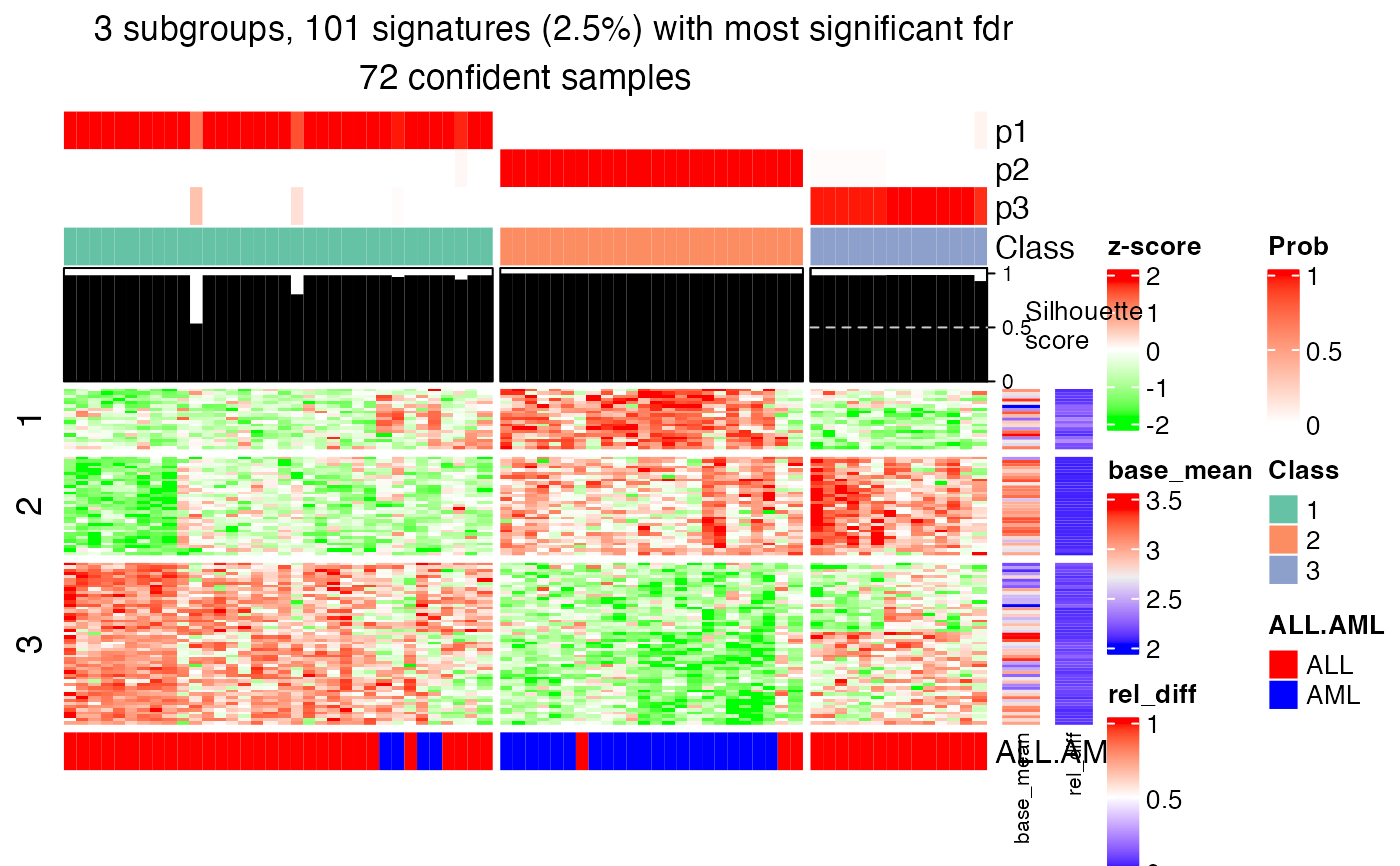
get_signatures(res, k = 3, top_signatures = 100)
#> * 72/72 samples (in 3 classes) remain after filtering by silhouette (>= 0.5).
#> * cache hash: 9e0a60297e9e338085d22adb55750347 (seed 888).
#> * calculating row difference between subgroups by Ftest.
#> * split rows into 3 groups by k-means clustering.
#> * 101 signatures (2.5%) with most significant fdr, group_diff > 0.
#> * making heatmaps for signatures.
head(tb)
#> which_row fdr p_value mean_1 mean_2 mean_3 group_diff
#> 1 2 0.0005480204 0.000102654 1.747716 2.081334 2.004512 0.3336177
#> 2 3 0.0114427741 0.004095045 2.182303 2.251489 2.397769 0.2154661
#> 3 11 0.0035593360 0.001009916 2.342387 2.529442 2.380858 0.1870552
#> 4 12 0.0143153879 0.005335230 2.384353 2.549453 2.301059 0.2483942
#> 5 13 0.0201369424 0.008253407 2.737212 2.840578 3.423688 0.6864764
#> 6 14 0.0157851334 0.006036395 3.244110 3.371635 3.638171 0.3940607
#> scaled_mean_1 scaled_mean_2 scaled_mean_3 group_diff_scaled km
#> 1 -0.4997955 0.53497043 0.2966968 1.0347659 2
#> 2 -0.3093980 0.02013769 0.7168734 1.0262713 2
#> 3 -0.3509730 0.58915719 -0.1576207 0.9401302 3
#> 4 -0.1531394 0.49786781 -0.4815776 0.9794454 3
#> 5 -0.2321462 -0.08925855 0.7167982 0.9489443 2
#> 6 -0.2998939 0.02113042 0.6920903 0.9919842 2
get_signatures(res, k = 3, top_signatures = 100)
#> * 72/72 samples (in 3 classes) remain after filtering by silhouette (>= 0.5).
#> * cache hash: 9e0a60297e9e338085d22adb55750347 (seed 888).
#> * calculating row difference between subgroups by Ftest.
#> * split rows into 3 groups by k-means clustering.
#> * 101 signatures (2.5%) with most significant fdr, group_diff > 0.
#> * making heatmaps for signatures.