Several plots for determining the optimized number of subgroups
select_partition_number-ConsensusPartition-method.RdSeveral plots for determining the optimized number of subgroups
# S4 method for ConsensusPartition
select_partition_number(object, mark_best = TRUE, all_stats = FALSE)
Arguments
- object
A
ConsensusPartition-classobject.- mark_best
Whether mark the best k in the plot.
- all_stats
Whether to show all statistics that were calculated. Used internally.
Details
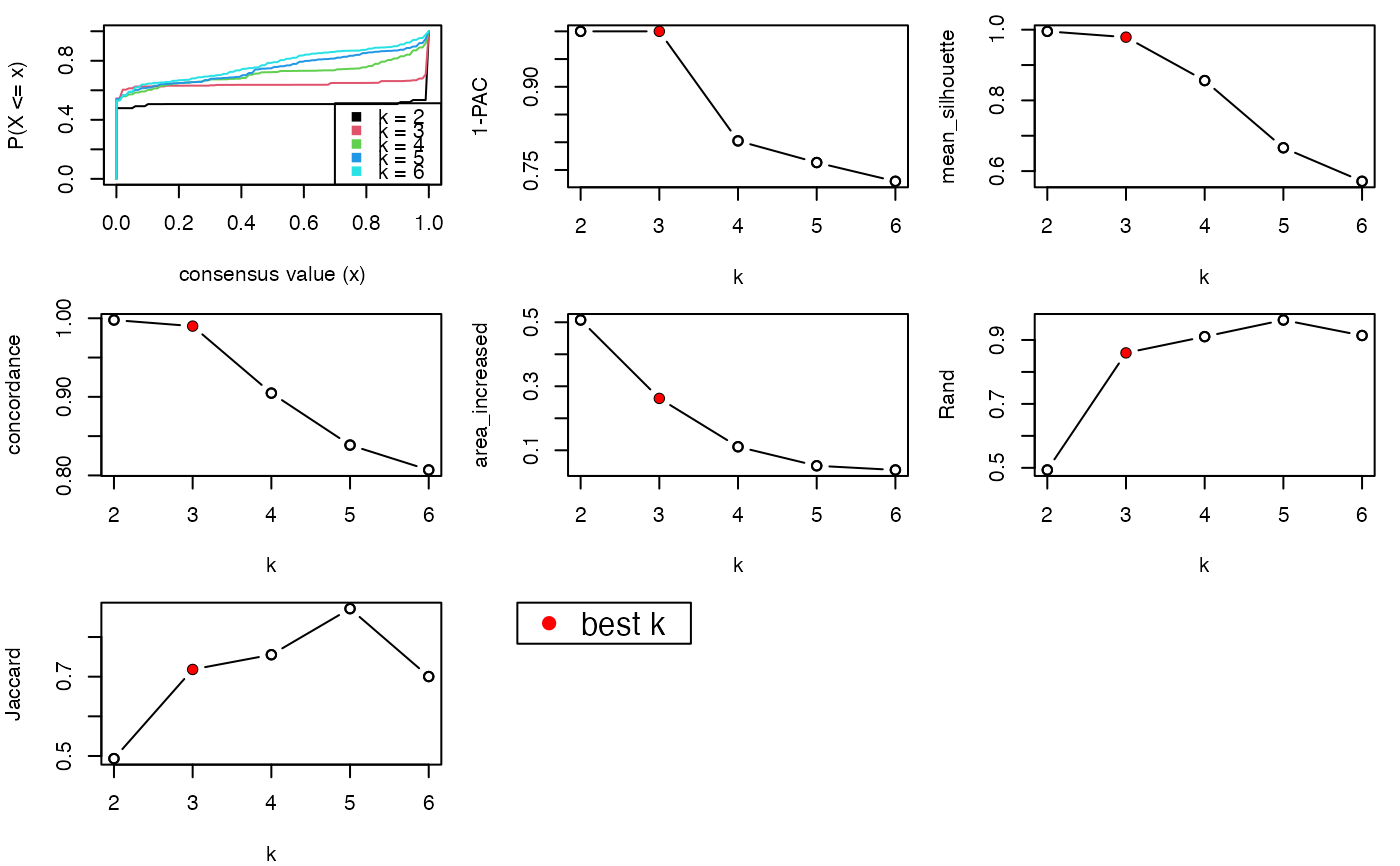
There are following plots made:
eCDF of the consensus matrix under each k, made by
plot_ecdf,ConsensusPartition-method,PACscore,mean sihouette score,
the
concordancefor each partition to the consensus partition,area increase of the area under the ECDF of consensus matrix with increasing k,
Rand index for current k compared to k - 1,
Jaccard coefficient for current k compared to k - 1,
Value
No value is returned.
Examples
data(golub_cola)
select_partition_number(golub_cola["ATC", "skmeans"])