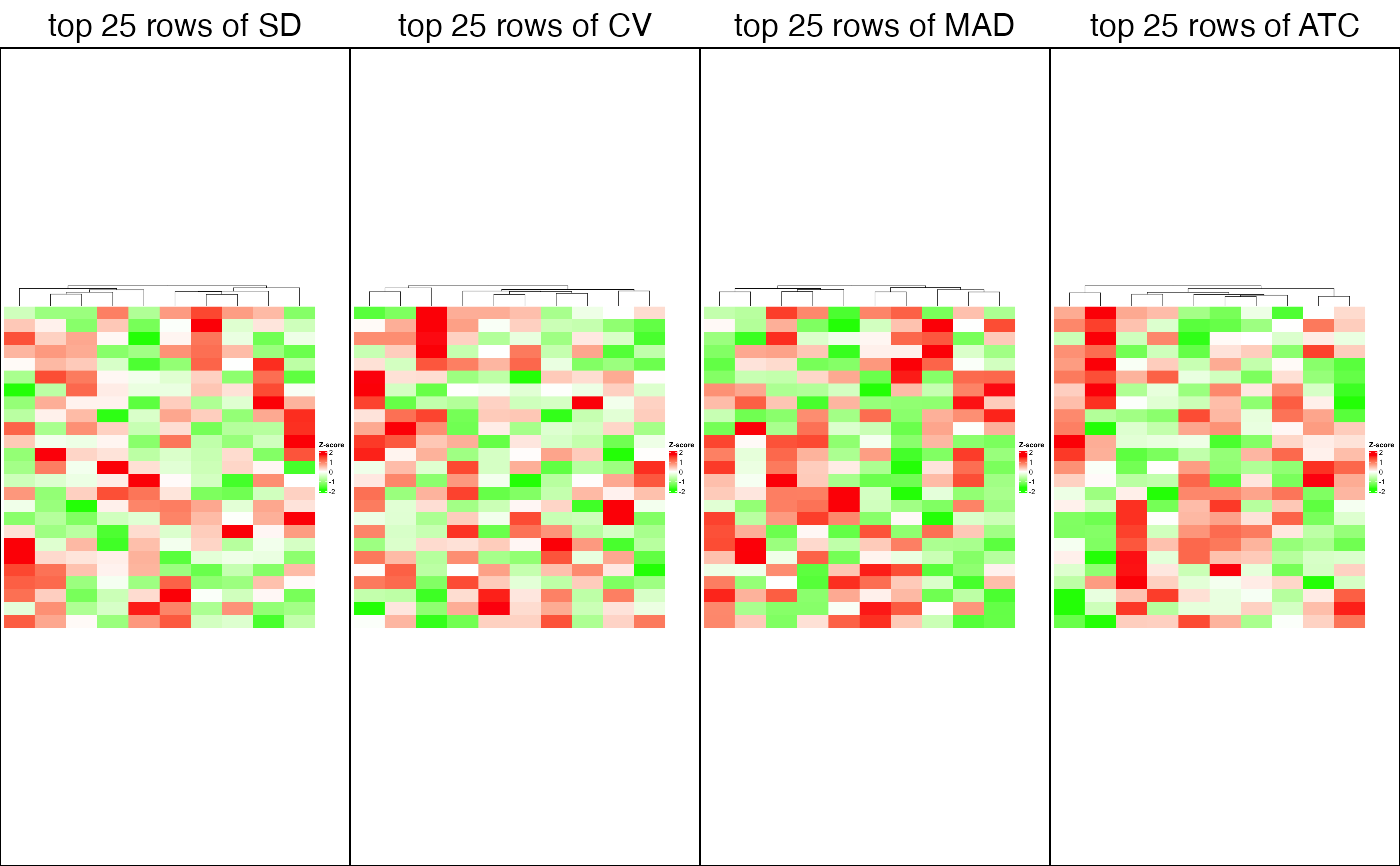
Heatmap of top rows from different top-value methods
top_rows_heatmap-matrix-method.RdHeatmap of top rows from different top-value methods
# S4 method for matrix
top_rows_heatmap(object, all_top_value_list = NULL,
    top_value_method = all_top_value_methods(),
    bottom_annotation = NULL,
    top_n = round(0.25*nrow(object)), scale_rows = TRUE, ...)
Arguments
- object
A numeric matrix.
- all_top_value_list
Top-values that have already been calculated from the matrix. If it is
NULLthe values are calculated by methods intop_value_methodargument.- top_value_method
Methods defined in
all_top_value_methods.- bottom_annotation
A
HeatmapAnnotation-classobject.- top_n
Number of top rows to show in the heatmap.
- scale_rows
Whether to scale rows.
- ...
Pass to
Heatmap.
Details
The function makes heatmaps where the rows are scaled (or not scaled) for the top n rows from different top-value methods.
The top n rows are used for subgroup classification in cola analysis, so the heatmaps show which top-value method gives better candidate rows for the classification.
Value
No value is returned.
Examples
set.seed(123)
mat = matrix(rnorm(1000), nrow = 100)
top_rows_heatmap(mat, top_n = 25)