Visualize git commits
Arguments
- repo
Path of the git repo. The value can be a single repo or a vector of repos.
- show_legend
Whether to show the legend.
- start
Start date. By default it is the first date of the commit. The value can be a string such as "2022-01-01" or a
base::Dateobject.- end
End date. By default it is the current date. The value can be a string such as "2022-01-01" or a
base::Dateobject.- pt_range
Range of the point sizes. The default is between 1 and the 90 percentile of daily commits.
- commits_range
Range of the numbers of commits.
- type
Type of the plot.
- colors
If type is the heatmap, it controls the list of colors.
Examples
# \dontrun{
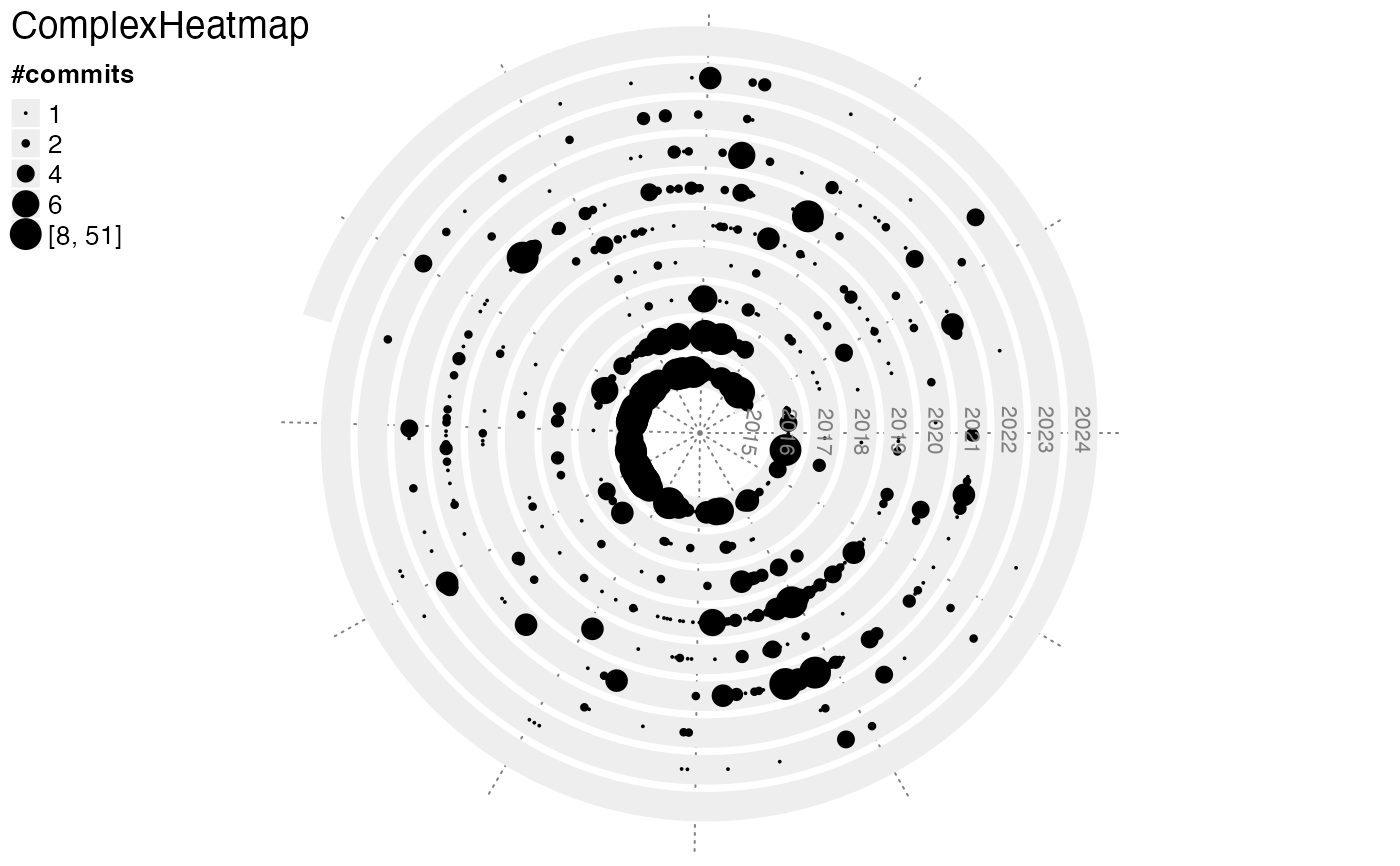
spiral_git_commits("~/project/development/ComplexHeatmap")
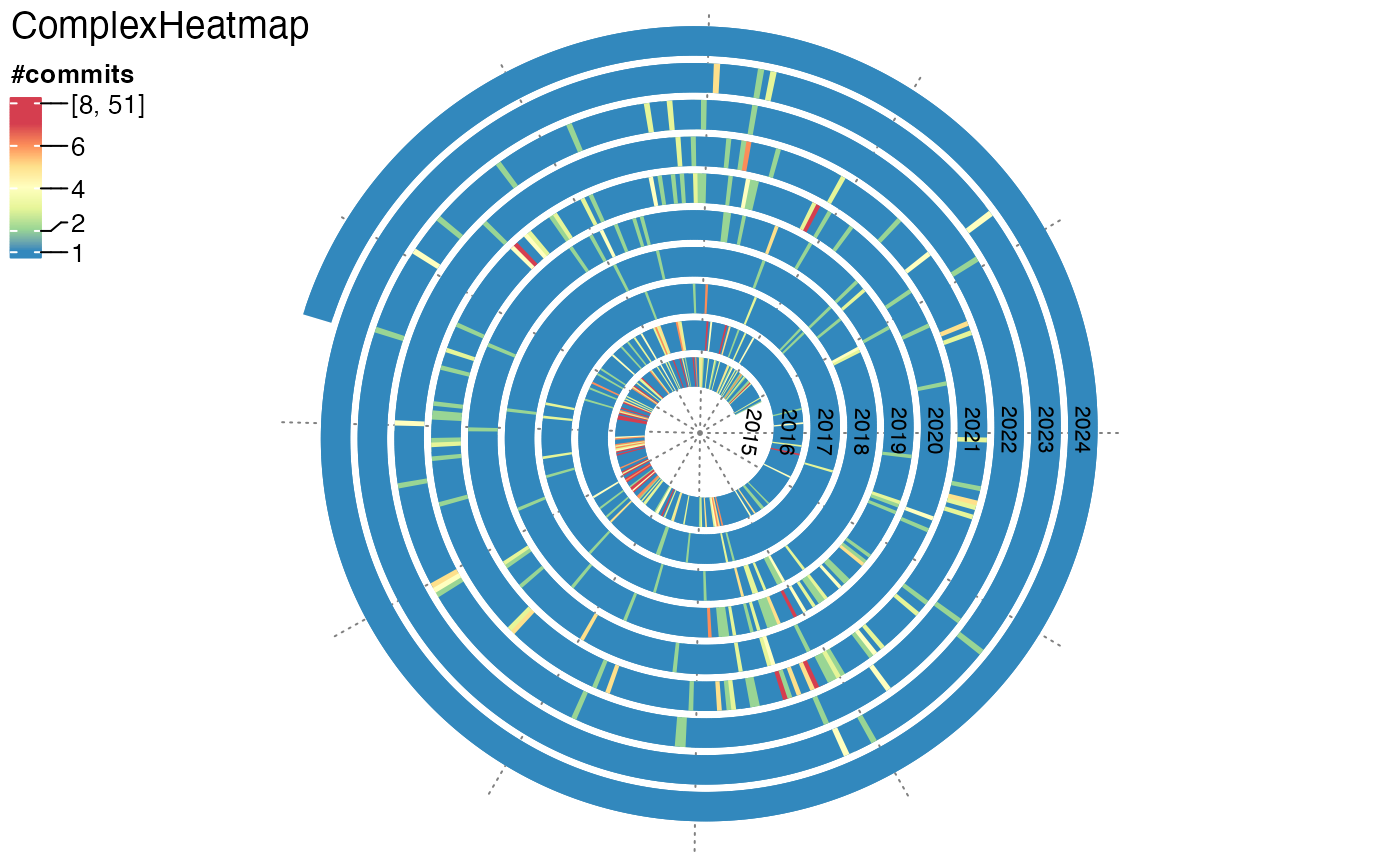
 spiral_git_commits("~/project/development/ComplexHeatmap", type = "heatmap")
 # }
# }