Chapter 10 Create plotting regions for genomic data
Tracks are created and graphics are added by
circos.genomicTrackPlotRegions(), or the short version
circos.genomicTrack(). In following examples, chromosome will be used as the
genomic category, and we assume data is simply a data frame in BED format
(where the first column is the chromosome name, the second and third column
are start and end positions, and the following columns are associated values).
For more complex form of data and behaviour of the functions, we will
introduce in Chapter 11.
Similar as circos.track(), circos.genomicTrack() also accepts a self-
defined function panel.fun which is applied in every cell but with different
form.
circos.genomicTrackPlotRegion(data, panel.fun = function(region, value, ...) {
    circos.genomicPoints(region, value, ...)
})
Inside panel.fun, users can use low-level graphic functions to add basic
graphics in each cell. panel.fun expects two arguments region and value
which are automatically processed and passed from circos.genomicTrack().
region is a two-column data frame which only contains start position and end
position in the current chromosome. value is also a data frame which
contains other columns (start for the fourth column, if it exists). Thus, basically,
region can be thought as values on x axes and value as values on y axes.
There should be a third arguments ... which is mandatory and is used to pass
user-invisible variables to inner functions and make magics (explained in
Chapter 11). So whenever you use panel.fun in
circos.genomicTrack(), please add it to the end of your function.
Following code demonstrates the values for region and value when used inside panel.fun.
bed = generateRandomBed(nc = 2)
head(bed, n = 2)
## chr start end value1 value2
## 1 chr1 20696 95977 -0.09656667 1.00586925
## 2 chr1 642332 644551 -0.57109089 0.09012606circos.initializeWithIdeogram(plotType = NULL)
circos.genomicTrackPlotRegion(bed, panel.fun = function(region, value, ...) {
if(CELL_META$sector.index == "chr1") {
print(head(region, n = 2))
print(head(value, n = 2))
}
})## start end
## 1 20696 95977
## 2 642332 644551
## value1 value2
## 1 -0.09656667 1.00586925
## 2 -0.57109089 0.09012606Since circos.genomicTrack() creates a new track, it needs values to
calculate data ranges on y direction. Users can either specify the index of
numeric columns in data by numeric.column (named index or numeric index,
it can also be a vector with more than one columns) or directly set ylim. If none of
them are set, the function will try to look for all numeric columns in data
(of course, excluding the first three columns), and set them as
numeric.column.
circos.genomicTrackPlotRegion(data, ylim = c(0, 1),
    panel.fun = function(region, value, ...) {
        circos.genomicPoints(region, value, ...)
})
circos.genomicTrackPlotRegion(data, numeric.column = c("value1", "value2"),
    panel.fun = function(region, value, ...) {
        circos.genomicPoints(region, value, ...)
})
Since genomic functions are implemented by basic circlize functions, you can
use circos.info() anywhere to get information of sectors and tracks.
As you already see in previous examples, circlize also provides low-level graphic functions specifically designed for genomic data. They are all implemented by the corresponding normal circlize functions, but needs input variables with special format.
In this chapter, we introduce the basic usage of circos.genomicTrack() and
low-level circos.genomic*(). In Chapter 11, we will
introduce more usages of these functions, which are especially designed for
genomic regions measured at multiple conditions. Example plots are shown together in
Chapter 11.
10.1 Points
Usage of circos.genomicPoints() is similar as circos.points().
circos.genomicPoints() expects a two-column data frame which contains genomic regions
and a data frame containing corresponding values. Points are always drawn at
the middle of each region. The data column of the y values for plotting should
be specified by numeric.column. If numeric.column has length larger than
one, all the specified columns will be used for adding points.
If the function is called inside circos.genomicTrack() and users have been
already set numeric.column in circos.genomicTrack(), proper value of
numeric.column will be passed to circos.genomicPoints() through ... in
panel.fun, which means, you must add ... as the final argument in
circos.genomicPoints() to get such information. If numeric.column is not
set in both places, circos.genomicPoints() will use all numeric columns
detected in value.
Note here numeric.column is measured in value while numeric.column in
circos.genomicTrack() is measured in the complete data frame. There is a
difference of 3 for the column index! When numeric.column is passed to
circos.genomicPoints() internally, 3 is subtracted automatically. If you use
character index instead of numeric index, you do not need to worry about it.
Possible usages of circos.genomicPoints() are as follows.
circos.genomicPoints(region, value, numeric.column = c(1, 2))
circos.genomicPoints(region, value, cex, pch)
circos.genomicPoints(region, value, sector.index, track.index)
circos.genomicTrack(data, numeric.column = 4,
    panel.fun = function(region, value, ...) {
        # numeric.column is automatically passed to `circos.genomicPoints()`
        circos.genomicPoints(region, value, ...)
})
If there is only one numeric column, graphical parameters such as pch, cex
can be of length one or number of rows of region. If there are more than one
numeric columns specified, points for each numeric column will be added
iteratively, and the graphical parameters should be either length one or
number of numeric columns specified.
circos.genomicPoints() is simply implemented by circos.points(). The basic
idea of the implementation is shown as following code, so, if you don’t like the
circos.genomic*() functions, it would not be difficult to directly use the
circos.*() functions.
circos.genomicPoints = function(region, value, numeric.column = 1, ...) {
    x = (region[[2]] + region[[1]])/2
    for(i in numeric.column) {
        y = value[[i]]
        circos.points(x, y, ...)
    }
}
10.2 Lines
circos.genomicLines() is similar as circos.lines(). The setting of
graphical parameters is similar as circos.genomicPoints().
circos.genomicLines(region, value, ...)
circos.genomicLines(region, value, numeric.column = c(1, 2))
circos.genomicLines(region, value, area, baseline, border)
circos.genomicLines(region, value, sector.index, track.index)
circlize additionally provides a new option segment for lty by
which each genomic regions represent as ‘horizontal’ lines at y positions
(see Figure 11.2, track H).
circos.genomicLines(region, value, lwd, lty = "segment")10.3 Text
For circos.genomicText(), the position of text can be specified either by numeric.column
or a separated vector y. The labels of text can be specified either by labels.column
or a vector labels.
circos.genomicText(region, value, ...)
circos.genomicText(region, value, y = 1, labels)
circos.genomicText(region, value, numeric.column, labels.column)
circos.genomicText(region, value, facing, niceFacing, adj)
circos.genomicText(region, value, sector.index, track.index)
10.4 Rectangles
For circos.genomicRect(), Since the left and right of the rectangles are
already determined by the start and end of the genomic regions, we only need
to set the positions of top and bottom of the rectangles by specifying ytop,
ybottom or ytop.column, ybottom.column.
circos.genomicRect(region, value, ytop = 1, ybottom = 0)
circos.genomicRect(region, value, ytop.column = 2, ybottom = 0)
circos.genomicRect(region, value, col, border)
10.5 Links
circos.genomicLink() expects two data frames and it adds links from genomic
regions in the first data frame to corresponding genomic regions in the second
data frame. All additional arguments are passed to circos.link().
set.seed(123)
bed1 = generateRandomBed(nr = 100)
bed1 = bed1[sample(nrow(bed1), 20), ]
bed2 = generateRandomBed(nr = 100)
bed2 = bed2[sample(nrow(bed2), 20), ]

circos.initializeWithIdeogram()
circos.genomicLink(bed1, bed2, col = rand_color(nrow(bed1), transparency = 0.5),
    border = NA)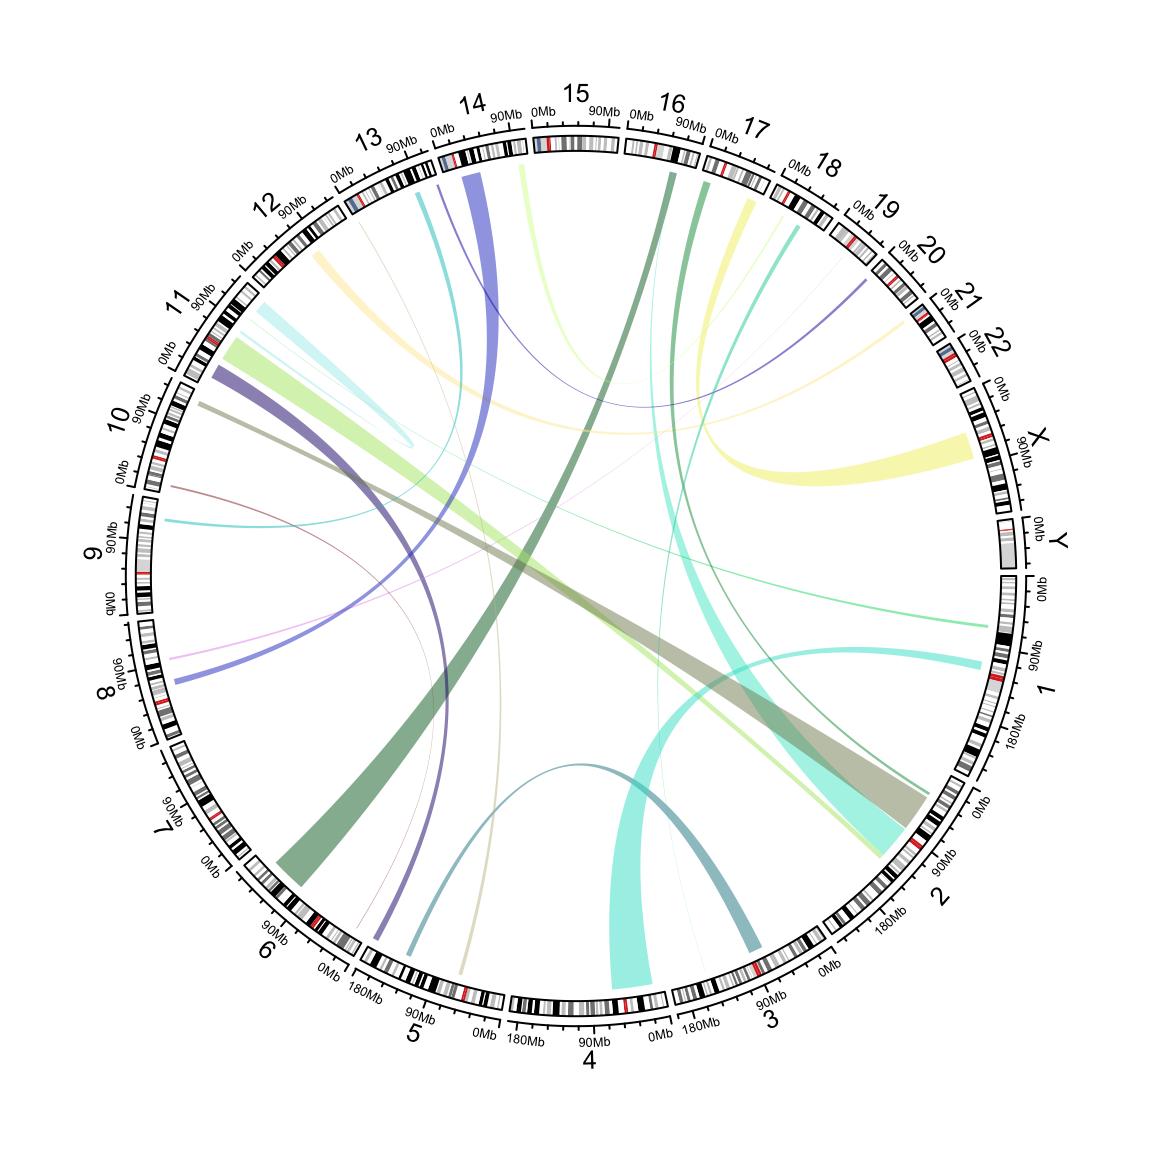
Figure 10.1: Add links from two sets of genomic regions.
circos.clear()10.6 Mixed use of general circlize functions
panel.fun is applied on each cell, which means, besides genomic graphic
functions, you can also use general circlize functions to add more graphics.
For example, some horizontal lines and texts are added to each cell and axes
are put on top of each cell.
circos.genomicTrack(bed, ylim = c(-1, 1),
    panel.fun = function(region, value, ...) {
        circos.genomicPoints(region, value, ...)

        for(h in c(-1, -0.5, 0, 0.5, 1)) {
            circos.lines(CELL_META$cell.xlim, c(0, 0), lty = 2, col = "grey")
        }
        circos.text(x, y, labels)
        circos.axis("top")
})