In Chord diagram, when there are two groups (which correspond to rows and columns if the input is a adjacency matrix), it is always visually beautiful to rotate the diagram to be symmetric on horizontal direction or vertical direction. Actually it is quite easy to calculate a proper degree that needs to be rotated for the circle. In this post, I will show how to calculate such kind of “rotated degree value”.
First let’s create some random data.
set.seed(123)
mat = matrix(rnorm(30), nrow = 10, dimnames = list(letters[1:10], LETTERS[1:3]))
nr = nrow(mat)
nc = ncol(mat)
n_sector = nr + nc
In the Chord diagram, the total width of row sectors corresponds to the sum of row sum of the matrix with absolute values and so is for the column sectors.
row_sum = sum(rowSums(abs(mat)))
col_sum = sum(colSums(abs(mat)))
Small gaps between sectors are set to 1 degree and big gaps between row and column sectors are set to 20 degree.
small_gap = 1
big_gap = 20
In the circle, there are regions which are covered by small gaps, big gaps and sectors. Since the width of sectors are proportional to the row sums and/or column sums of the matrix, it is easy to calculate how much degrees are hold by the row sectors:
row_sector_degree = (360 - small_gap*(n_sector - 2) - big_gap*2) * (row_sum/(row_sum + col_sum)) +
                    small_gap*(nr-1)
If the row sectors are put in the right of the circle, we can calculate the “start degree” for the circle.
Note chordDiagram() always draw row sectors first and by default the circle goes clockwisely.
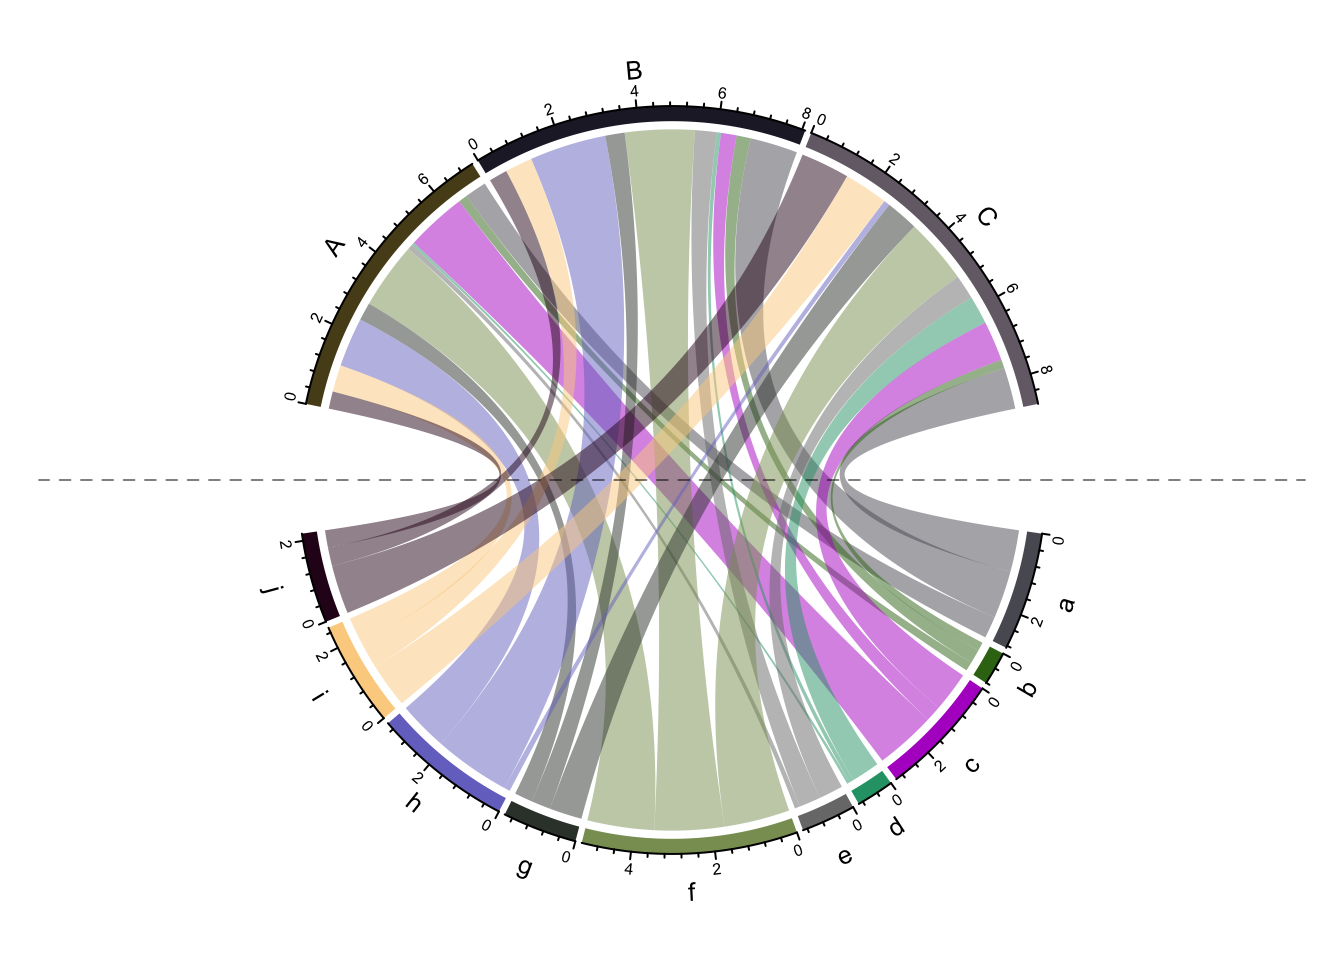
start_degree = 90 - (180 - row_sector_degree)/2Note there are small gaps and big gaps between sectors, the gap.degree in circos.par() should be set
as a vector. I also added a vertical line which assists to see the symmetry.
gaps = c(rep(small_gap, nrow(mat) - 1), big_gap, rep(small_gap, ncol(mat) - 1), big_gap)
circos.par(gap.degree = gaps, start.degree = start_degree)
grid_col = structure(rand_color(n_sector), names = c(rownames(mat), colnames(mat)))
chordDiagram(mat, grid.col = grid_col)
circos.clear()
abline(v = 0, lty = 2, col = "#00000080")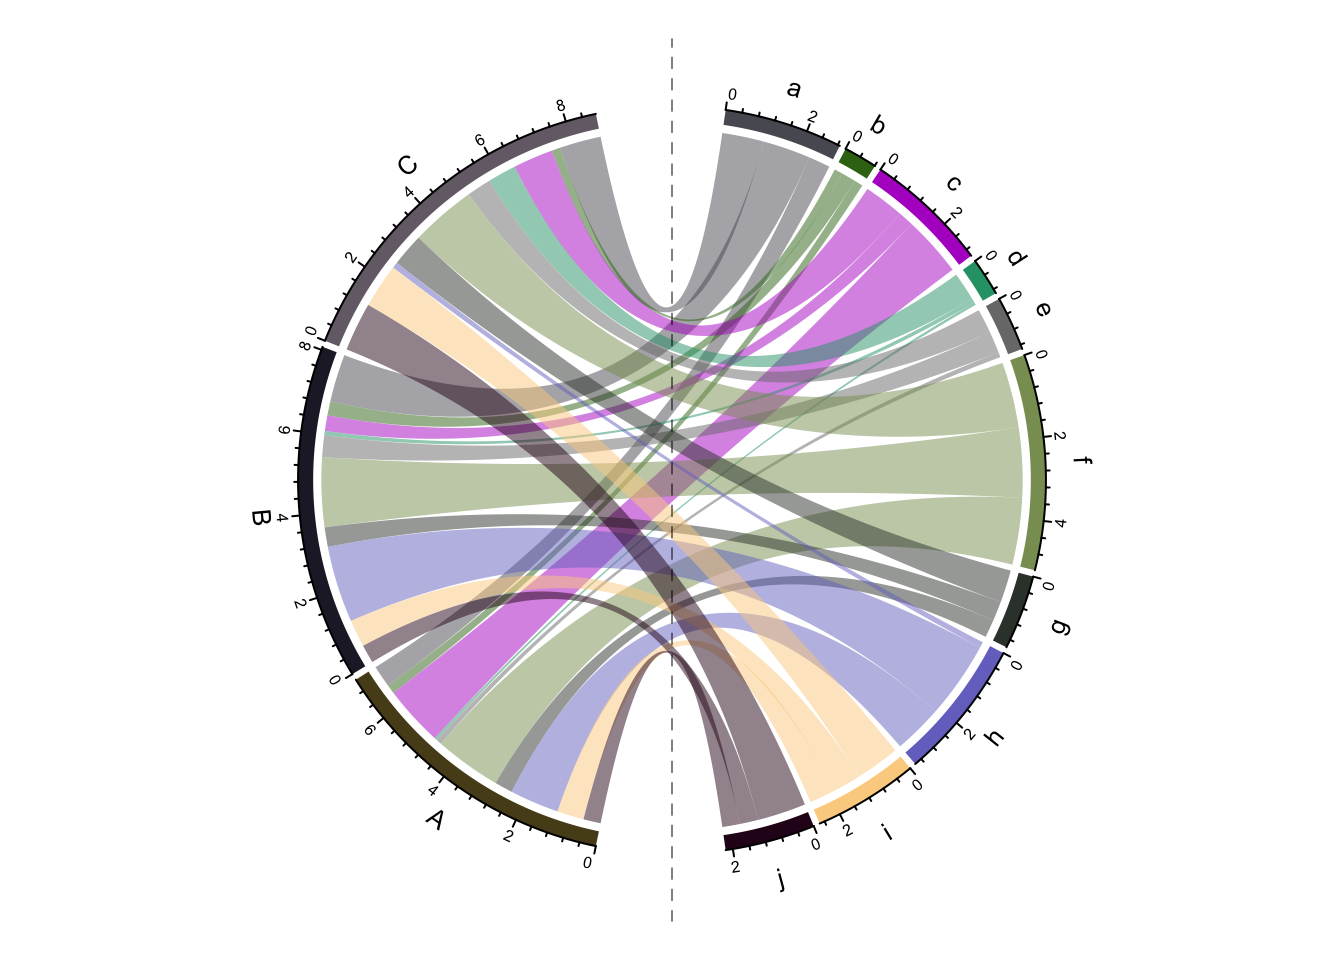
Similar we can adjust the “start degree” to let the circle looks horizonal.
start_degree = 0 - (180 - row_sector_degree)/2
gaps = c(rep(small_gap, nrow(mat) - 1), big_gap, rep(small_gap, ncol(mat) - 1), big_gap)
circos.par(gap.degree = gaps, start.degree = start_degree)
chordDiagram(mat, grid.col = grid_col)
circos.clear()
abline(h = 0, lty = 2, col = "#00000080")