When making a heatmap, the width and height of heatmap cells are automatically adjusted to fill in the figure (e.g. the following figure), which means, when you change the width and height of the final figure, the width and height of the cells change accordingly.
library(ComplexHeatmap)
set.seed(123)
mat = matrix(rnorm(100), 10)
Heatmap(mat, name = "mat")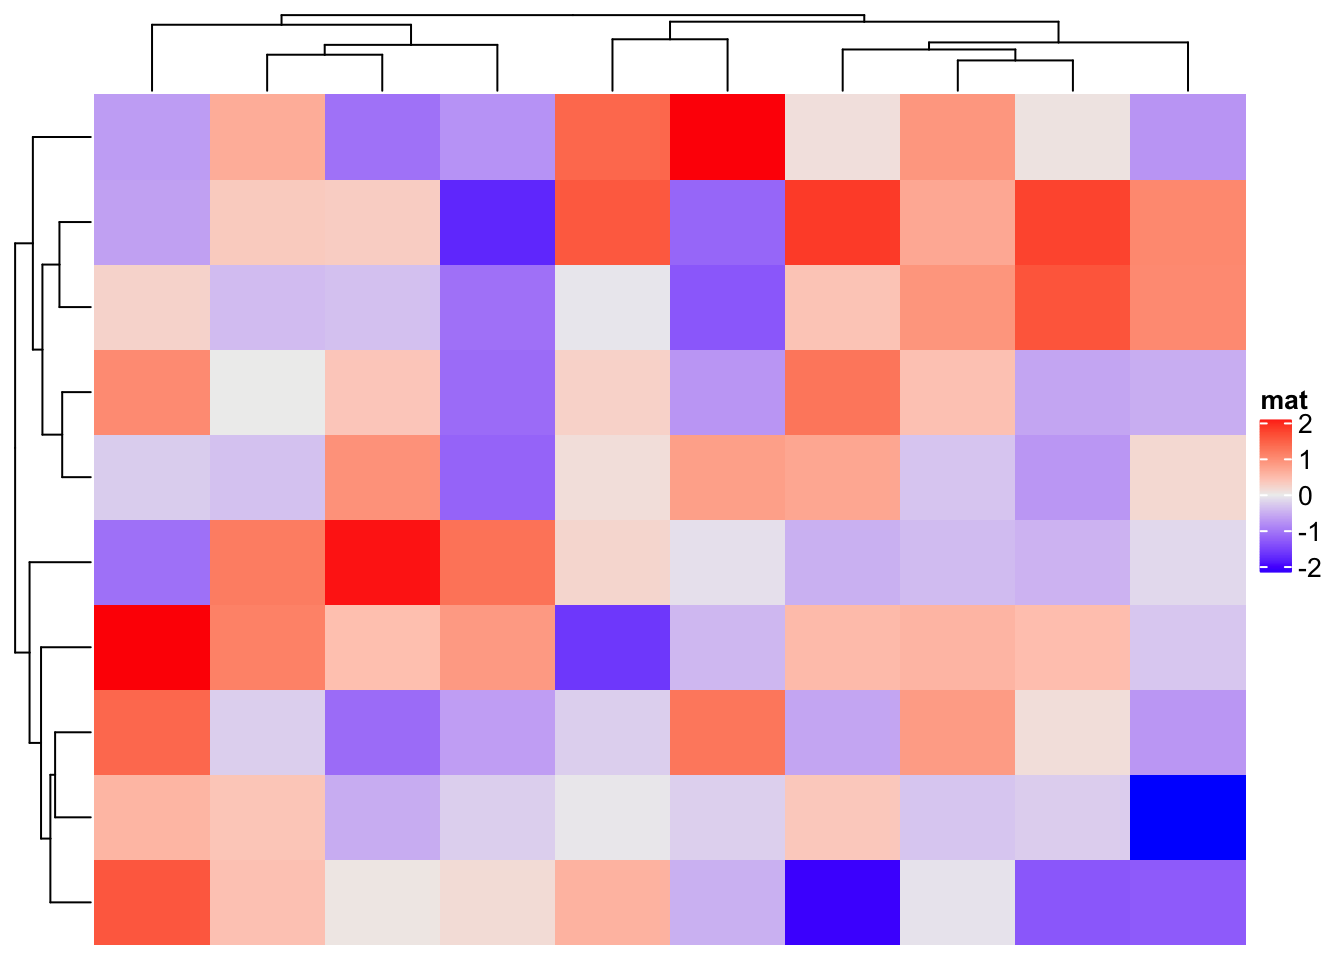
When the matrix is small, there are scenarios where you might want to manually set the width and height of cells to fixed values, so that you can, e.g., put proper row/column labels or to make it easy to compare to other heatmaps with different dimensions.
In Heatmap() function, the total width and height of the heatmap body
can be controlled by the width and height arguments, which means you can
control the size of the whole heatmap by setting proper values to these two
arguments. E.g. setting width to ncol(mat)*unit(5, "mm") and height to
nrow(mat)*unit(5, "mm") ensures the cells to be 5mm for both width and
height.
To save the plot into an figure file, one problem arising is you need to properly calculate the size of the figure to completely place the plot, or else the plot is either clipped or there has white spaces around the plot.
In the following figures, the size of the figure is larger than the size of the heatmap. A black border is added to show the size of the figure.
Heatmap(mat, name = "mat",
    width = ncol(mat)*unit(5, "mm"),
    height = nrow(mat)*unit(5, "mm"))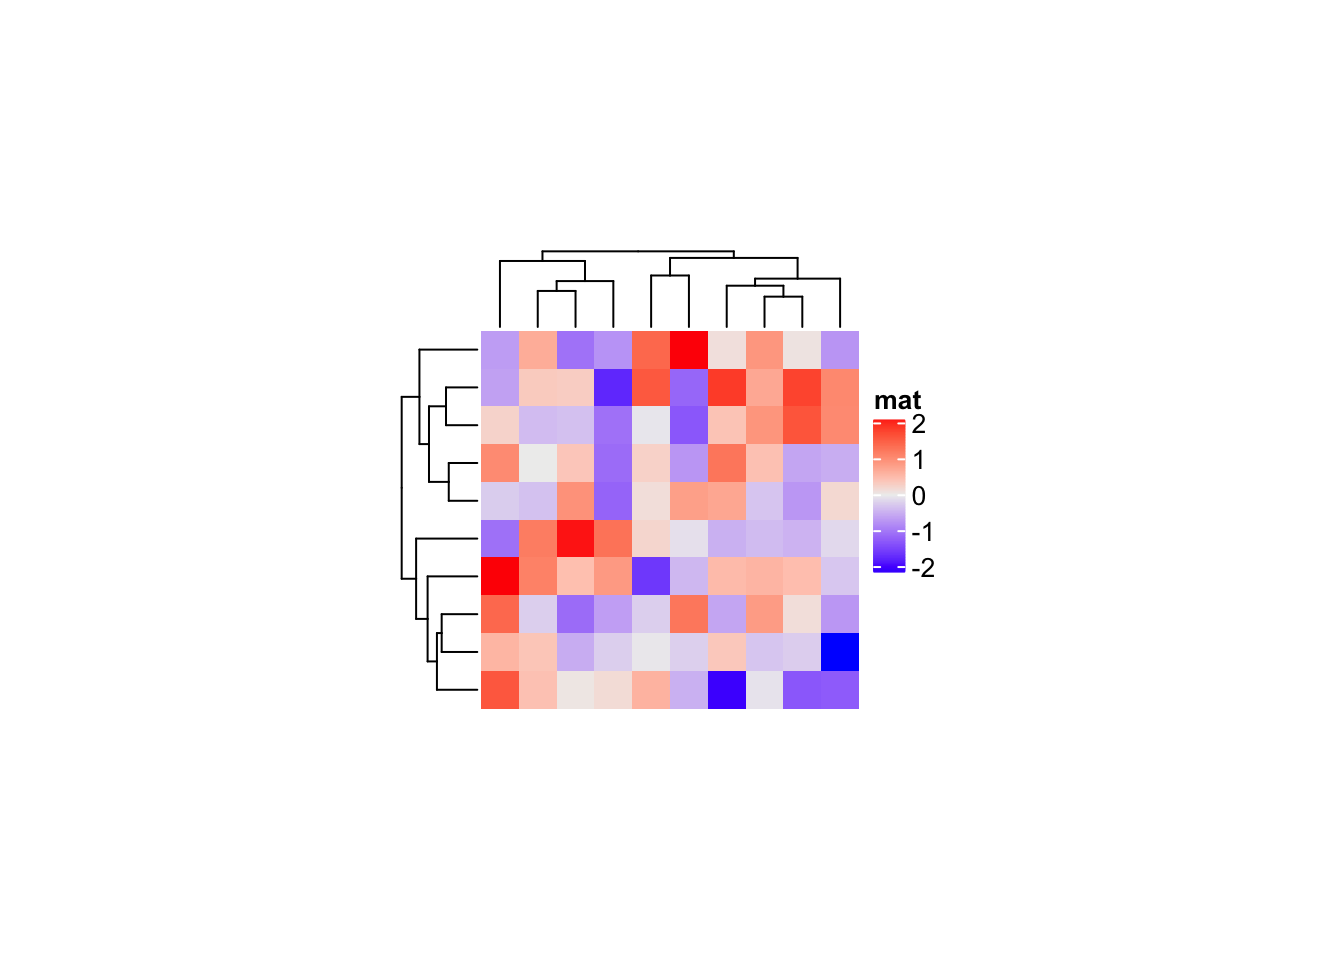
In ComplexHeatmap, the size of the heatmap (including dendrograms, titles
and legends, …) can be retrieved by ComplexHeatmap:::width() and
ComplexHeatmap:::height() functions. Note these two functions currently are
not exported, so you need to use ::: to use them.
To use ComplexHeatmap:::width() and ComplexHeatmap:::height(), you first
need to explicitly execute draw() function to perform clustering and
initialize the layout, then ComplexHeatmap:::width() and
ComplexHeatmap:::height() and be applied and they return the corresponding
width and height as grid::unit objects in mm. You can convert to any other
units by grid::convertX() and grid::convertY() functions.
ht = Heatmap(mat, , name = "mat",
    width = ncol(mat)*unit(5, "mm"),
    height = nrow(mat)*unit(5, "mm"))
ht = draw(ht) # it generates a plot, but we don't show here
w = ComplexHeatmap:::width(ht)
w = convertX(w, "inch", valueOnly = TRUE)
h = ComplexHeatmap:::height(ht)
h = convertY(h, "inch", valueOnly = TRUE)
c(w, h)## [1] 2.973294 2.539370Now w and h are the sizes of the heatmap, measured in inches which you can
set in pdf() function. If you save the plot as a PNG plot, then you need to
convert w and h to a unit of pt (see the help page of grid::unit).
# pdf(..., width = w, height = h)
Heatmap(mat, name = "mat",
    width = ncol(mat)*unit(5, "mm"),
    height = nrow(mat)*unit(5, "mm"))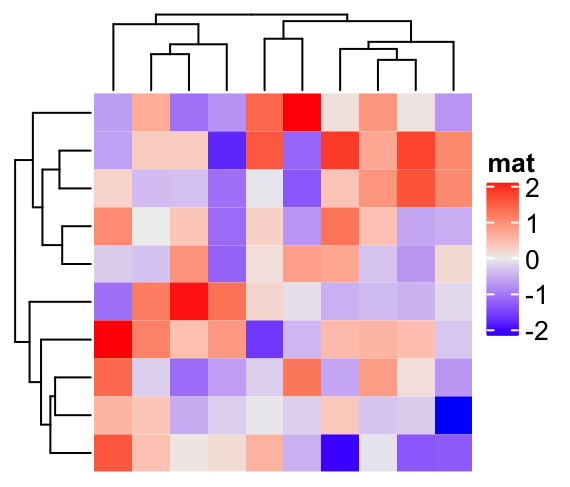
# dev.off()The calculation of heatmap size actually can be wrapped as a function, which
takes a Heatmap or HeatmapList object as input and returns the
corresponding width and height.
In the following calc_ht_size() function, since we don’t need the first
heatmap, we put it into a null device defined by pdf(NULL).
calc_ht_size = function(ht, unit = "inch") {
    pdf(NULL)
    ht = draw(ht)
    w = ComplexHeatmap:::width(ht)
    w = convertX(w, unit, valueOnly = TRUE)
    h = ComplexHeatmap:::height(ht)
    h = convertY(h, unit, valueOnly = TRUE)
    dev.off()

    c(w, h)
}
Now we can try to use calc_ht_size()
ht = Heatmap(mat, name = "mat",
        width = ncol(mat)*unit(5, "mm"),
        height = nrow(mat)*unit(5, "mm"))
size = calc_ht_size(ht)
size
## [1] 2.973294 2.539370# pdf(..., width = size[1], height = size[2])
ht
# dev.off()Similar for a smaller matrix:
mat2 = mat[1:5, 1:5]
ht2 = Heatmap(mat2, name = "mat2",
        width = ncol(mat2)*unit(5, "mm"),
        height = nrow(mat2)*unit(5, "mm"))
size2 = calc_ht_size(ht2)
size2
## [1] 1.989042 1.555118# pdf(..., width = size2[1], height = size2[2])
ht2 # or draw(ht2)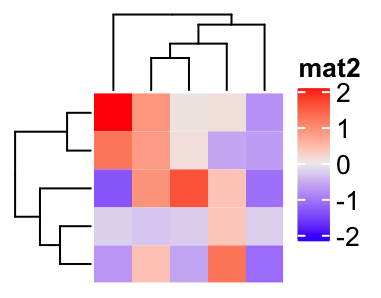
# dev.off()