In this post, I will demonstrate the automatic alignment of heatmap legends. This new feature in avaiable in ComplexHeatmap >= 2.5.4.
In the following heatmaps, I use a random 10x10 matrix generated as follows:
library(ComplexHeatmap)
set.seed(123)
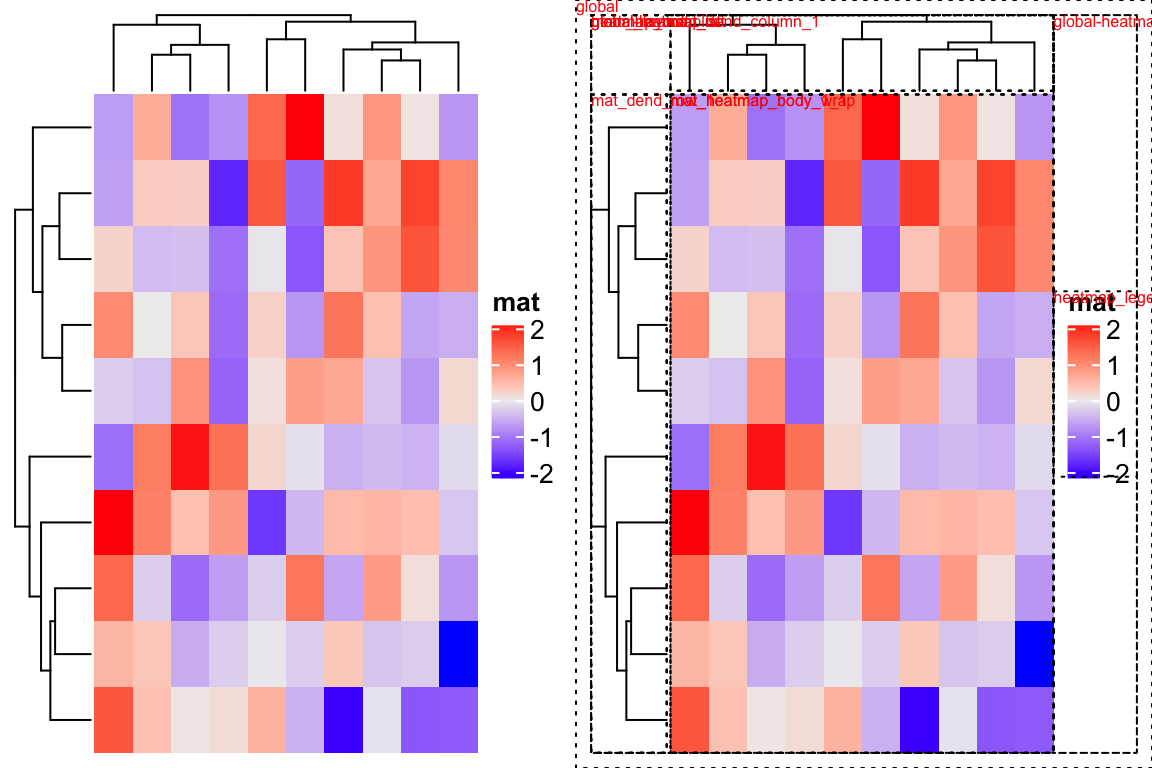
m = matrix(rnorm(100), 10)In the older versions (<= 2.5.3), the legends are put in the middle of a viewport which almost has the same height as the whole plot. It looks nice when there are no column names in the heatmap.
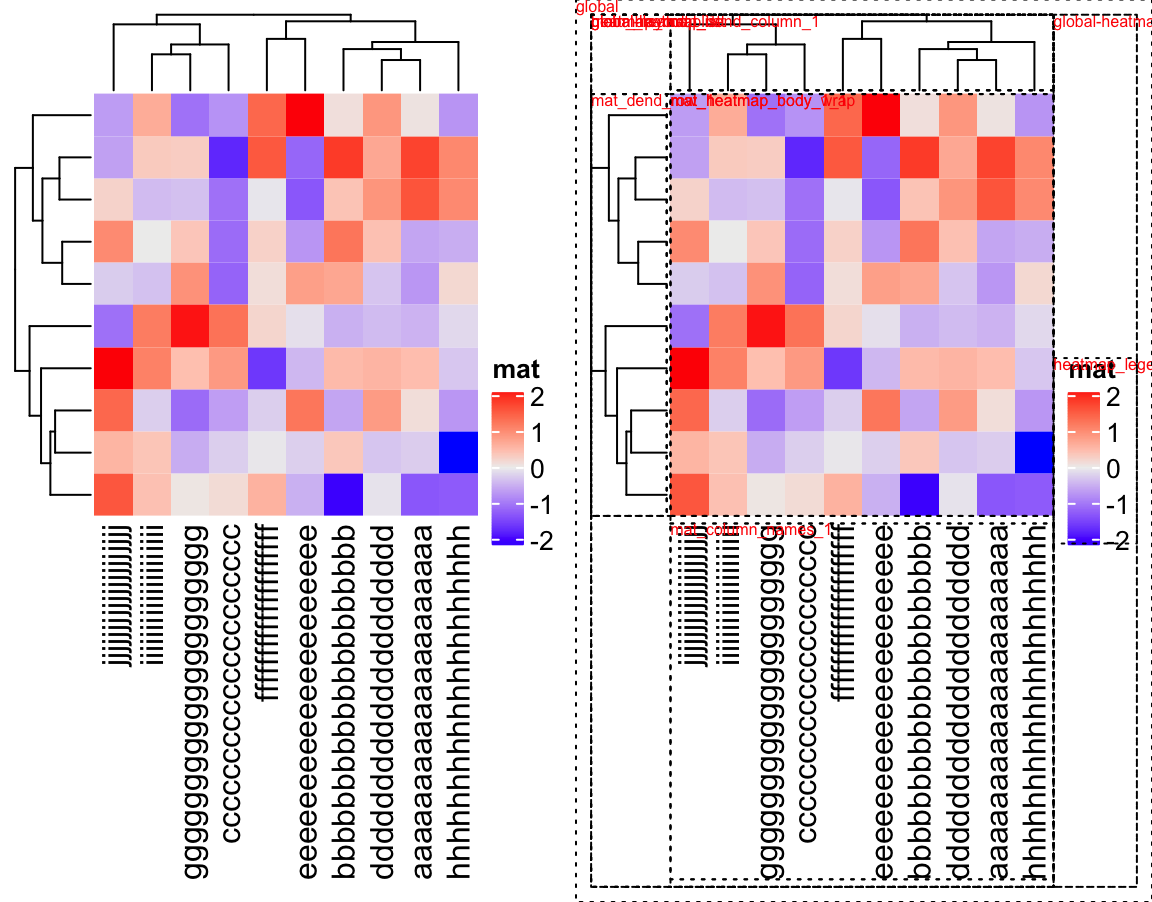
When using heatmaps to visualize large data sets (e.g. with many columns), normally we turn off the column names and the legends are in good positions. However, for some cases, e.g. for a small matrix where column names/labels are important to visualize, putting the legends in the center of that viewport will make the plot look very strange. In the next code, I add long column names to the matrix.
colnames(m) = strrep(letters[1:10], 20)And the legend is too far away from the heatmap and it looks really bad.
From version 2.5.4, the alignment of the legends can be controlled by
align_heatmap_legend and align_annotation_legend arguments in
the draw() function. There are three possible values:
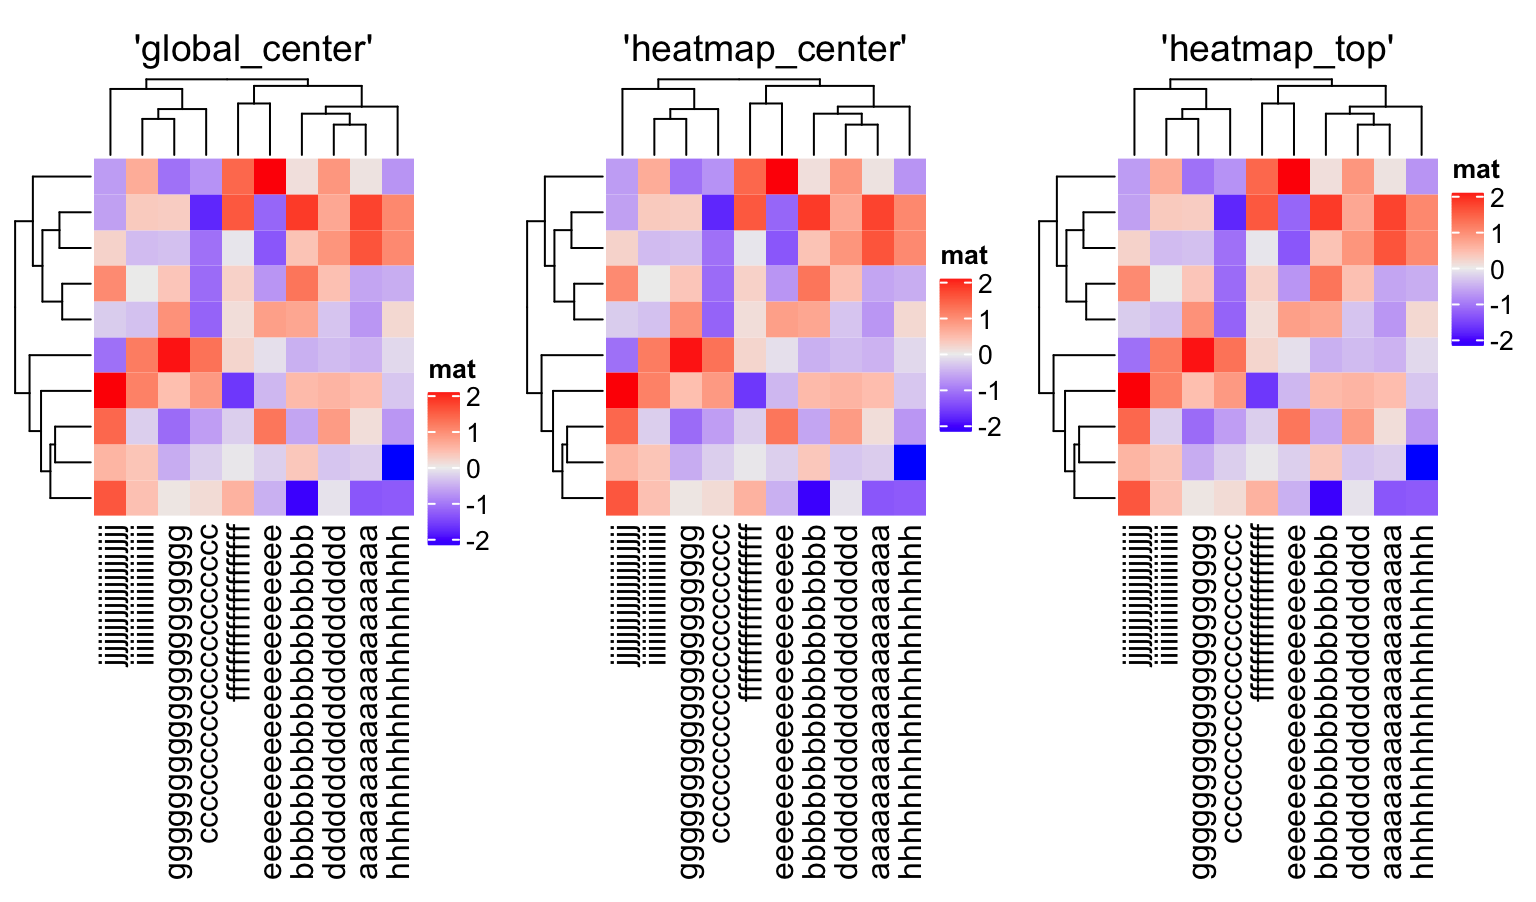
global_center: This is the same as in the old versions. The legends are put in the middle of the viewport.heatmap_center: The center of the legends is aligned to the center of the heatmap body.heatmap_top: The top of the legends is aligned to the top of the heatmap body.
An example code of setting e.g. align_heatmap_legend is:
ht = Heatmap(m, ...)
draw(ht, align_heatmap_legend = "heatmap_center", ...)
The visual effects of the three options are demonstrated in the following plot:
Although you can manually set align_heatmap_legend/align_annotation_legend,
the good thing in version 2.5.4 is it can automatically identify which value
to set to these two arguments. The basic rules are (take align_heatmap_legend
as an example):
- If the height of the legends is smaller than the height of the heatmap body,
the value for
align_heatmap_legendis set to"heatmap_center". - If the height of the legends is smaller than the height of the heatmap body plus
the sum of heights of the bottom elements of the heatmap (e.g., column names, bottom annotations),
the value for
align_heatmap_legendis set to"heatmap_top". - For other scenarios, the value for
align_heatmap_legendis set to"global_center".
In the following code, there are two heatmaps with two legends. The height of the two legends is still smaller than the height of the heatmap body, thus, as we can observe from the plot, the legends are centered to the center of the heatmap body.
Heatmap(m, name = "mat1") +
    Heatmap(m, name = "mat2")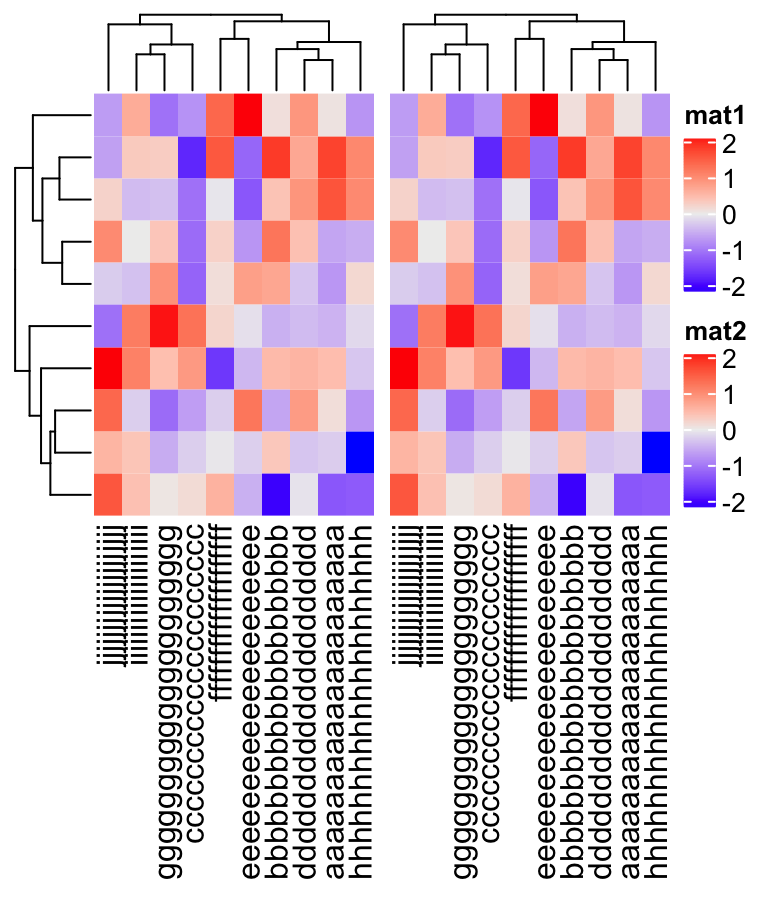
Next we add a third heatmap. Now the legends are higher than the heatmap body. Thus they are aligned to the top of the heatmap body.
Heatmap(m, name = "mat1") +
    Heatmap(m, name = "mat2") +
    Heatmap(m, name = "mat3")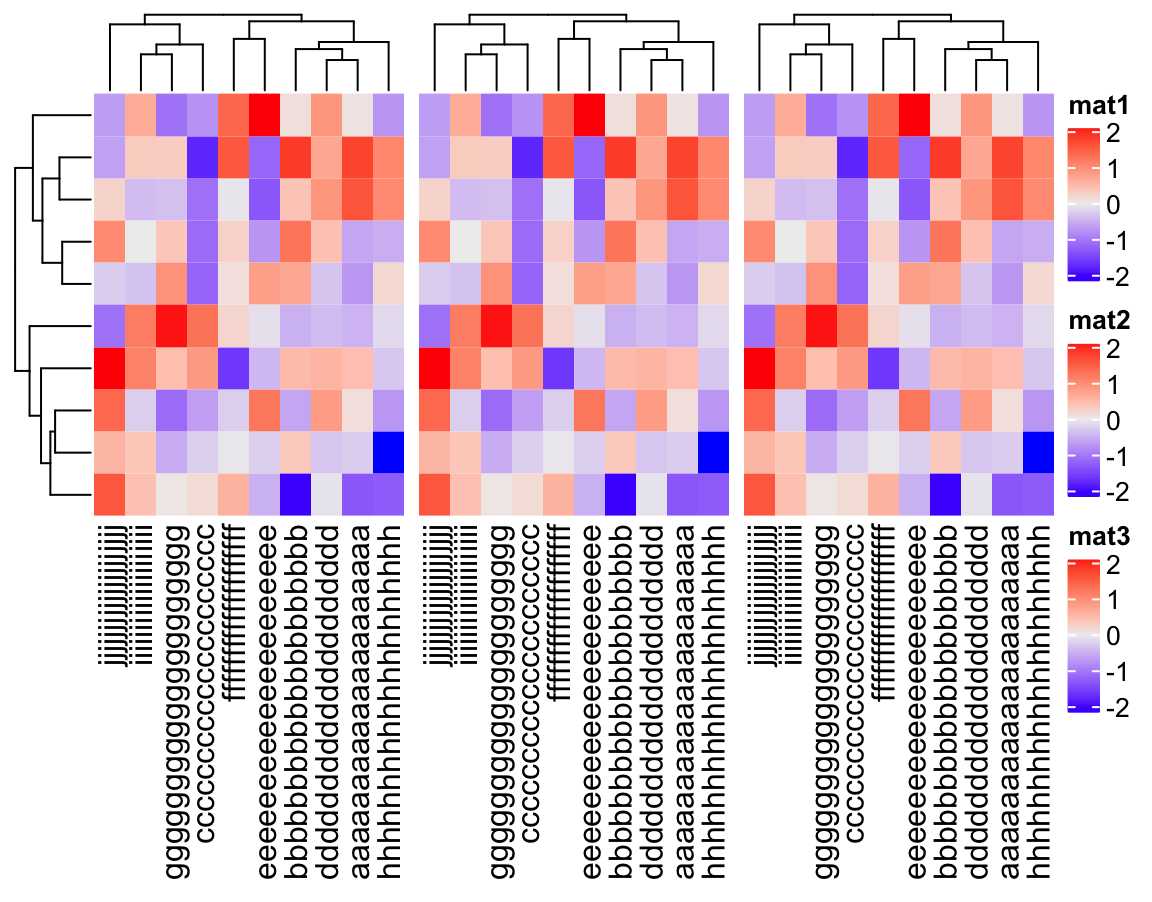
When there are four legends, their height is larger than the height of the heatmap body
and plus column names, so the mode is set to "global_center".
Heatmap(m, name = "mat1") +
    Heatmap(m, name = "mat2") +
    Heatmap(m, name = "mat3") +
    Heatmap(m, name = "mat4")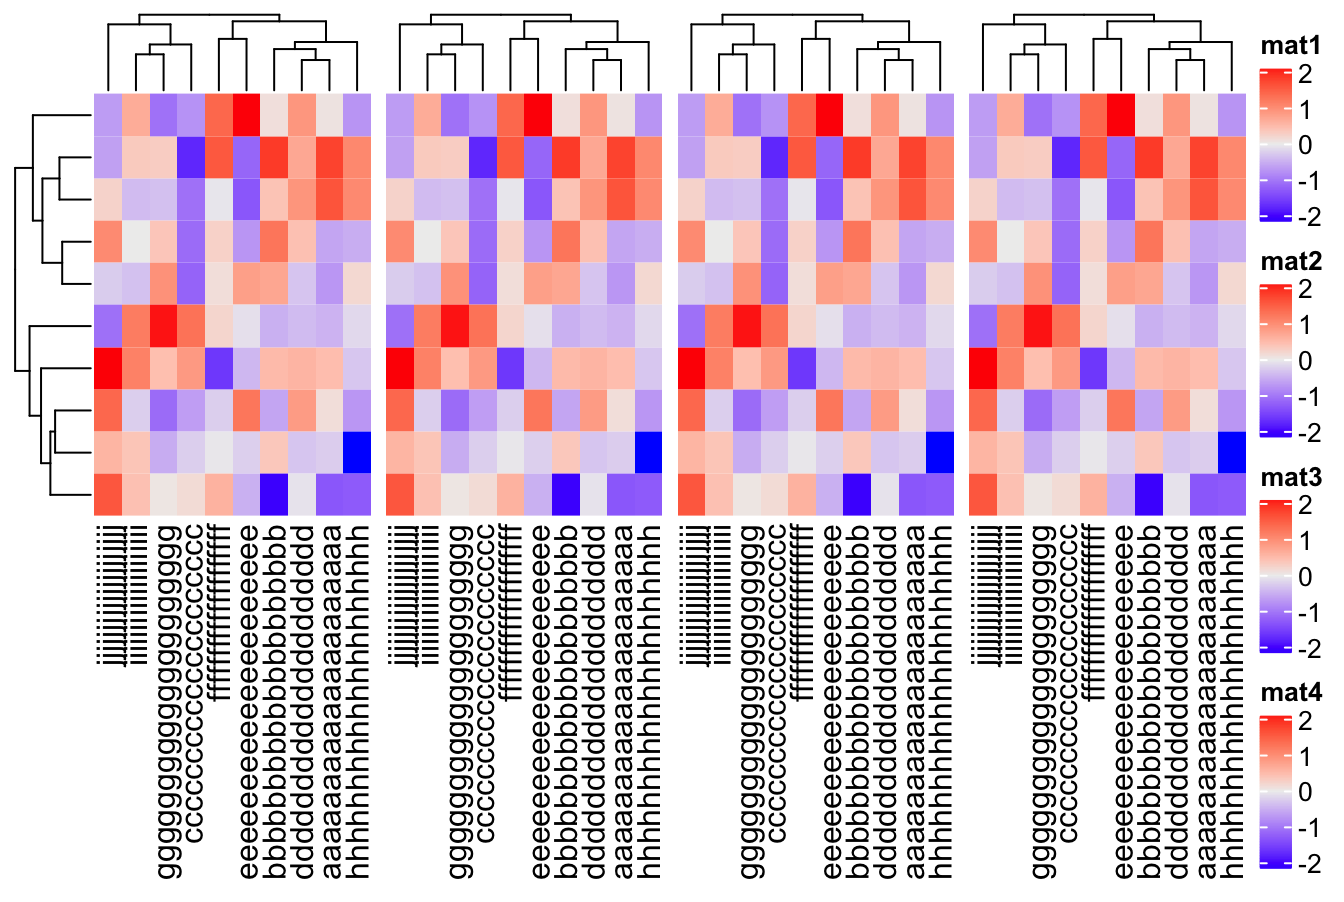
When there are five legends, since the height of the legends now exceeds the height of the plot, now they are wrapped into two columns.
Heatmap(m, name = "mat1") +
    Heatmap(m, name = "mat2") +
    Heatmap(m, name = "mat3") +
    Heatmap(m, name = "mat4") +
    Heatmap(m, name = "mat5")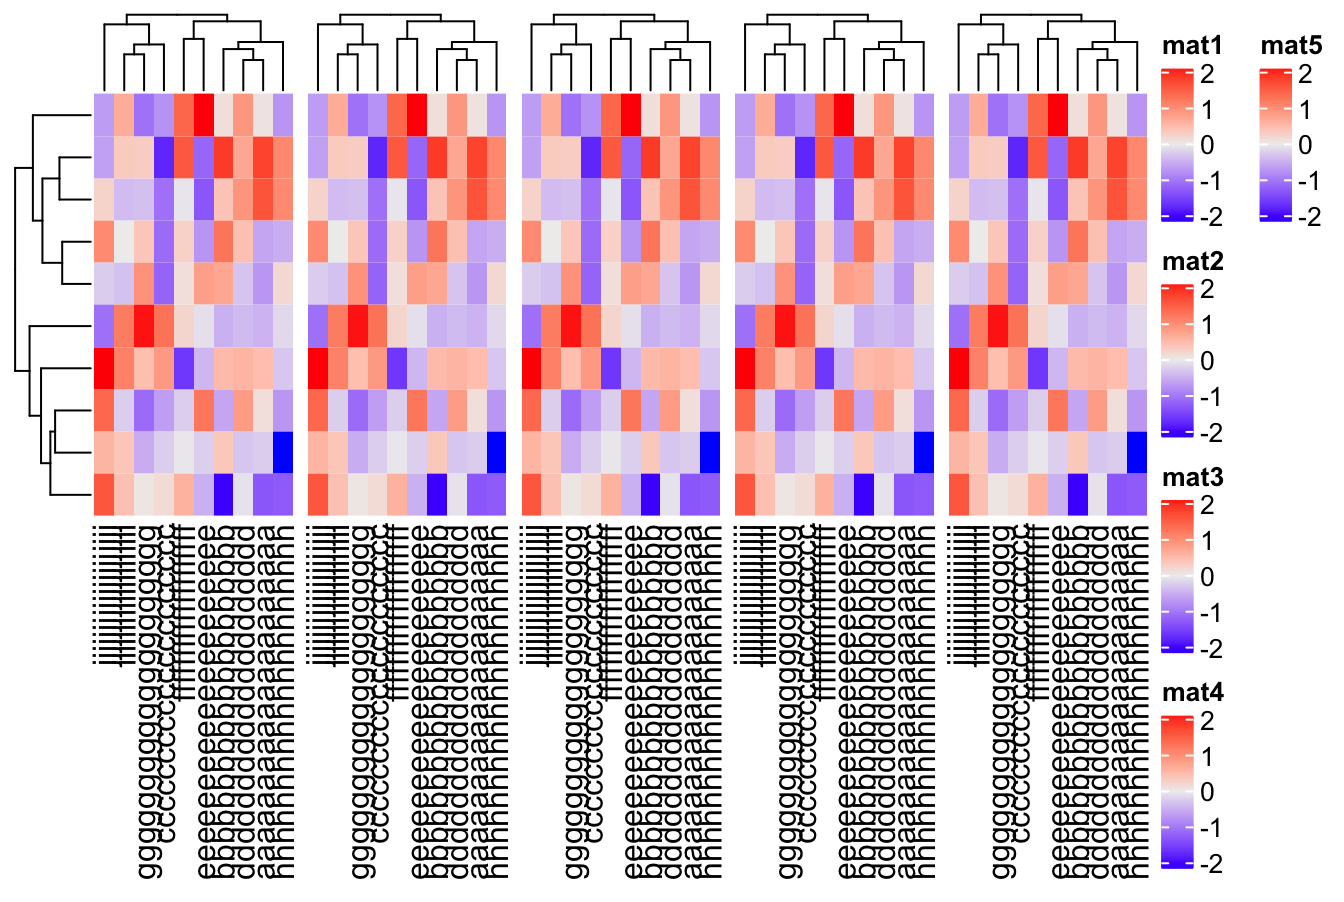
Similarly, for ten legends, they are wrapped into three columns, so all the legends are drawn and visible in the plot.
Heatmap(m, name = "mat1") + Heatmap(m, name = "mat2") +
    Heatmap(m, name = "mat3") + Heatmap(m, name = "mat4") +
    Heatmap(m, name = "mat5") + Heatmap(m, name = "mat6") +
    Heatmap(m, name = "mat7") + Heatmap(m, name = "mat8") +
    Heatmap(m, name = "mat9") + Heatmap(m, name = "mat10")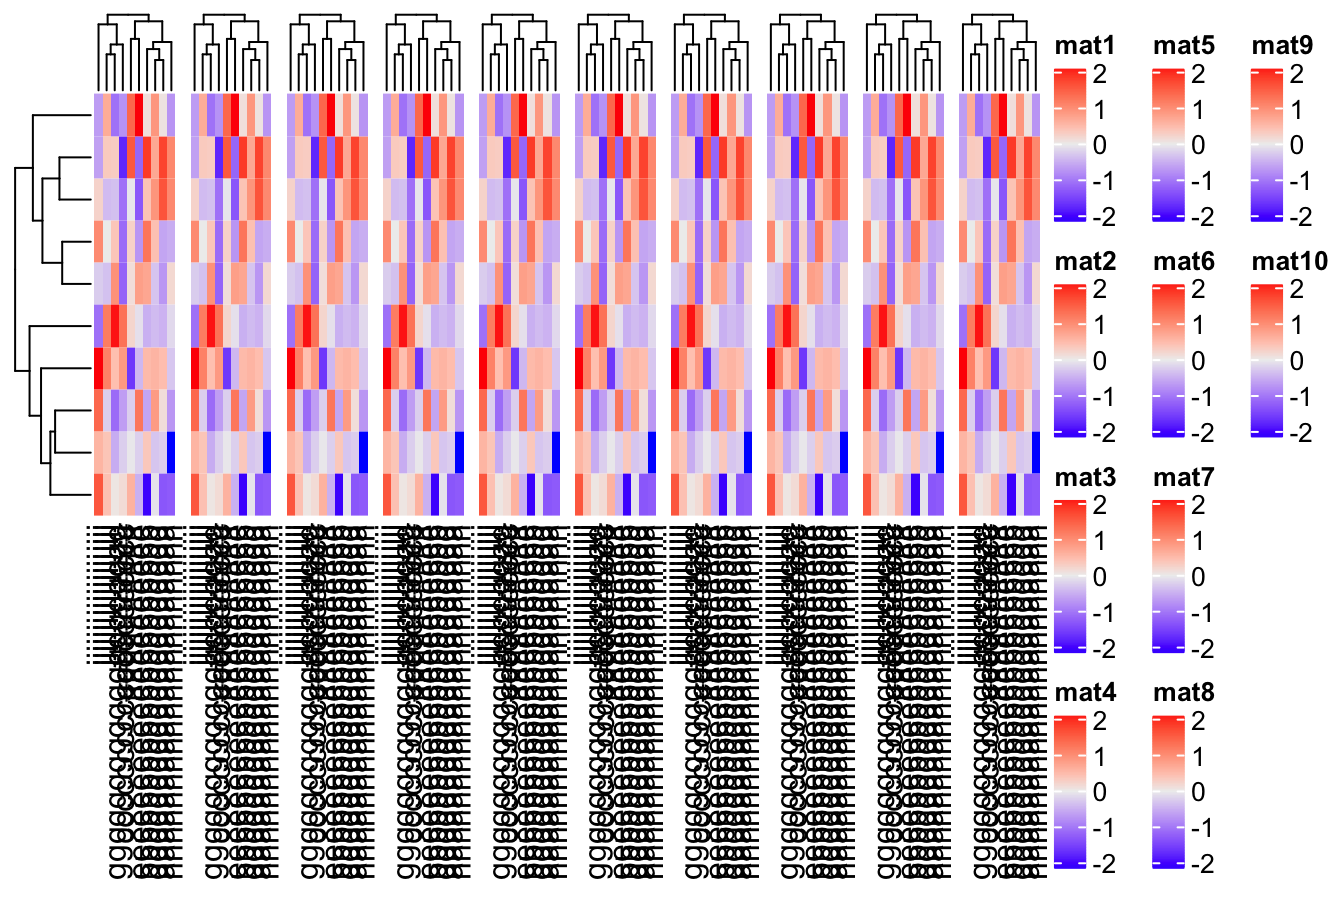
Let’s try also with the annotation legends.
ha = HeatmapAnnotation(foo1 = 1:10)
Heatmap(m, name = "mat", top_annotation = ha)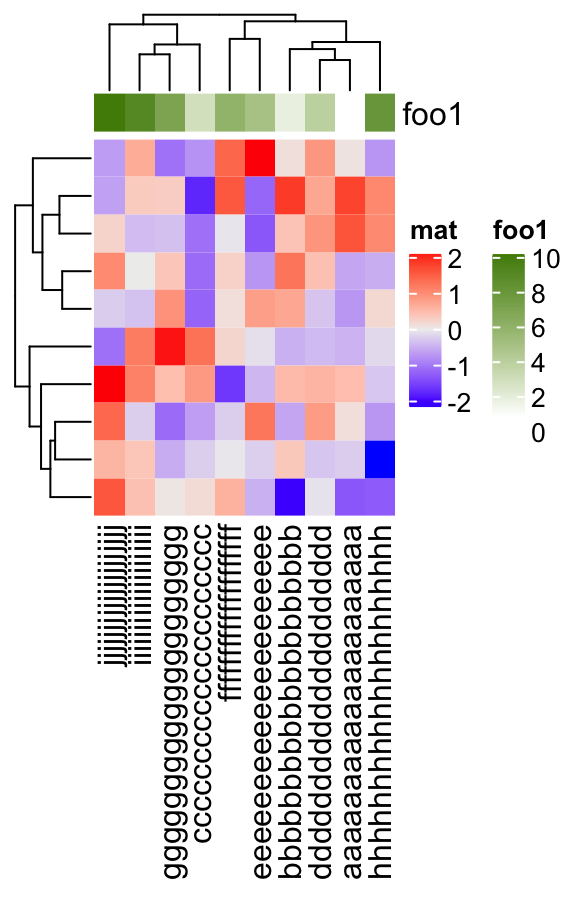
ha = HeatmapAnnotation(foo1 = 1:10, foo2 = 1:10)
Heatmap(m, name = "mat", top_annotation = ha)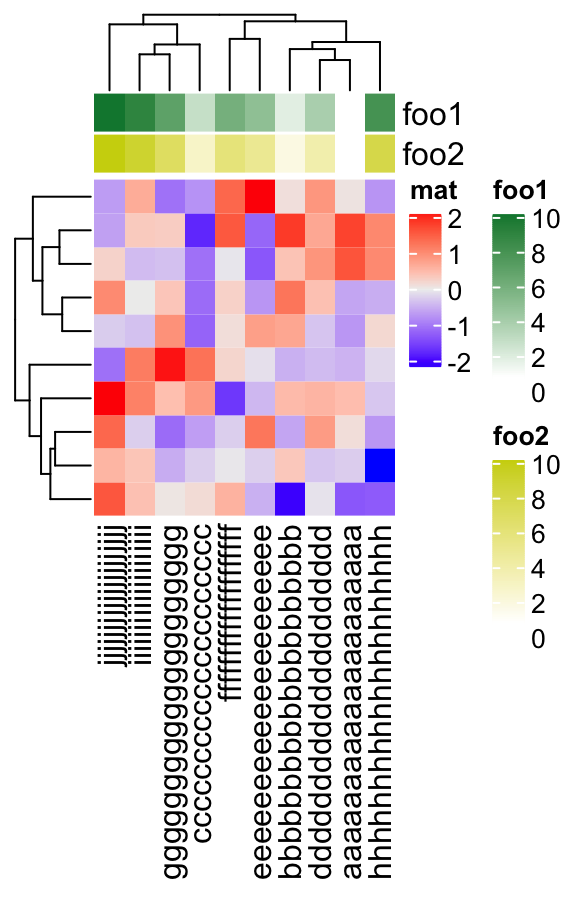
Currently, there is a limit for this new functionality that the legends might overlap to the annotaiton labels if they are on the same side of the heatmap.
ha = HeatmapAnnotation(foo1 = 1:10, foo2 = 1:10, foo3 = 1:10)
Heatmap(m, name = "mat", top_annotation = ha)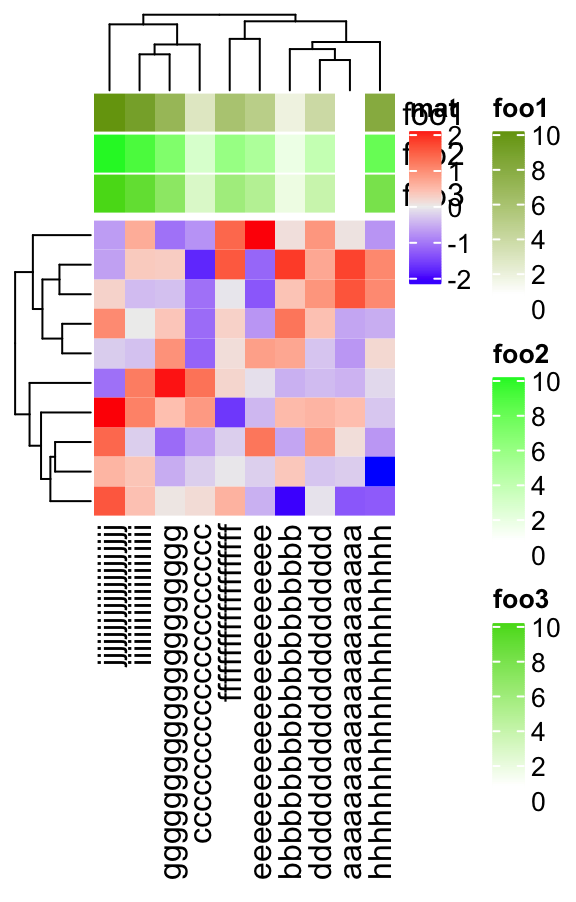
One solution is to move the annotation labels to the other side.
ha = HeatmapAnnotation(foo1 = 1:10, foo2 = 1:10, foo3 = 1:10,
    annotation_name_side = "left")
Heatmap(m, name = "mat", top_annotation = ha)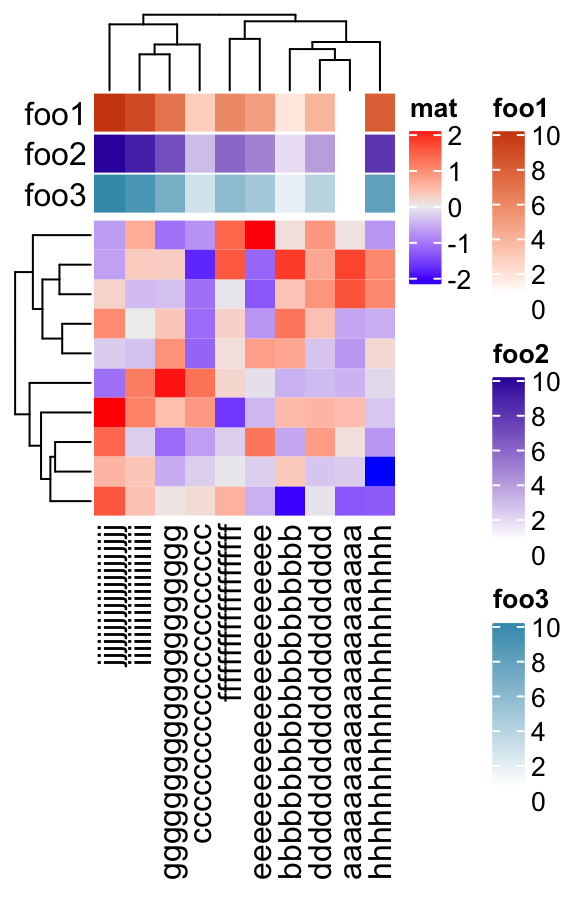
This new functionality also works for the horizontal legend list that is put at the bottom of the heatmaps.