In ComplexHeatmap package, anno_block() function draws rectangles for
row/column slices, like in the following plot. Then what if we want to draw the
rectangles over several slices to show they belong to certain groups?
set.seed(123)
mat = matrix(rnorm(50*50), nrow = 50)
library(ComplexHeatmap)
ha = HeatmapAnnotation(foo = anno_block(gp = gpar(fill = 2:6), labels = LETTERS[1:5]))
split = rep(1:5, each = 10)
Heatmap(mat, name = "mat", column_split = split, top_annotation = ha,
    column_title = NULL)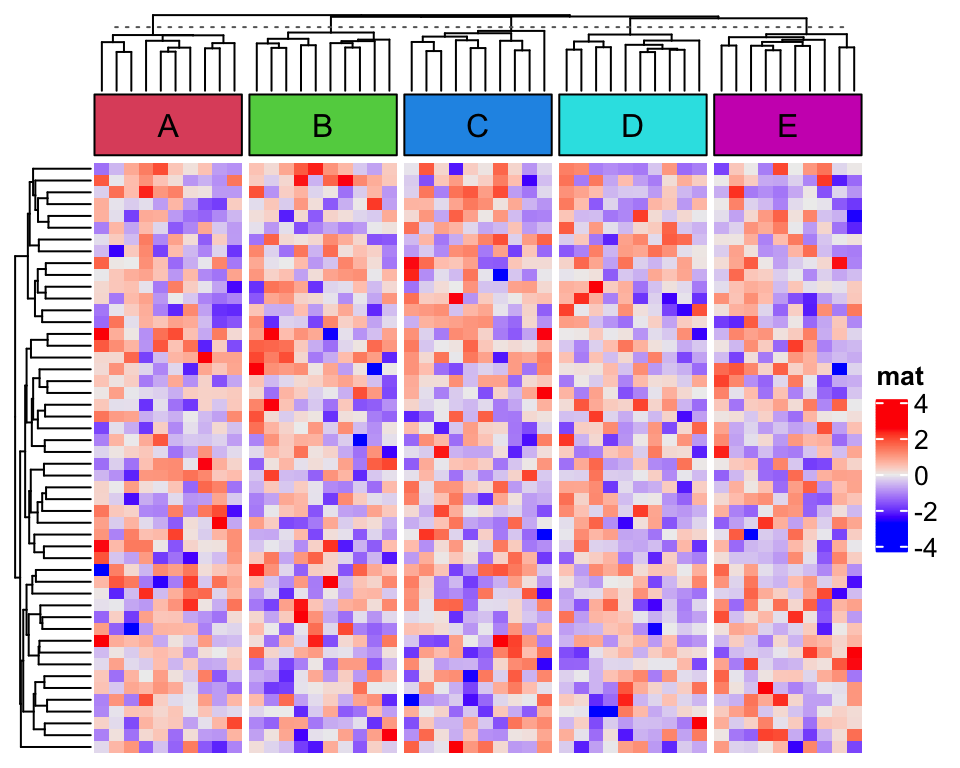
Currently, it is difficult to directly support it in anno_block(), however,
there is workaround for it. Actually, to draw rectangles across several
slices, we need to know two things: 1. the positions of the slices in the
plot, and 2. space to draw the rectangles. Luckily, the positions can be
obtained by directly go to the correspoding viewport and the space can be
allocated by anno_empty() function.
In the following code, we use anno_empty() to create an empty annotation:
ha = HeatmapAnnotation(
    empty = anno_empty(border = FALSE),
    foo = anno_block(gp = gpar(fill = 2:6), labels = LETTERS[1:5])
)
Heatmap(mat, name = "mat", column_split = split, top_annotation = ha,
    column_title = NULL)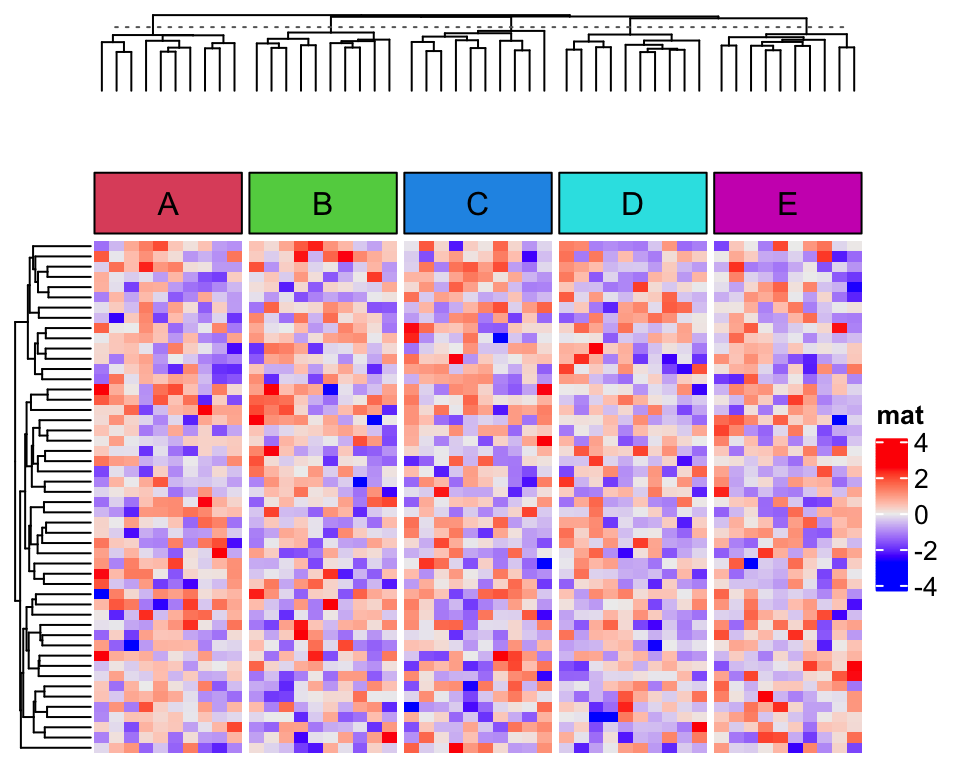
Let’s say, we want to put the first three column slices as a group and the last two slices as the second group.
The positions of the first and the third slicesm for annotation "empty" can be obtained by:
seekViewport("annotation_empty_1")
loc1 = deviceLoc(x = unit(0, "npc"), y = unit(0, "npc"))
seekViewport("annotation_empty_3")
loc2 = deviceLoc(x = unit(1, "npc"), y = unit(1, "npc"))
loc2
## $x
## [1] 4.07350393700788inches
##
## $y
## [1] 6.50787401574803inchesThe viewport name "annotation_empty_1" correspond to the first slice for
annotation empty, and we take the left bottom of the first “empty”
annotation slice and the top right of the third slice, saved in loc1 and
loc2 variables.
Here what is important is the use of grid::deviceLoc() function. It directly
converts a location measured in a certain viewport to the position in
the graphics device.
In the end, we go to the "global" viewport because the size of "global"
viewport is the size of the graphics device, and draw the rectangle and add
label.
seekViewport("global")
grid.rect(loc1$x, loc1$y, width = loc2$x - loc1$x, height = loc2$y - loc1$y,
    just = c("left", "bottom"), gp = gpar(fill = "red"))
grid.text("group 1", x = (loc1$x + loc2$x)*0.5, y = (loc1$y + loc2$y)*0.5)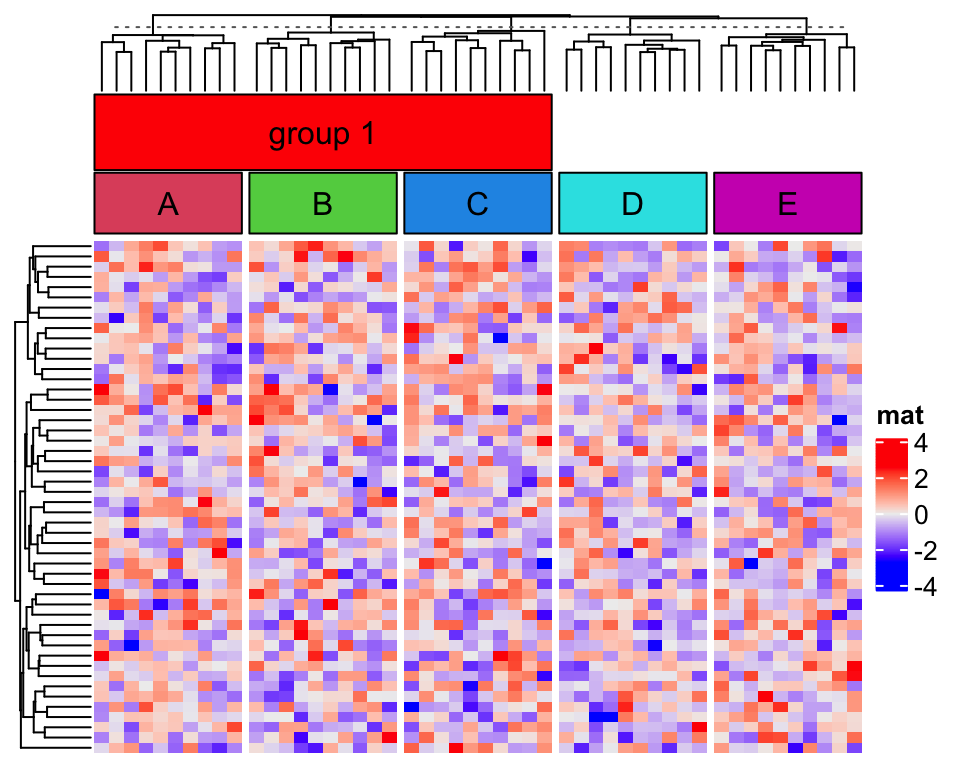
The viewport names for the annotations are in a fixed format, which is
annotation_{annotation_name}_{slice_index}. The full set of viewport names
can be obtained by list_components() function.
list_components()## [1] "ROOT" "global"
## [3] "global_layout" "global-heatmaplist"
## [5] "main_heatmap_list" "heatmap_mat"
## [7] "mat_heatmap_body_wrap" "mat_heatmap_body_1_1"
## [9] "mat_heatmap_body_1_2" "mat_heatmap_body_1_3"
## [11] "mat_heatmap_body_1_4" "mat_heatmap_body_1_5"
## [13] "mat_dend_row_1" "mat_dend_column_1"
## [15] "mat_dend_column_2" "mat_dend_column_3"
## [17] "mat_dend_column_4" "mat_dend_column_5"
## [19] "annotation_empty_1" "annotation_foo_1"
## [21] "annotation_empty_2" "annotation_foo_2"
## [23] "annotation_empty_3" "annotation_foo_3"
## [25] "annotation_empty_4" "annotation_foo_4"
## [27] "annotation_empty_5" "annotation_foo_5"
## [29] "global-heatmap_legend_right" "heatmap_legend"If more than one group-level rectangles are to be added, we can wrap the code
into a simple function group_block_anno():
ha = HeatmapAnnotation(
empty = anno_empty(border = FALSE, height = unit(8, "mm")),
foo = anno_block(gp = gpar(fill = 2:6), labels = LETTERS[1:5])
)
Heatmap(mat, name = "mat", column_split = split, top_annotation = ha,
column_title = NULL)
group_block_anno = function(group, empty_anno, gp = gpar(),
label = NULL, label_gp = gpar()) {
seekViewport(qq("annotation_@{empty_anno}_@{min(group)}"))
loc1 = deviceLoc(x = unit(0, "npc"), y = unit(0, "npc"))
seekViewport(qq("annotation_@{empty_anno}_@{max(group)}"))
loc2 = deviceLoc(x = unit(1, "npc"), y = unit(1, "npc"))
seekViewport("global")
grid.rect(loc1$x, loc1$y, width = loc2$x - loc1$x, height = loc2$y - loc1$y,
just = c("left", "bottom"), gp = gp)
if(!is.null(label)) {
grid.text(label, x = (loc1$x + loc2$x)*0.5, y = (loc1$y + loc2$y)*0.5, gp = label_gp)
}
}
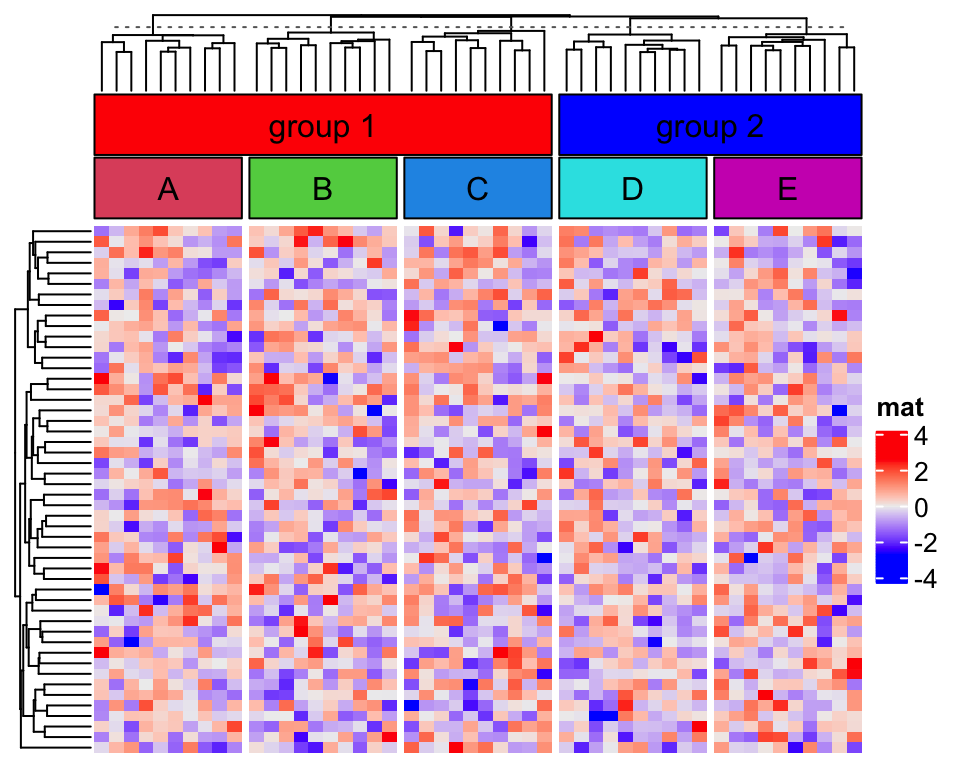
group_block_anno(1:3, "empty", gp = gpar(fill = "red"), label = "group 1")
group_block_anno(4:5, "empty", gp = gpar(fill = "blue"), label = "group 2")