By default, in circlize, the directions of x-axes of all cells are clockwise, which means, in the cells located on top of the circle, the direction of x-axes is from left to right, which fits how we normally read the figures. For example, the following figure shows several tracks with different graphics.
library(circlize)
circos.par(gap.degree = 4)
circos.initialize(letters[1:8], xlim = c(0, 10))
circos.track(ylim = c(0, 10), panel.fun = function(x, y) {
    circos.axis()
    circos.points(0:10, 0:10)
    circos.text(CELL_META$xlim[1] + mm_x(5), CELL_META$ycenter, CELL_META$sector.index, col = "red")
})
circos.track(ylim = c(0, 10), panel.fun = function(x, y) {
    circos.rect(1, 4, 5, 6)
    circos.arrow(6, 9)
})
circos.link("a", 1, "c", 9)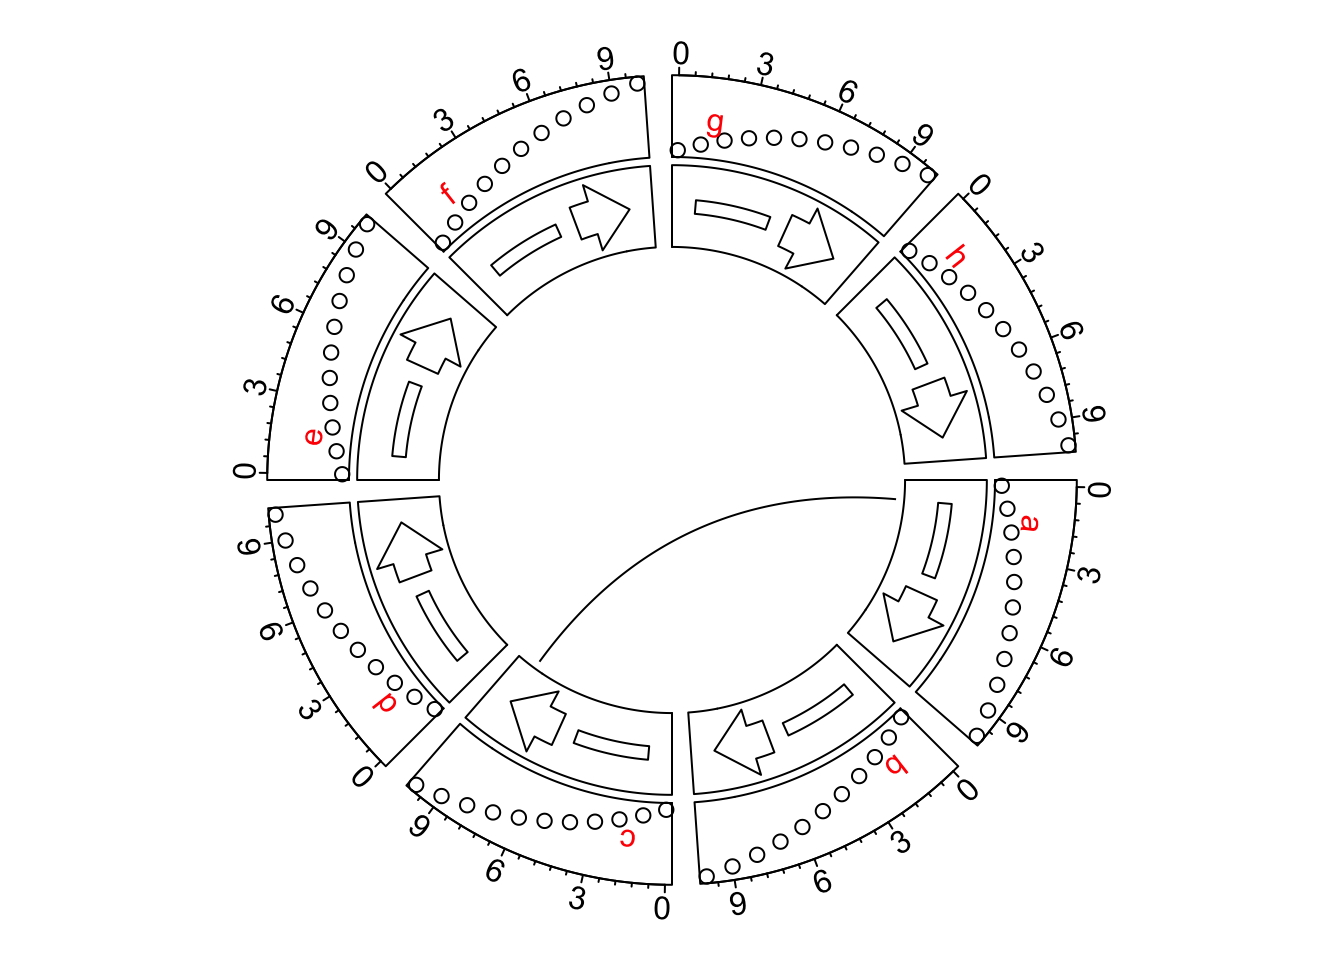
circos.clear()However, some users might want the axes in the other direction, like the request here. The solution was to manually reverse the x-axes by defining a rev_x() function.
Then all positions related to x-axes should be wrapped by rev_x().
rev_x = function(x, sector.index = NULL) {
    if(!is.null(sector.index)) set.current.cell(sector.index, 1)

    xrange = CELL_META$xlim
    xrange[2] - x + xrange[1]
}
circos.par(gap.degree = 4)
circos.initialize(letters[1:8], xlim = c(0, 10))
circos.track(ylim = c(0, 10), panel.fun = function(x, y) {
    circos.axis(major.at = rev_x(seq(0, 10, by = 2)), labels = seq(0, 10, by = 2))
    circos.points(rev_x(0:10), 0:10)
    circos.text(rev_x(CELL_META$xlim[1] + mm_x(5)), CELL_META$ycenter, CELL_META$sector.index, col = "red")
})
circos.track(ylim = c(0, 10), panel.fun = function(x, y) {
    circos.rect(rev_x(1), 4, rev_x(5), 6)
    circos.arrow(rev_x(6), rev_x(9))
})
circos.link("a", rev_x(1, "a"), "c", rev_x(9, "c"))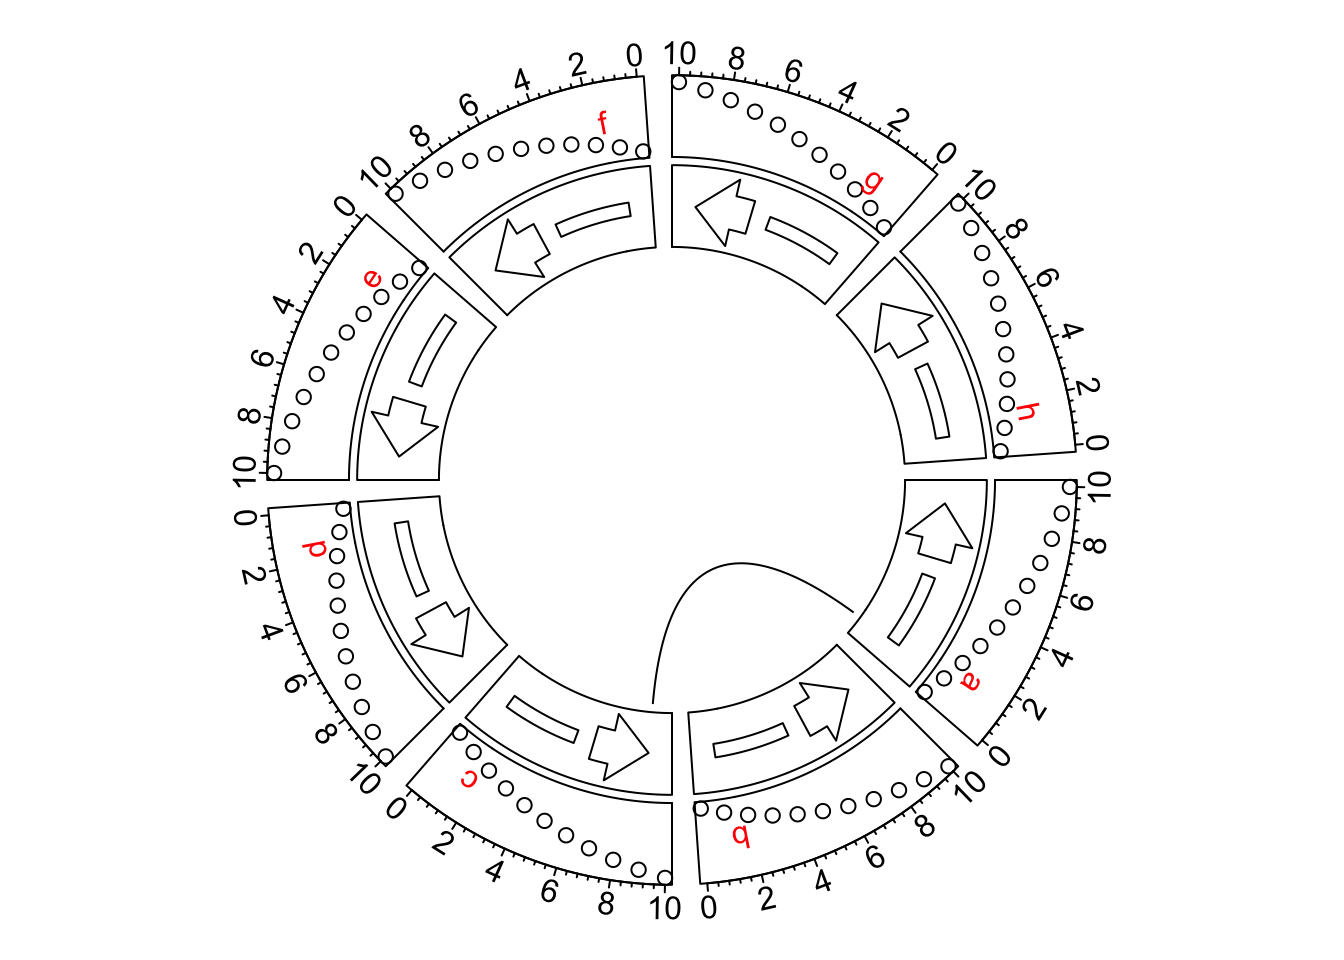
circos.clear()This might be painful if there are so many positions on x-axes to adjust. From circlize 0.4.11. I have added
a new global option xaxis.clock.wise to globally control the directions of x-axes. The xaxis.clock.wise
option should be called by circos.par() and should be called before the circular plot is initialized.
See the following example. It is super easy to reverse all x-axes now.
circos.par(gap.degree = 4, xaxis.clock.wise = FALSE)
circos.initialize(letters[1:8], xlim = c(0, 10))
circos.track(ylim = c(0, 10), panel.fun = function(x, y) {
    circos.axis()
    circos.points(0:10, 0:10)
    circos.text(CELL_META$xlim[1] + mm_x(5), CELL_META$ycenter, CELL_META$sector.index, col = "red")
})
circos.track(ylim = c(0, 10), panel.fun = function(x, y) {
    circos.rect(1, 4, 5, 6)
    circos.arrow(6, 9)
})
circos.link("a", 1, "c", 9)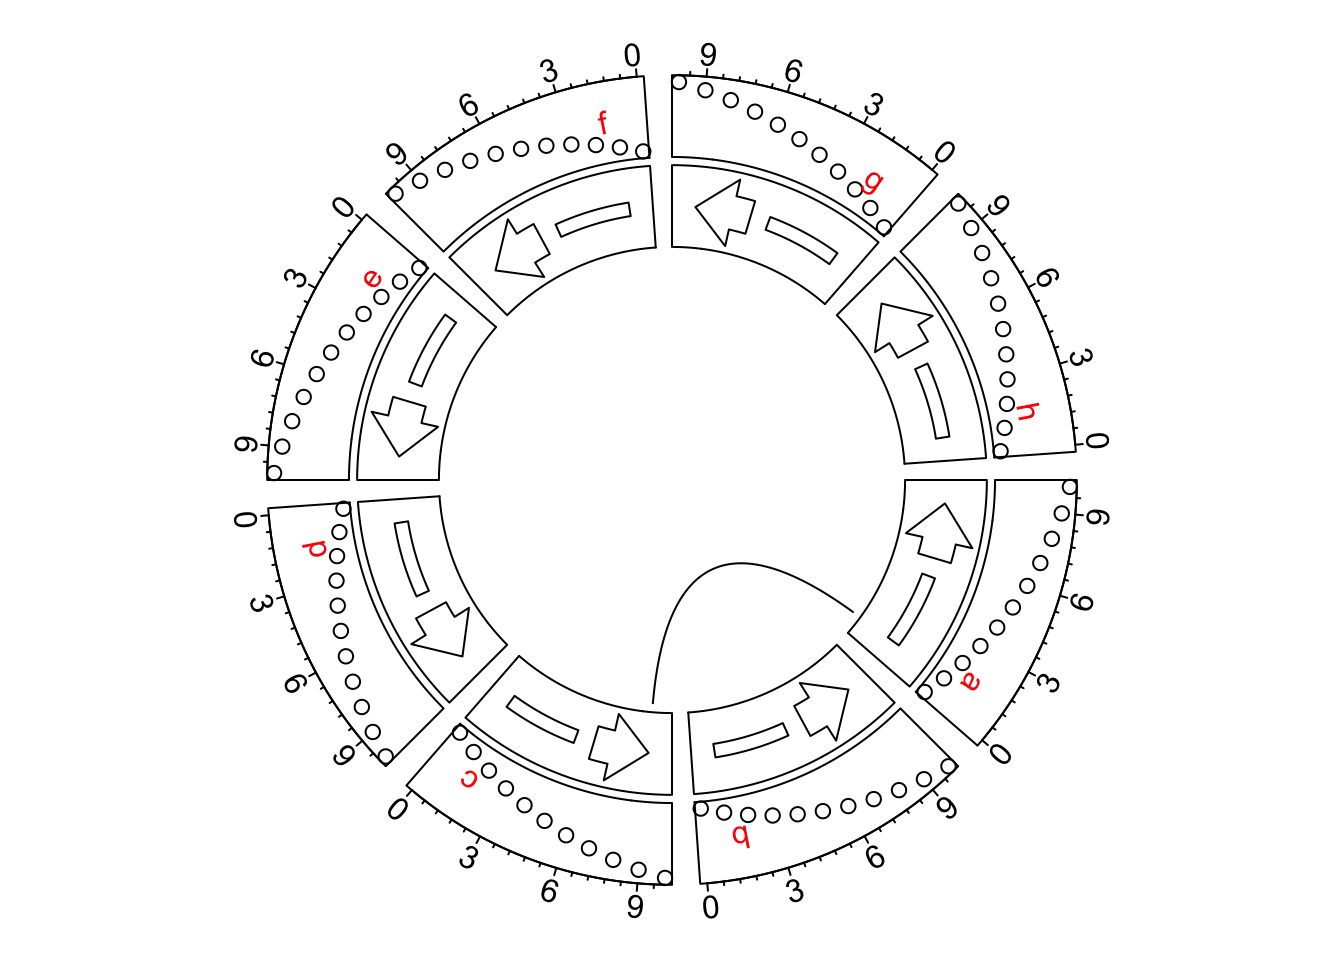
circos.clear()Setting circos.par(xaxis.clock.wise = FALSE) reverses all positions on x-direction. Following is a genomic
circular plot with and without reversing x-axes. As you can see, the code for making the plot are exactly the same.
The only difference is in the second plot, we change the direction of x-axes by setting circos.par(xaxis.clock.wise = FALSE).
load(system.file(package = "circlize", "extdata", "DMR.RData"))
bed_list = list(DMR_hyper, DMR_hypo)

par(mfrow = c(1, 2))
circos.initializeWithIdeogram()
circos.genomicRainfall(bed_list, pch = 16, cex = 0.4, col = c("#FF000080", "#0000FF80"))
circos.genomicDensity(DMR_hyper, col = c("#FF000080"), track.height = 0.1)
circos.genomicDensity(DMR_hypo, col = c("#0000FF80"), track.height = 0.1)
circos.clear()

circos.par(xaxis.clock.wise = FALSE)
circos.initializeWithIdeogram()
circos.genomicRainfall(bed_list, pch = 16, cex = 0.4, col = c("#FF000080", "#0000FF80"))
circos.genomicDensity(DMR_hyper, col = c("#FF000080"), track.height = 0.1)
circos.genomicDensity(DMR_hypo, col = c("#0000FF80"), track.height = 0.1)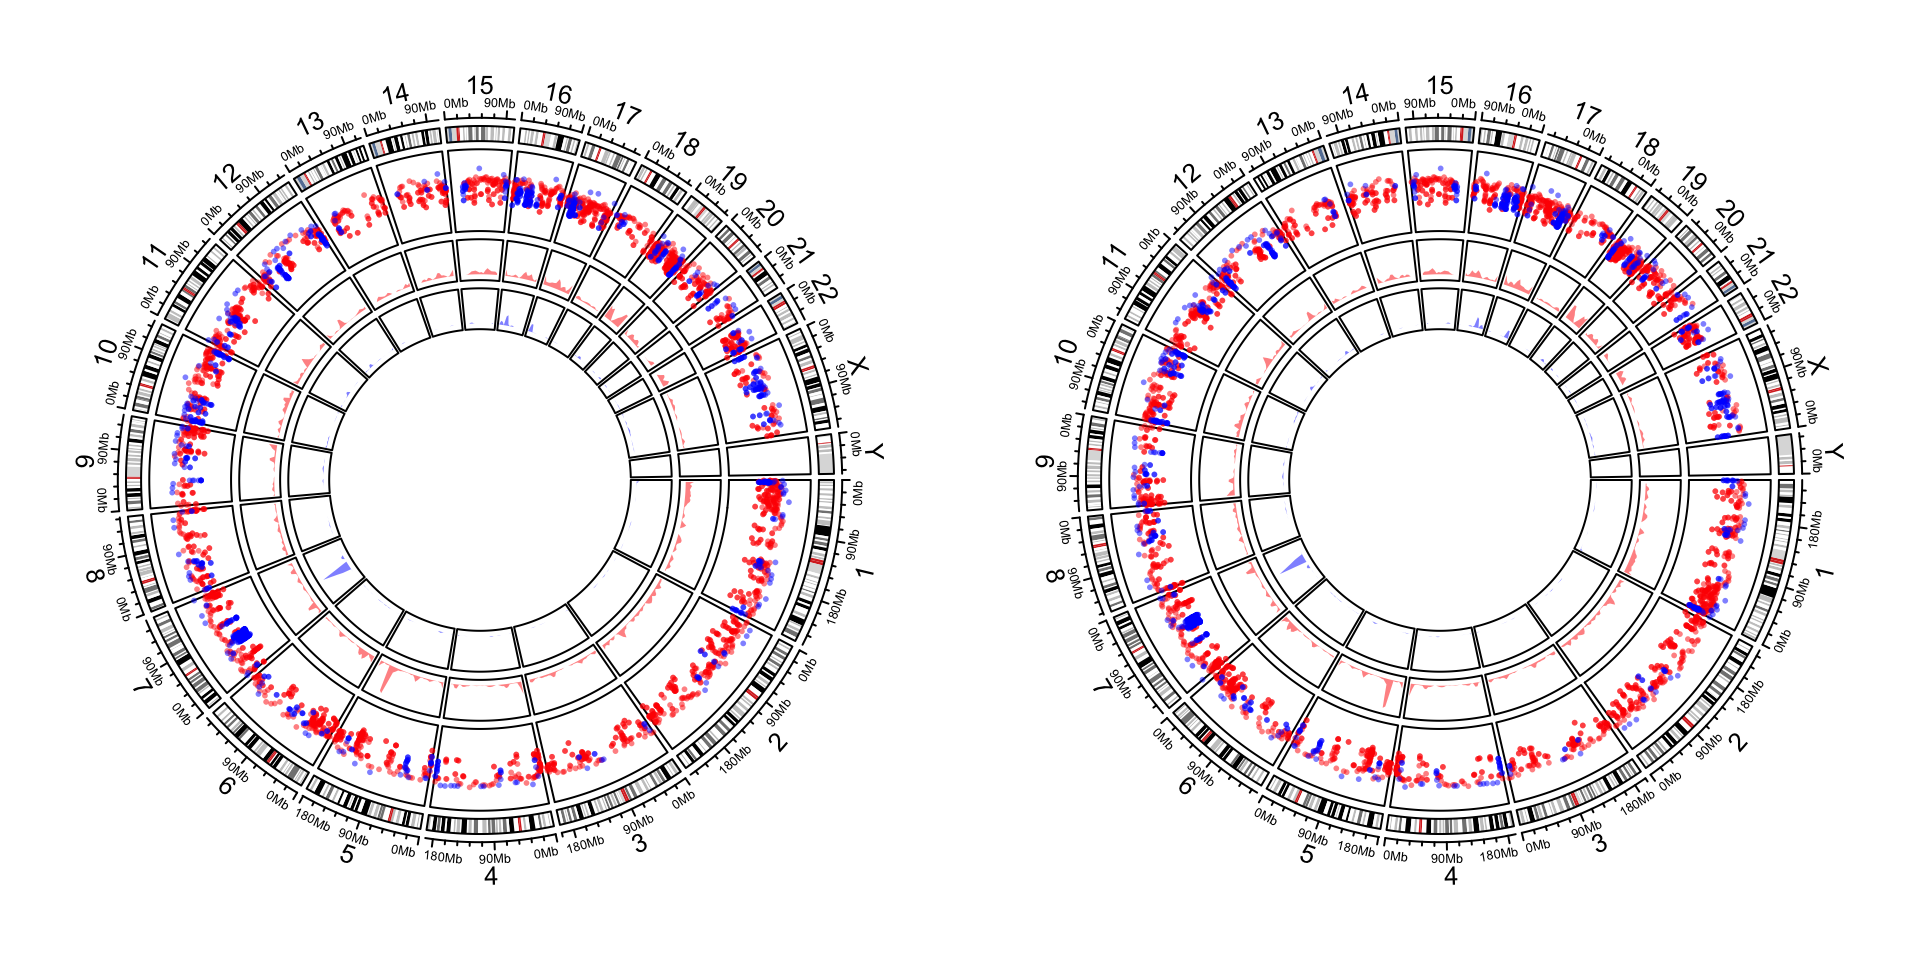
circos.clear()We show a second genomic circular plot which visualizes all transcripts of three genes. We first define
a draw_tx() function which draws the plot and we will use it twice.
draw_tx = function() {
    tp_family = readRDS(system.file(package = "circlize", "extdata", "tp_family_df.rds"))
    circos.genomicInitialize(tp_family)
    circos.track(ylim = c(0, 1),
        bg.col = c("#FF000040", "#00FF0040", "#0000FF40"),
        bg.border = NA, track.height = 0.05)
    n = max(tapply(tp_family$transcript, tp_family$gene, function(x) length(unique(x))))
    circos.genomicTrack(tp_family, ylim = c(0.5, n + 0.5),
        panel.fun = function(region, value, ...) {
            all_tx = unique(value$transcript)
            for(i in seq_along(all_tx)) {
                l = value$transcript == all_tx[i]
                # for each transcript
                current_tx_start = min(region[l, 1])
                current_tx_end = max(region[l, 2])
                circos.lines(c(current_tx_start, current_tx_end),
                    c(n - i + 1, n - i + 1), col = "#CCCCCC")
                circos.genomicRect(region[l, , drop = FALSE], ytop = n - i + 1 + 0.4,
                    ybottom = n - i + 1 - 0.4, col = "orange", border = NA)
            }
    }, bg.border = NA, track.height = 0.4)
}
And we make the plot:
par(mfrow = c(1, 2))
draw_tx()
circos.clear()

circos.par(xaxis.clock.wise = FALSE)
draw_tx()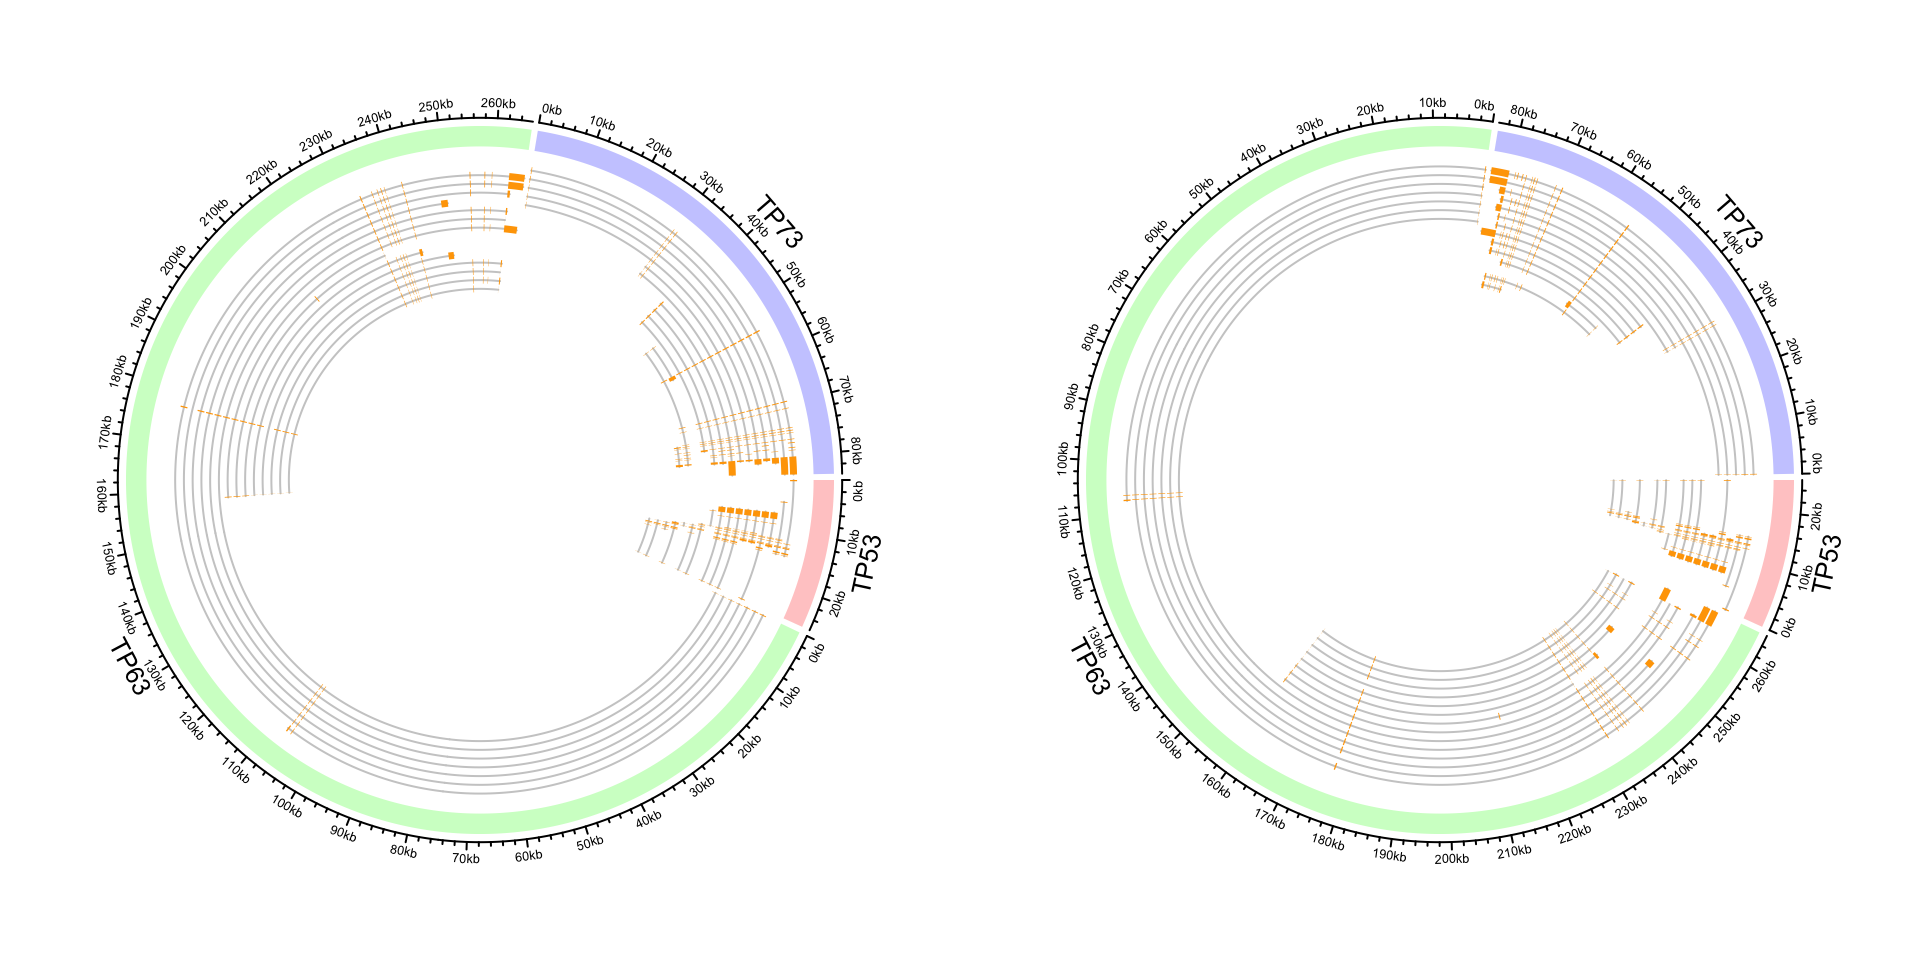
circos.clear()If the reversing of x-axes is not applied globally, but rather a subset of cells, rev_x() should
be manually applied to those cells where x-axes are reversed. In the following example, we only reverse
the x-axis in the top cell.
circos.par(gap.degree = 5)
circos.initialize(letters[1:2], xlim = c(0, 10))
circos.track(ylim = c(0, 10))
circos.arrow(1, 9, sector.index = "a")
circos.axis(major.at = seq(0, 10, by = 2), sector.index = "a")

circos.arrow(rev_x(1), rev_x(9), sector.index = "b")
circos.axis(major.at = rev_x(seq(0, 10, by = 2)), labels = seq(0, 10, by = 2), sector.index = "b")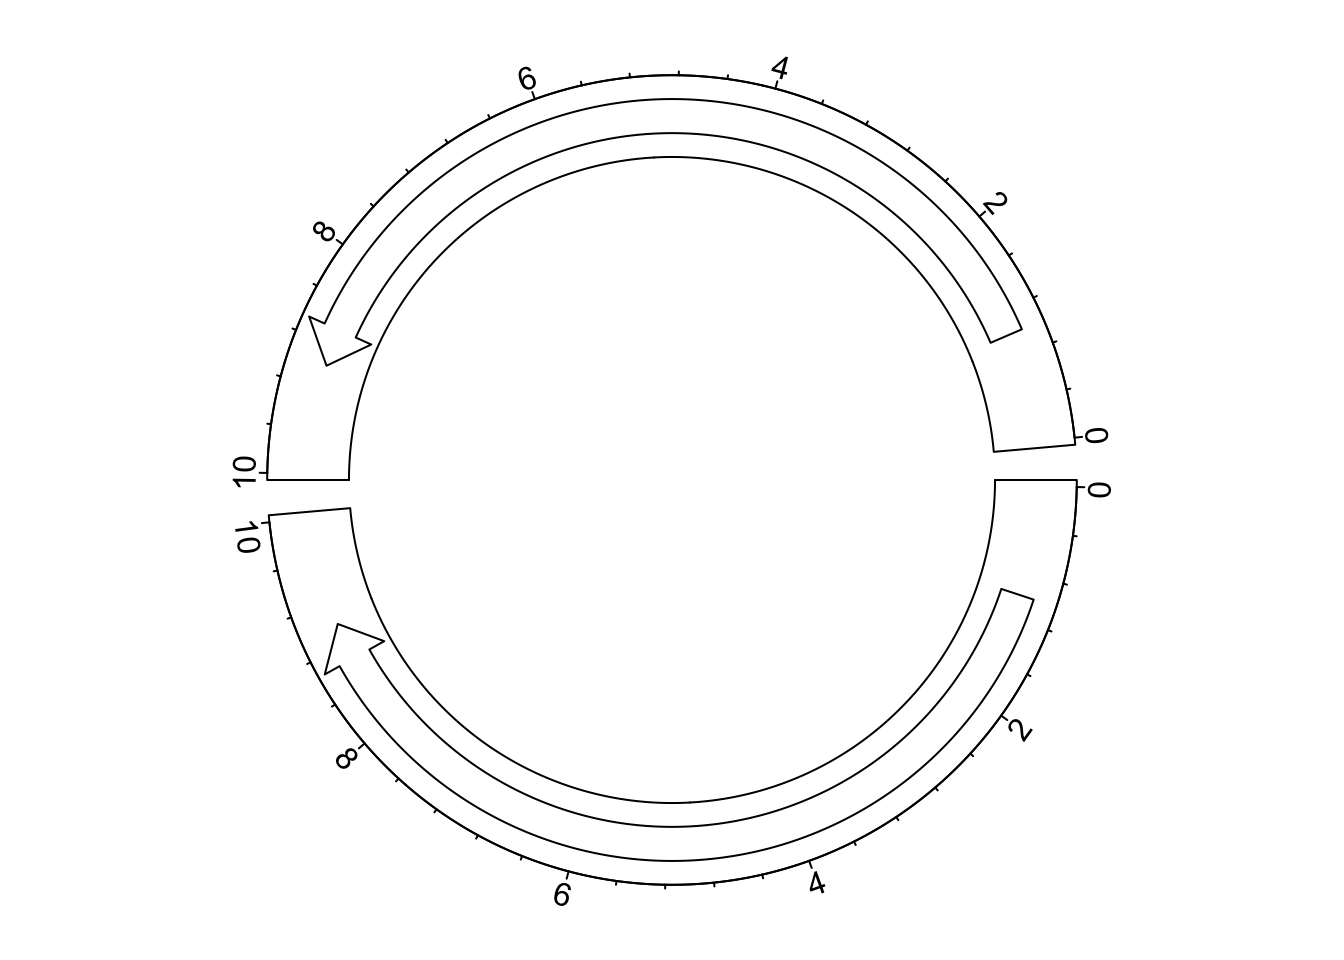
circos.clear()