In this blog post, the author demonstrated how to visualize the traffic loads with Sankey diagram. It looks very nice and here I implemente it with Chord diagram.
Following data frame contains data for the traffic loads, which is basically the number of vehicles that travel through every two directions.
df = read.table(textConnection(
"B A 1000
C A 5000
D A 690
A B 2200
C B 1240
D B 5000
A C 5000
B C 2400
D C 2000
A D 2000
B D 3000
C D 3000
"))
The colors for the four directions:
grid_col = c(
    A = "#FFD701",
    B = "#4169E1",
    C = "#32CC32",
    D = "#FE6500"
)
The order of sectors that will be drawn in the Chord diagram:
sector_order = c("A", "B", "C", "D")There is one specific condition for the traffic loads diagram that is the sectors of
the four directions should be put orthogonally, i.e. on the exact left, bottom, right and top sides.
To do this, we need to calculate the proper values for start.degree and gap.after for the
circular layout.
Basically just do a little bit of simple math :), calculatd as follows:
# size of sectors, measured by the data
size = sapply(sector_order, function(x) sum(df[df[, 1] == x | df[, 2] == x, 3]))
names(size) = sector_order

gap_total = 180 # This is the total width of gaps, can be self-defined

# size of sectors, measured in degree
sector_size = (360 - gap_total)/sum(size)*size
# the first sector starts from the right side, clock wise
sector_middle = c(180, 90, 0, 270); names(sector_middle) = names(sector_size)

start.degree = sector_middle[1] + sector_size[1]/2
gap.after = c(
    90 - sector_size[1]/2 - sector_size[2]/2,
    90 - sector_size[2]/2 - sector_size[3]/2,
    90 - sector_size[3]/2 - sector_size[4]/2,
    90 - sector_size[4]/2 - sector_size[1]/2
)
Now we put start.degree and gap.after in circos.par() and run chordDiagram():
library(circlize)
circos.par(start.degree = start.degree, gap.after = gap.after)
chordDiagram(df, order = sector_order,
    grid.col = grid_col,
    directional = 1,
    direction.type = c("diffHeight", "arrows"),
    link.arr.type = "big.arrow"
)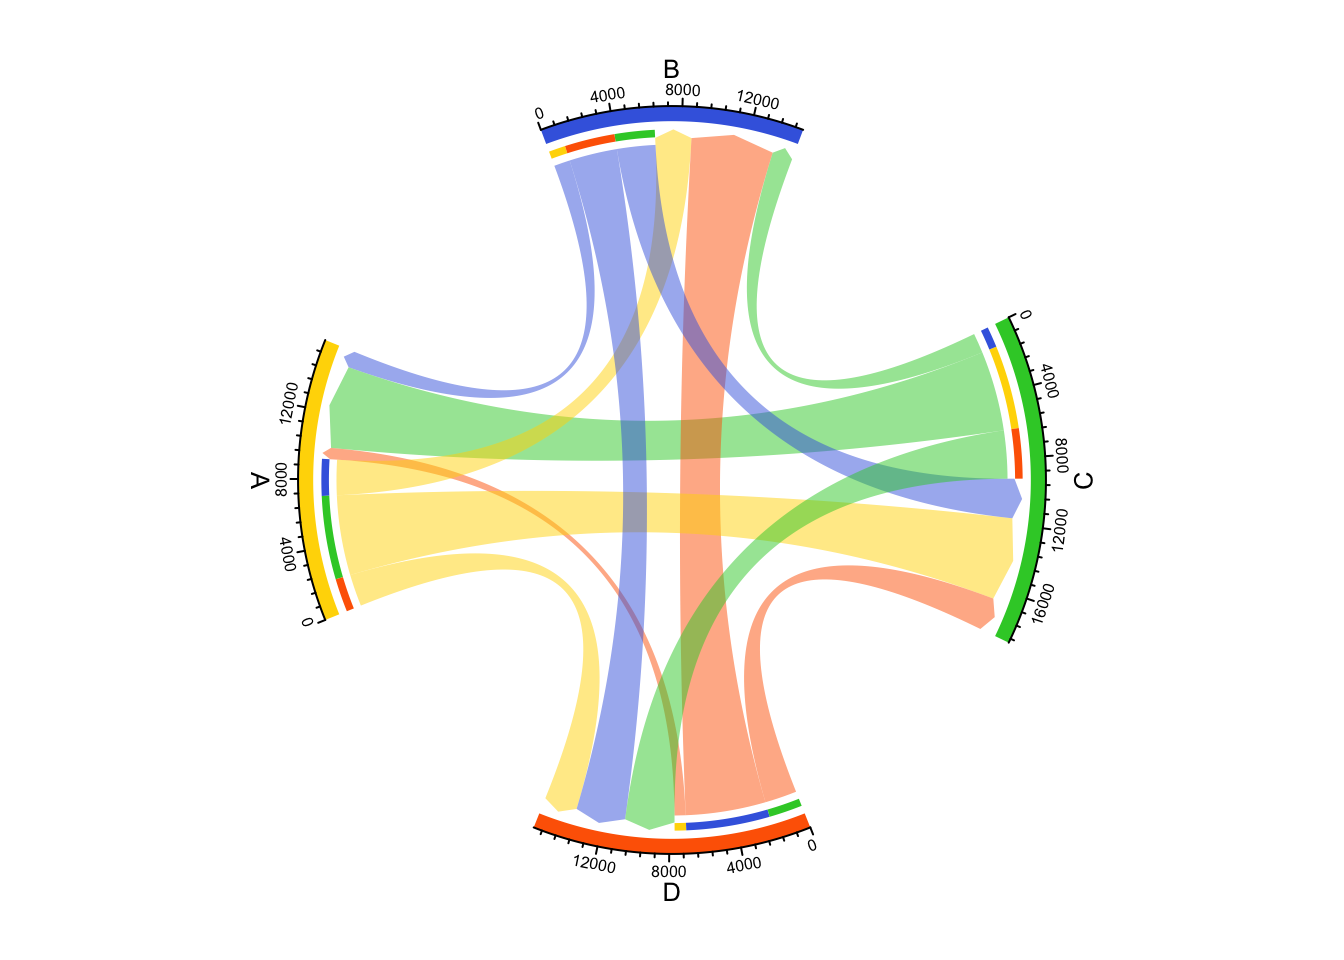
circos.clear()And with some customizations:
circos.par(start.degree = start.degree, gap.after = gap.after)
chordDiagram(df, order = sector_order,
    transparency = 0, link.border = "white",
    grid.col = grid_col,
    directional = 1,
    direction.type = c("diffHeight", "arrows"),
    link.arr.type = "big.arrow"
)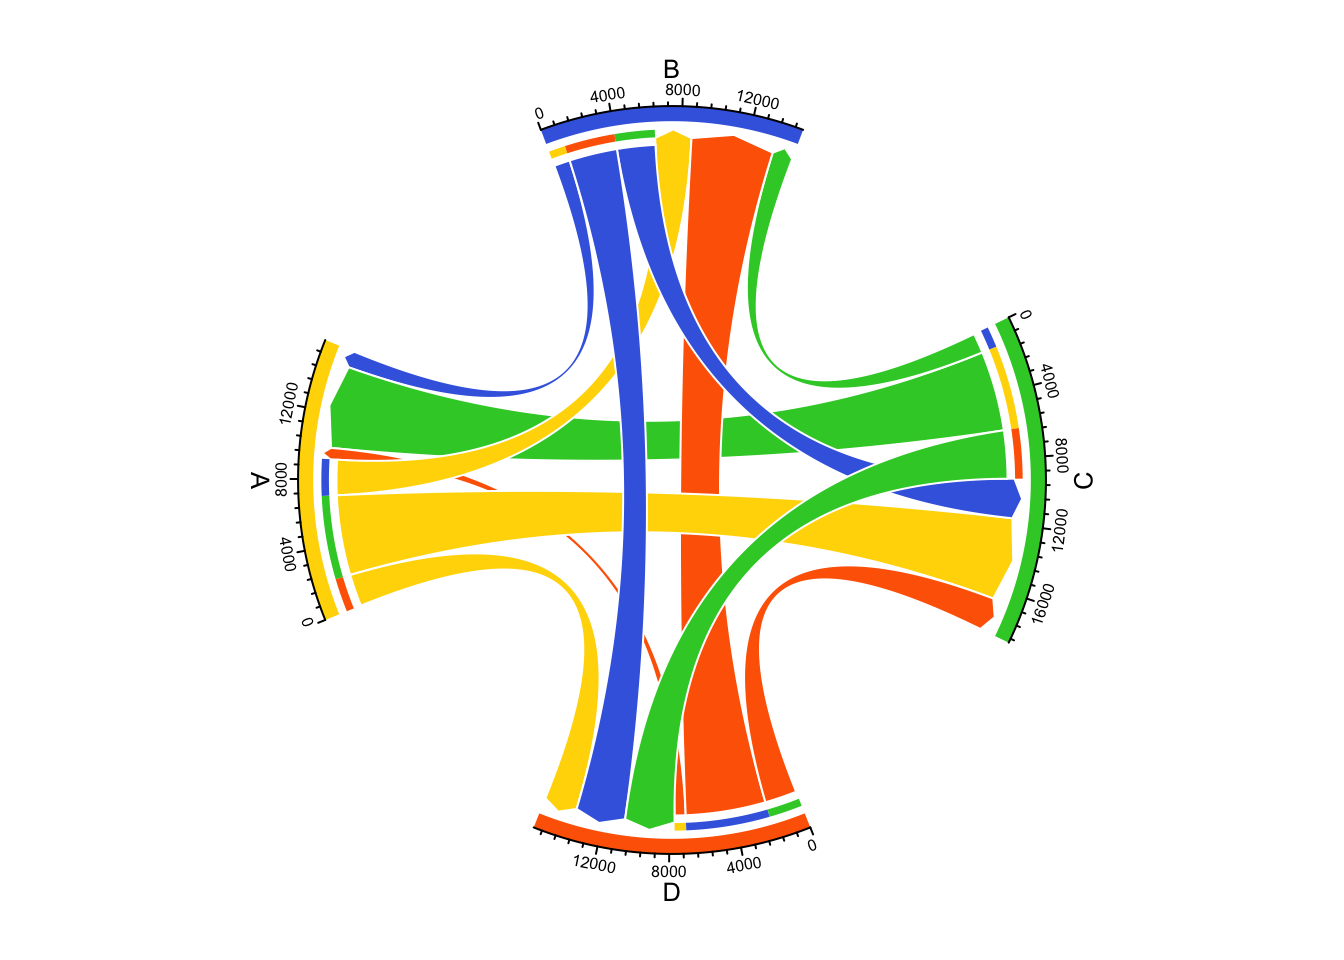
circos.clear()Finally, thanks to @temospena for such an interesting use case.