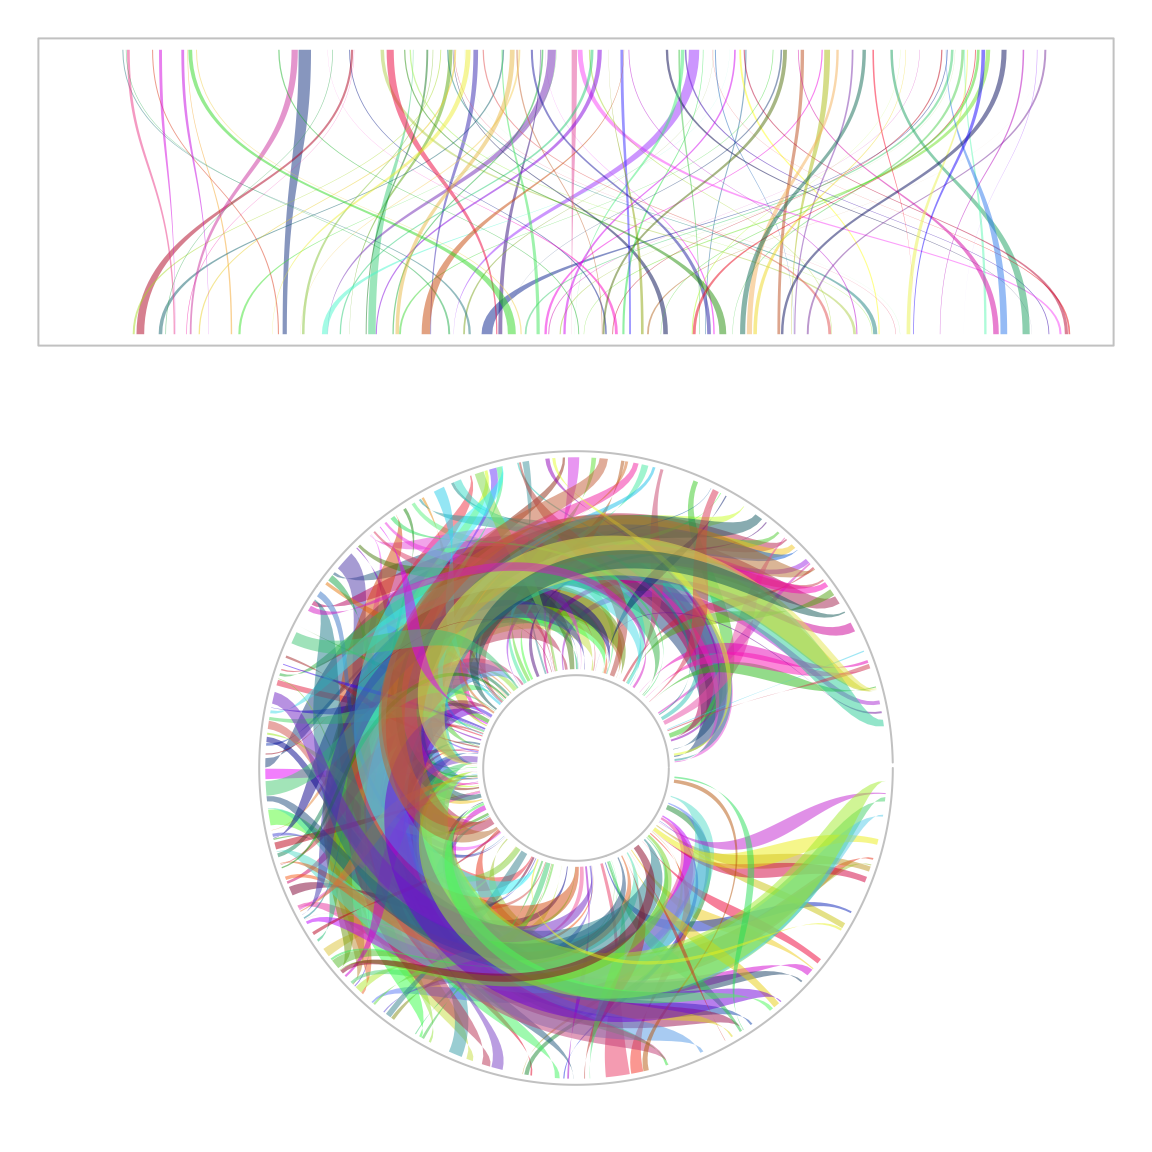
The same set of data and plotting rules, but one is in the normal coordinate system and the other is in the circular-transformed coordinate system.
library(circlize)

par(mar = c(1, 1, 1, 1))
layout(cbind(1:2), heights = c(1, 2))

x0 = runif(1000)
x1 = runif(1000)

plot(NULL, xlim = c(0, 1), ylim = c(0, 1), axes = FALSE, ann = FALSE)
segments(x0, 0, x1, 1, col = rand_color(1000, luminosity = "bright", transparency = 0.75))
box(col = "#CCCCCC")

circos.initialize(c("a"), xlim = c(0, 1))
circos.track(ylim = c(0, 1), track.height = 0.7, bg.border = NA,
    panel.fun = function(x, y) {
    circos.lines(CELL_META$cell.xlim, rep(CELL_META$cell.ylim[1], 2), col = "#CCCCCC")
    circos.lines(CELL_META$cell.xlim, rep(CELL_META$cell.ylim[2], 2), col = "#CCCCCC")

    circos.connect(x0, 0, x1, 1,
        type = "normal", border = NA,
        col = rand_color(1000, luminosity = "bright", transparency = 0.75))
})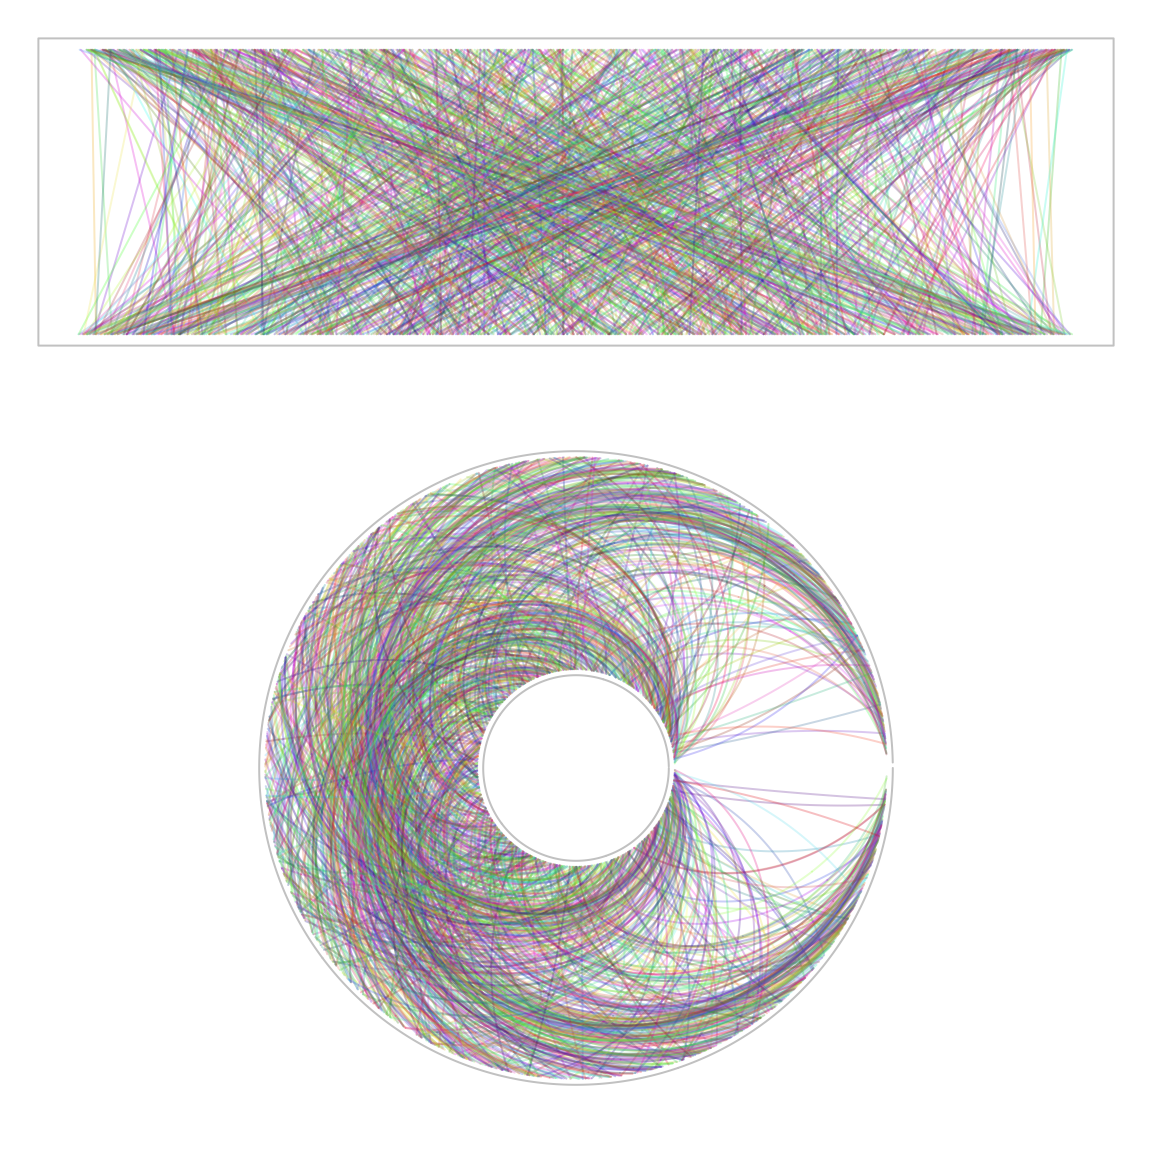
par(mar = c(1, 1, 1, 1))
layout(cbind(1:2), heights = c(1, 2))

x0 = runif(1000)
x1 = runif(1000)
plot(NULL, xlim = c(0, 1), ylim = c(0, 1), axes = FALSE, ann = FALSE)

for (i in 1:1000) {
    pt = circlize:::get_bezier_points(x0[i], 0, x1[i], 1, xlim = c(0, 1), ylim = c(0, 1))
    lines(pt[, 1], pt[, 2], col = rand_color(1, luminosity = "bright", transparency = 0.75))
}
box(col = "#CCCCCC")

circos.initialize(c("a"), xlim = c(0, 1))
circos.track(ylim = c(0, 1), track.height = 0.7, bg.border = NA,
    panel.fun = function(x, y) {
    circos.lines(CELL_META$cell.xlim, rep(CELL_META$cell.ylim[1], 2), col = "#CCCCCC")
    circos.lines(CELL_META$cell.xlim, rep(CELL_META$cell.ylim[2], 2), col = "#CCCCCC")

    circos.connect(x0, 0, x1, 1,
        type = "bezier", border = NA,
        col = rand_color(1000, luminosity = "bright", transparency = 0.75))
})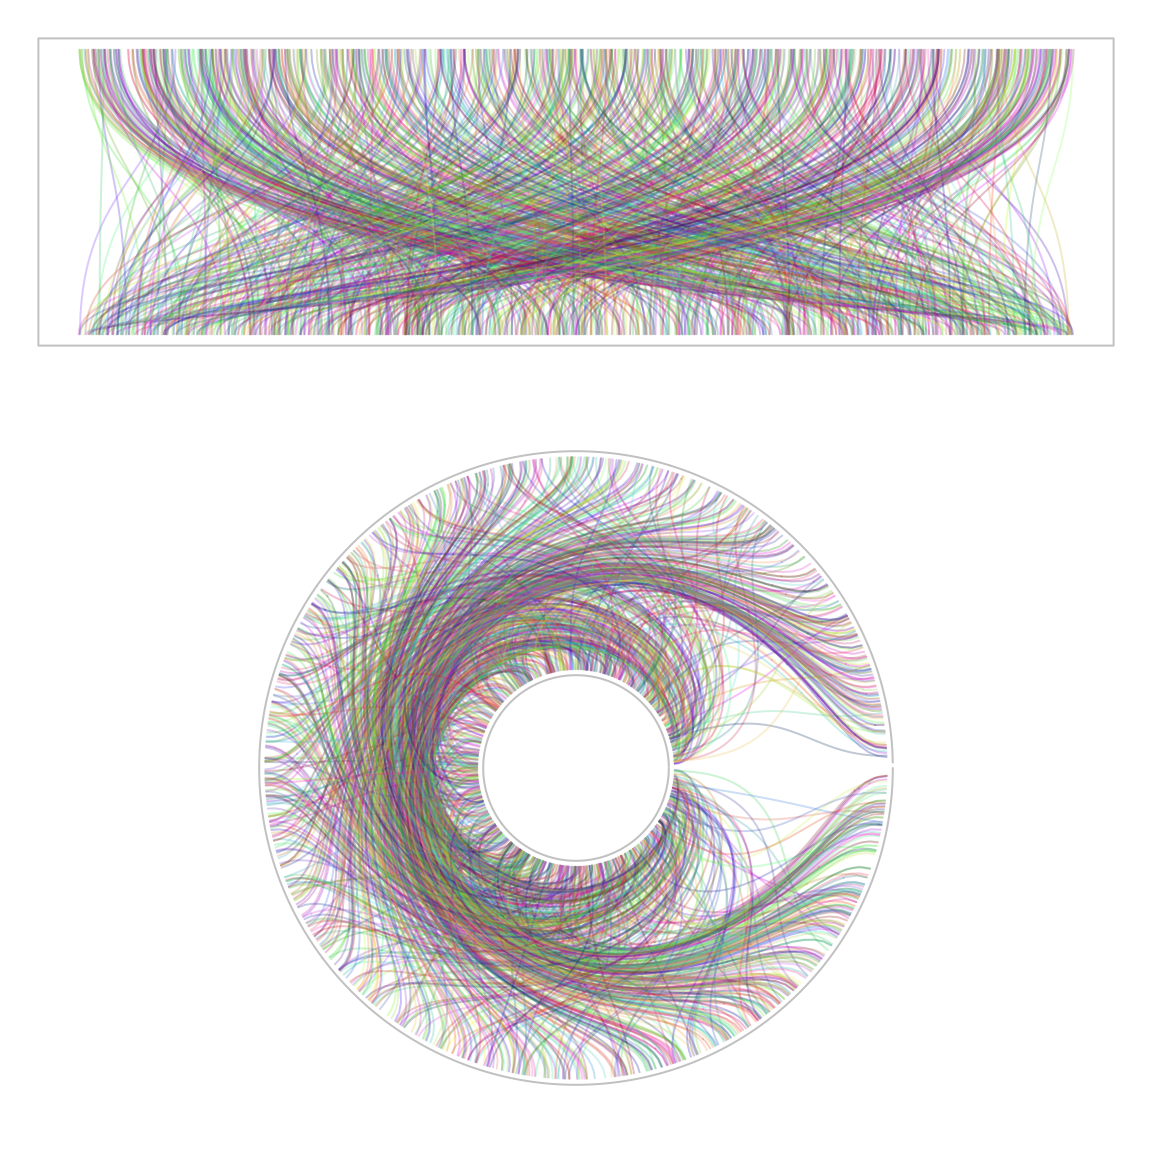
par(mar = c(1, 1, 1, 1))
layout(cbind(1:2), heights = c(1, 2))

x0 = sort(runif(200))
x0 = matrix(x0, ncol = 2, byrow = TRUE)
x1 = sort(runif(200))
x1 = matrix(x1, ncol = 2, byrow = TRUE)

plot(NULL, xlim = c(0, 1), ylim = c(0, 1), axes = FALSE, ann = FALSE)

for (i in 1:100) {
    polygon(c(x0[i, 1], x0[i, 2], x1[i, 2], x1[i, 1]), c(0, 0, 1, 1),
        col = rand_color(1, luminosity = "bright", transparency = 0.5),
        border = NA)
}
box(col = "#CCCCCC")

circos.initialize(c("a"), xlim = c(0, 1))
circos.track(ylim = c(0, 1), track.height = 0.7, bg.border = NA,
    panel.fun = function(x, y) {
    circos.lines(CELL_META$cell.xlim, rep(CELL_META$cell.ylim[1], 2), col = "#CCCCCC")
    circos.lines(CELL_META$cell.xlim, rep(CELL_META$cell.ylim[2], 2), col = "#CCCCCC")

    circos.connect(x0, 0, x1, 1,
        type = "normal", border = NA,
        col = rand_color(100, luminosity = "bright", transparency = 0.5))
})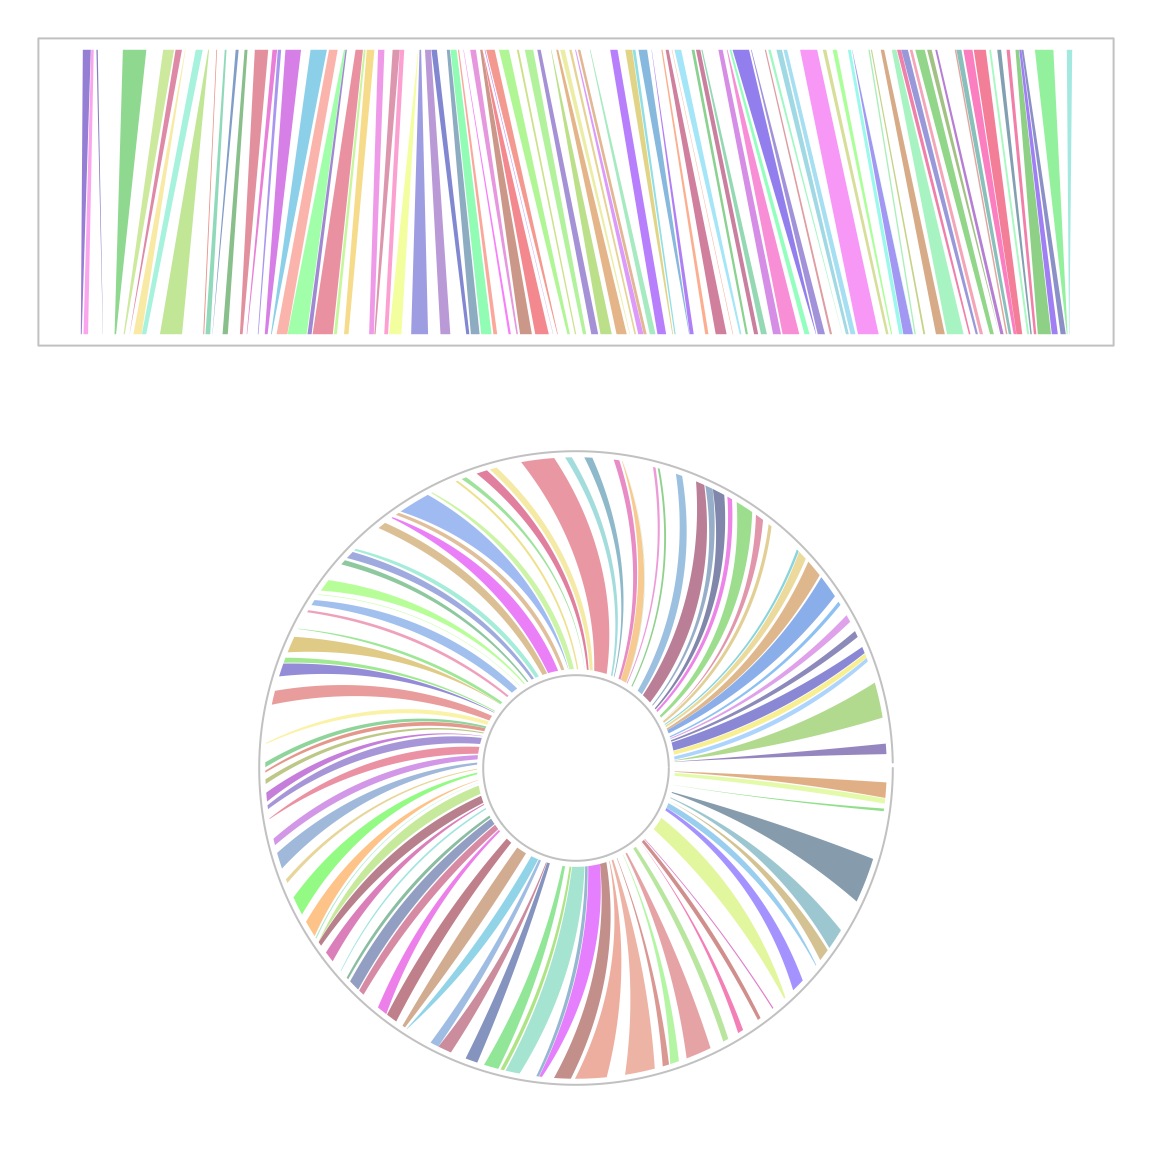
par(mar = c(1, 1, 1, 1))
layout(cbind(1:2), heights = c(1, 2))

x0 = sort(runif(500))
x0 = matrix(x0, ncol = 2, byrow = TRUE)
x0 = x0[sample(nrow(x0), nrow(x0)), ]
x1 = sort(runif(500))
x1 = matrix(x1, ncol = 2, byrow = TRUE)
x1 = x1[sample(nrow(x1), nrow(x1)), ]

l = abs(x0[, 1] - x1[, 1]) < 0.5

x0 = x0[l, ]
x1 = x1[l, ]
plot(NULL, xlim = c(0, 1), ylim = c(0, 1), axes = FALSE, ann = FALSE)

for (i in 1:100) {
    pt1 = circlize:::get_bezier_points(x0[i, 1], 0, x1[i, 1], 1, xlim = c(0, 1), ylim = c(0, 1))
    pt2 = circlize:::get_bezier_points(x0[i, 2], 0, x1[i, 2], 1, xlim = c(0, 1), ylim = c(0, 1))

    polygon(c(x0[i, 1], x0[i, 2], pt2[, 1], rev(pt1[, 1])),
            c(0, 0, pt2[, 2], rev(pt1[, 2])),
        col = rand_color(1, luminosity = "bright", transparency = 0.5),
        border = NA)
}
box(col = "#CCCCCC")

circos.initialize(c("a"), xlim = c(0, 1))
circos.track(ylim = c(0, 1), track.height = 0.7, bg.border = NA,
    panel.fun = function(x, y) {
    circos.lines(CELL_META$cell.xlim, rep(CELL_META$cell.ylim[1], 2), col = "#CCCCCC")
    circos.lines(CELL_META$cell.xlim, rep(CELL_META$cell.ylim[2], 2), col = "#CCCCCC")

    circos.connect(x0, 0, x1, 1,
        type = "bezier", border = NA,
        col = rand_color(nrow(x0), luminosity = "bright", transparency = 0.5))
})