In my previous post “Translate from pheatmap to
ComplexHeatmap”,
I introduced a ComplexHeatmap::pheatmap() which smoothly executes
pheatmap::pheatmap() code without any problem. With the newly developed
InteractiveComplexHeatmap
package, the output of
pheatmap() can be directly exported as an interactive Shiny app.
library(ComplexHeatmap)
ht = pheatmap(...)
library(InteractiveComplexHeatmap)
ht_shiny(ht)
To facilitate the users who are still using heatmap() and heatmap.2()
functions, to make the output of these two functions can be exported as interactive Shiny
apps as well, I implemented two similar translation functions
ComplexHeatmap::heatmap() and ComplexHeatmap::heatmap.2() which use the
same set of arguments as the original functions and generate almost identical
plots.
Some arguments in the two original functions are ignored in the ComplexHeatmap implementation, but there won’t be any error thrown out.
Then with ComplexHeatmap::heatmap() and ComplexHeatmap::heatmap.2(), you
can make your old heatmaps interactive by:
library(ComplexHeatmap)
ht = heatmap(...) # or ht = heatmap.2(...)
library(InteractiveComplexHeatmap)
ht_shiny(ht)
To replace the two original functions with ComplexHeatmap::heatmap() and
ComplexHeatmap::heatmap.2(), we need to make sure the new homonymous
functions generates the same plots as the old ones. In the following examples,
compare_heatmap() basically sends all the arguments to stats::heatmap()
and ComplexHeatmap::heatmap() separately and you can directly compare the
two plots generated by the two functions.
library(ComplexHeatmap)Translate from stats::heatmap()
x  = as.matrix(mtcars)
rc = rainbow(nrow(x), start = 0, end = 0.3)
cc = rainbow(ncol(x), start = 0, end = 0.3)
compare_heatmap(x, col = cm.colors(256), scale = "column",
              RowSideColors = rc, ColSideColors = cc, margins = c(5,10),
              xlab = "specification variables", ylab =  "Car Models",
              main = "heatmap(<Mtcars data>, ..., scale = \"column\")")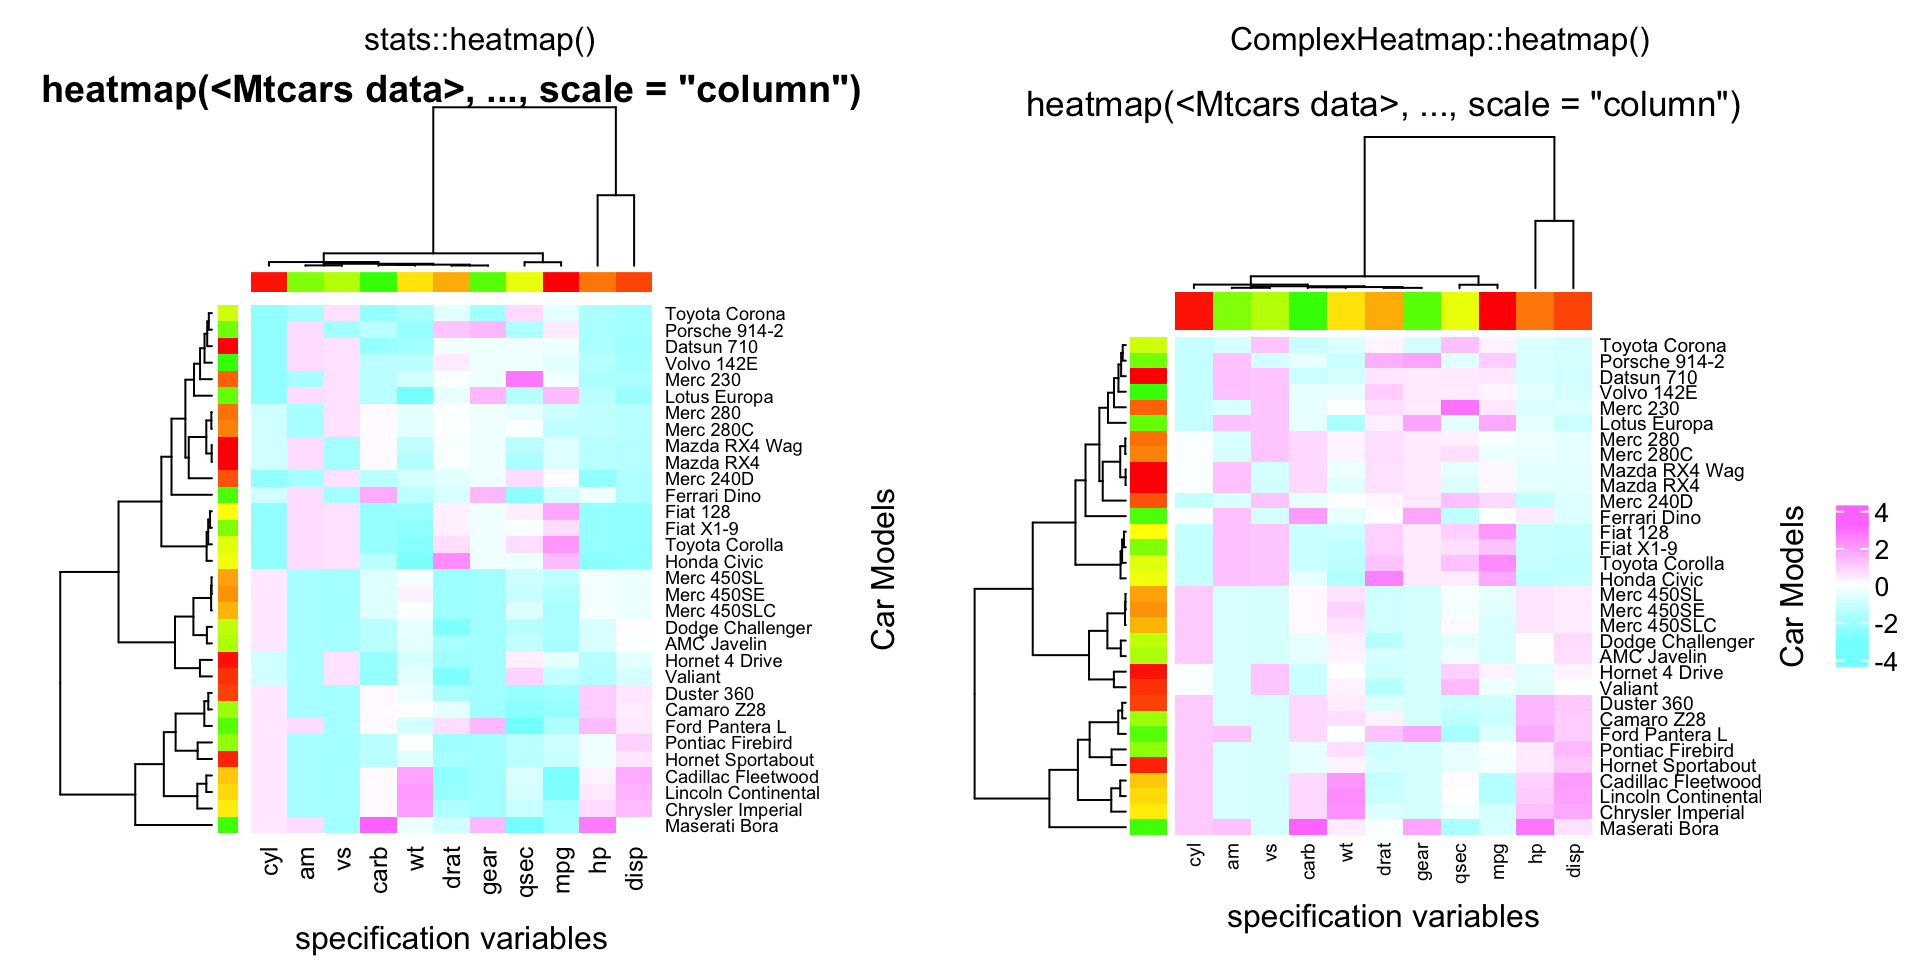
compare_heatmap(x, Colv = NA, col = cm.colors(256), scale = "column",
        RowSideColors = rc, margins = c(5,10),
        xlab = "specification variables", ylab =  "Car Models",
        main = "heatmap(<Mtcars data>, ..., scale = \"column\")")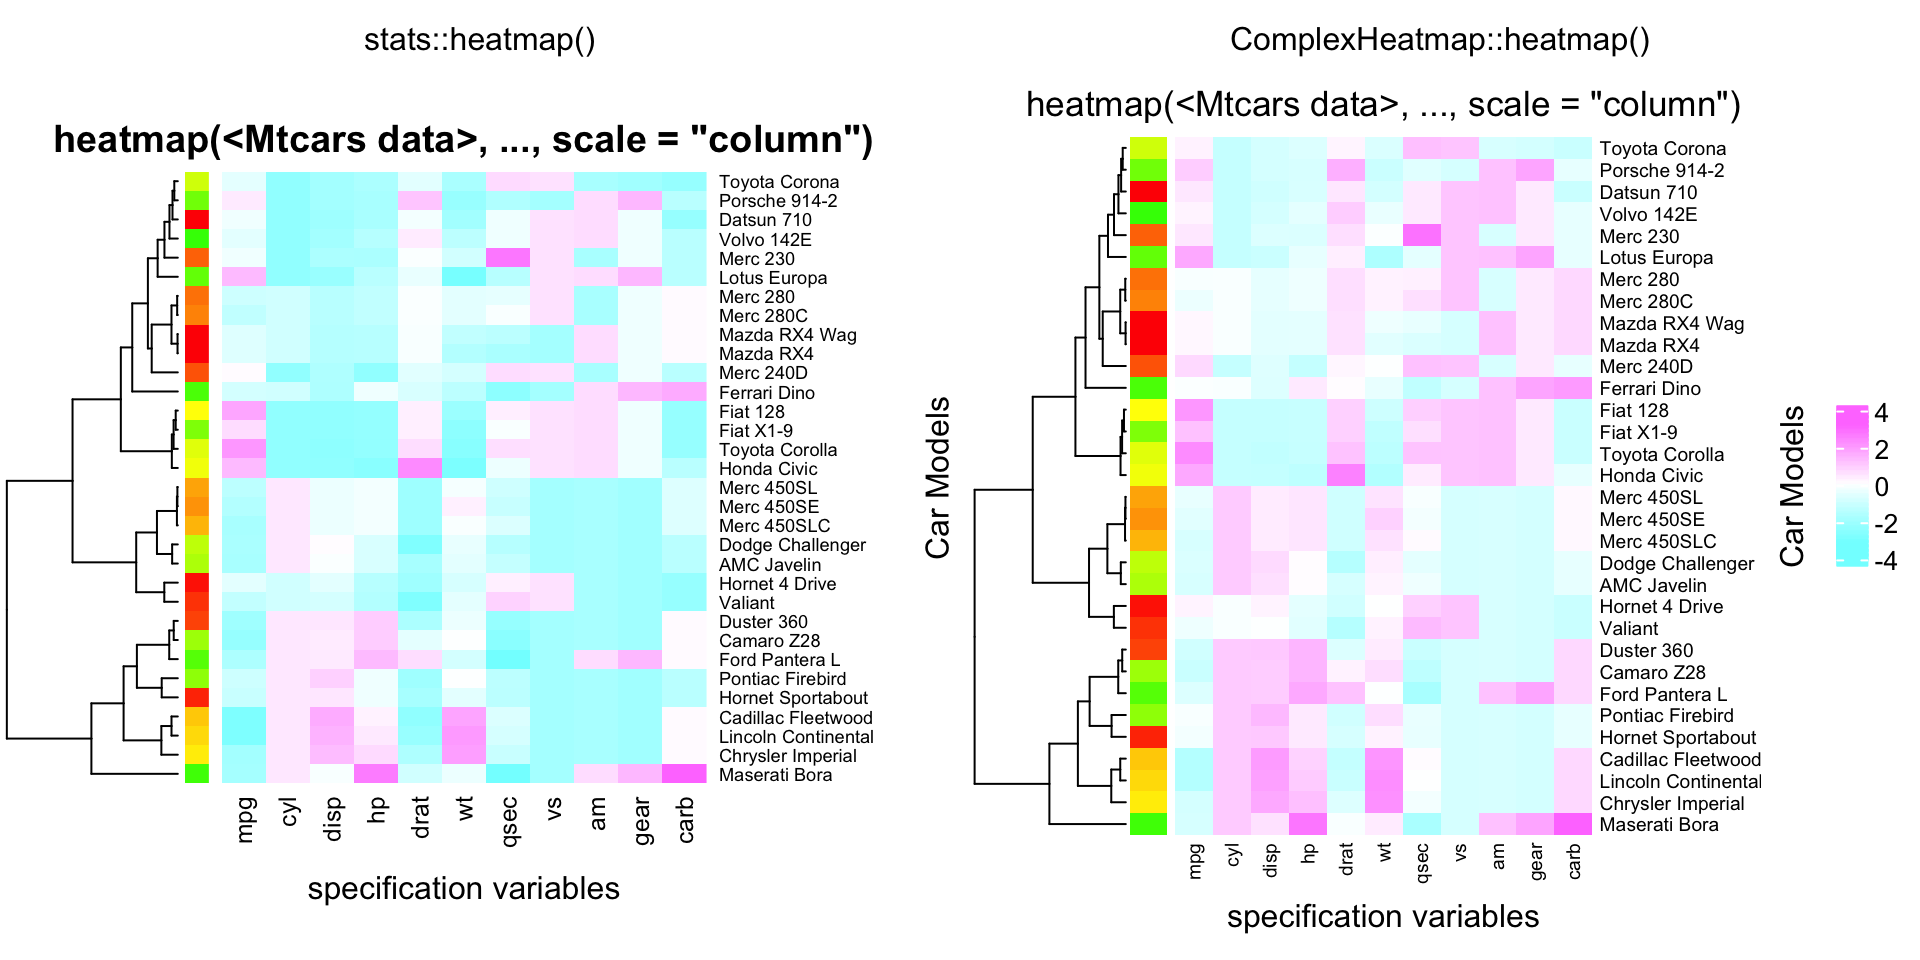
compare_heatmap(x, Rowv = NA, Colv = NA, scale = "column",
        main = "heatmap(*, NA, NA) ~= image(t(x))")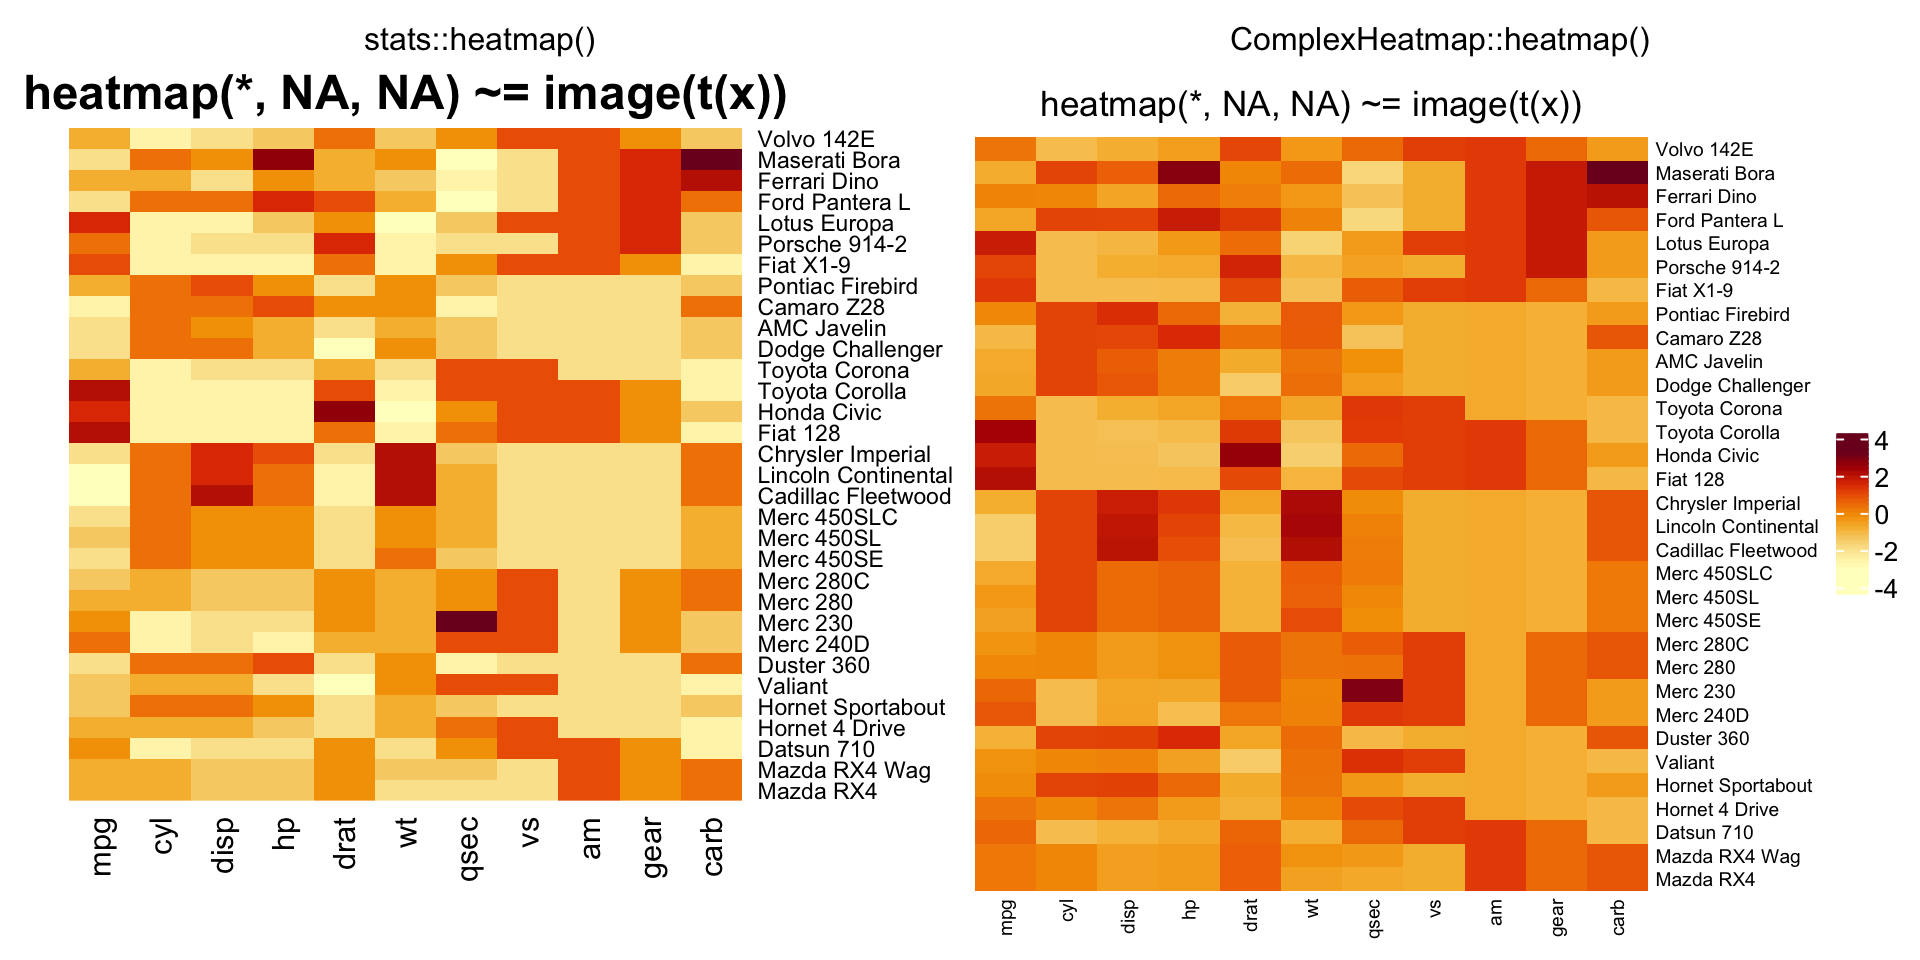
Ca = cor(attitude)
cc = rainbow(nrow(Ca))
compare_heatmap(Ca, Rowv = FALSE, RowSideColors = cc, ColSideColors = cc)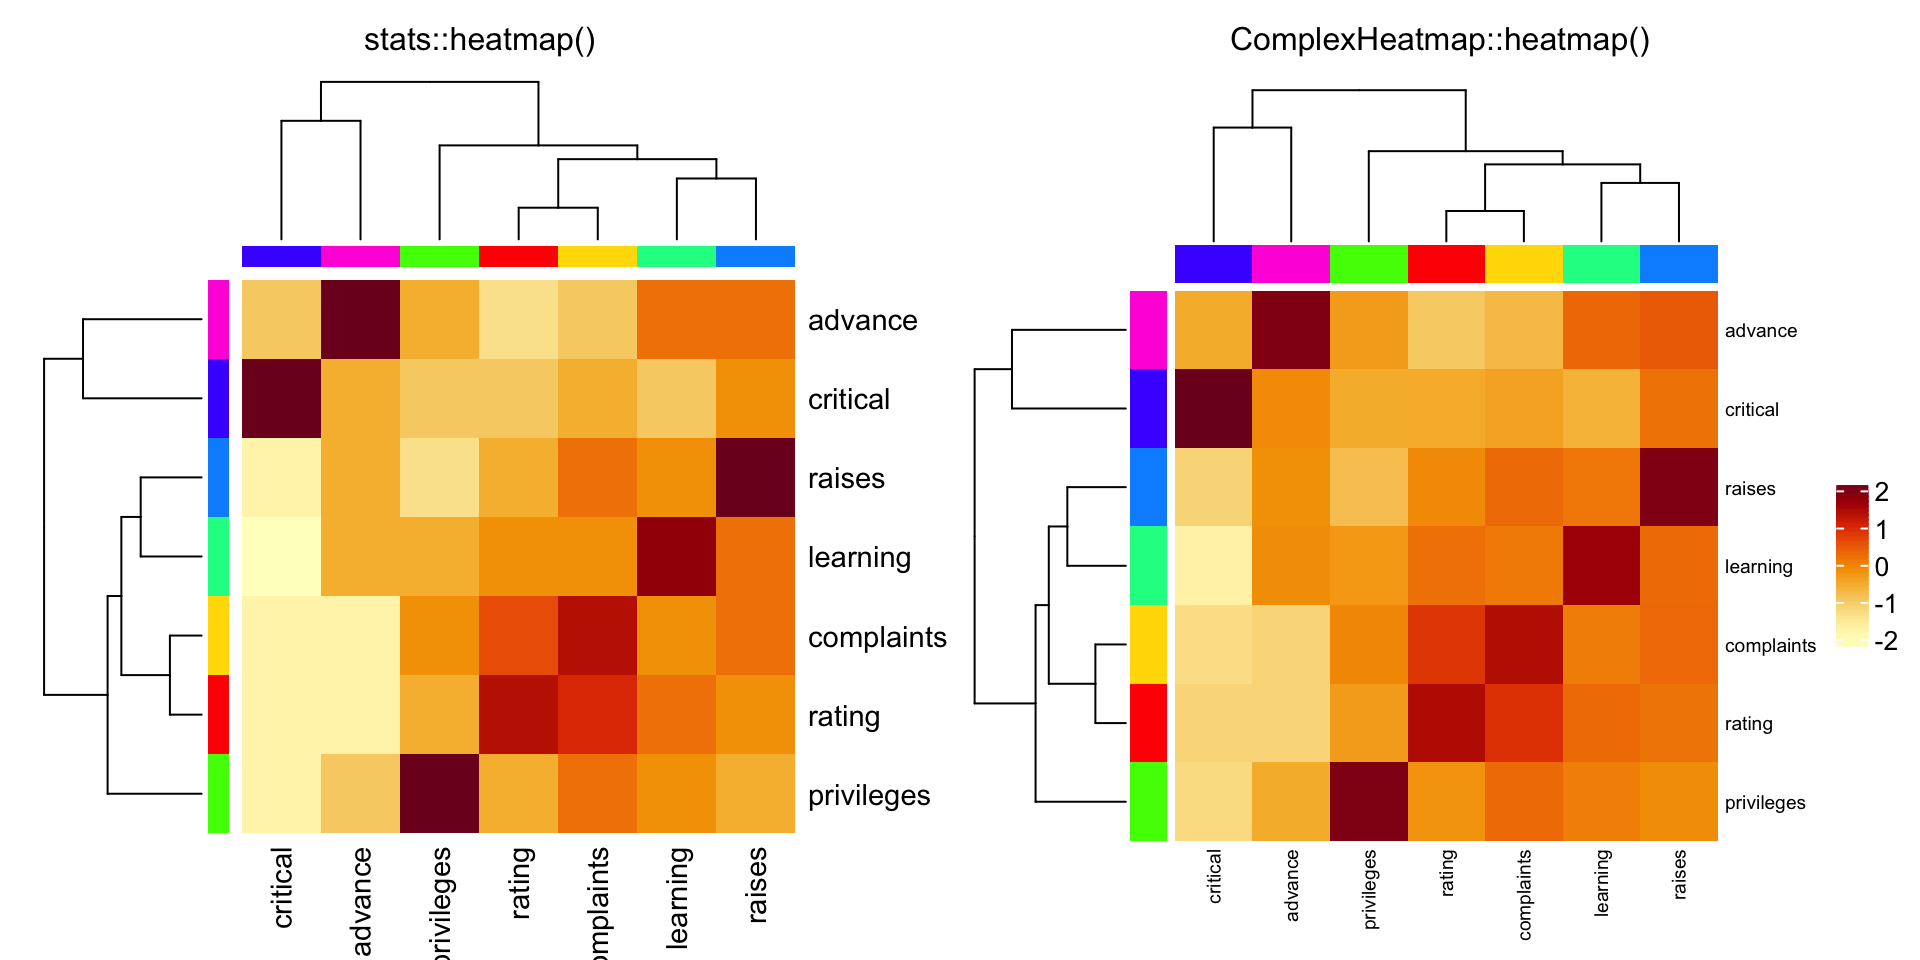
cU = cor(USJudgeRatings)
compare_heatmap(cU, Rowv = FALSE, col = topo.colors(16),
             distfun = function(c) as.dist(1 - c), keep.dendro = TRUE)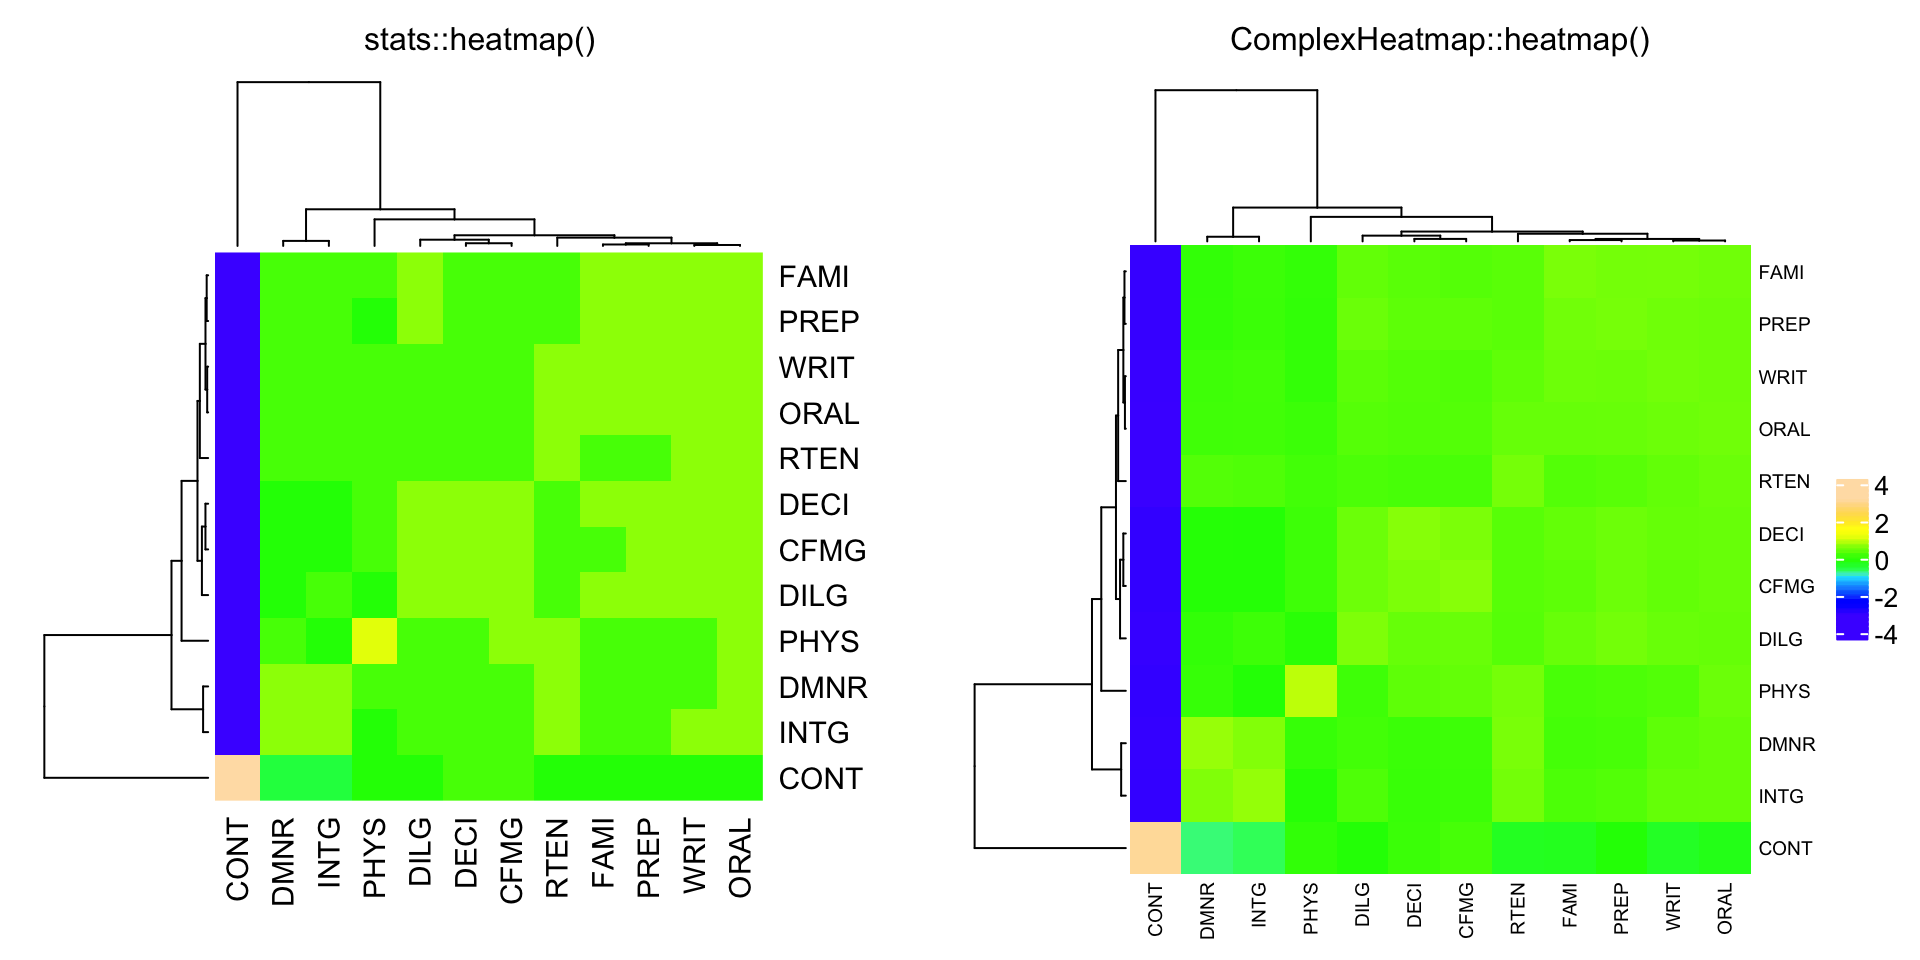
Translate from gplots::heatmap.2()
Similarly, in the following examples, compare_heatmap.2() basically sends
all the arguments to gplots::heatmap.2() and ComplexHeatmap::heatmap.2()
separately.
data(mtcars)
x = as.matrix(mtcars)
rc = rainbow(nrow(x), start = 0, end = .3)
cc = rainbow(ncol(x), start = 0, end = .3)
compare_heatmap.2(x)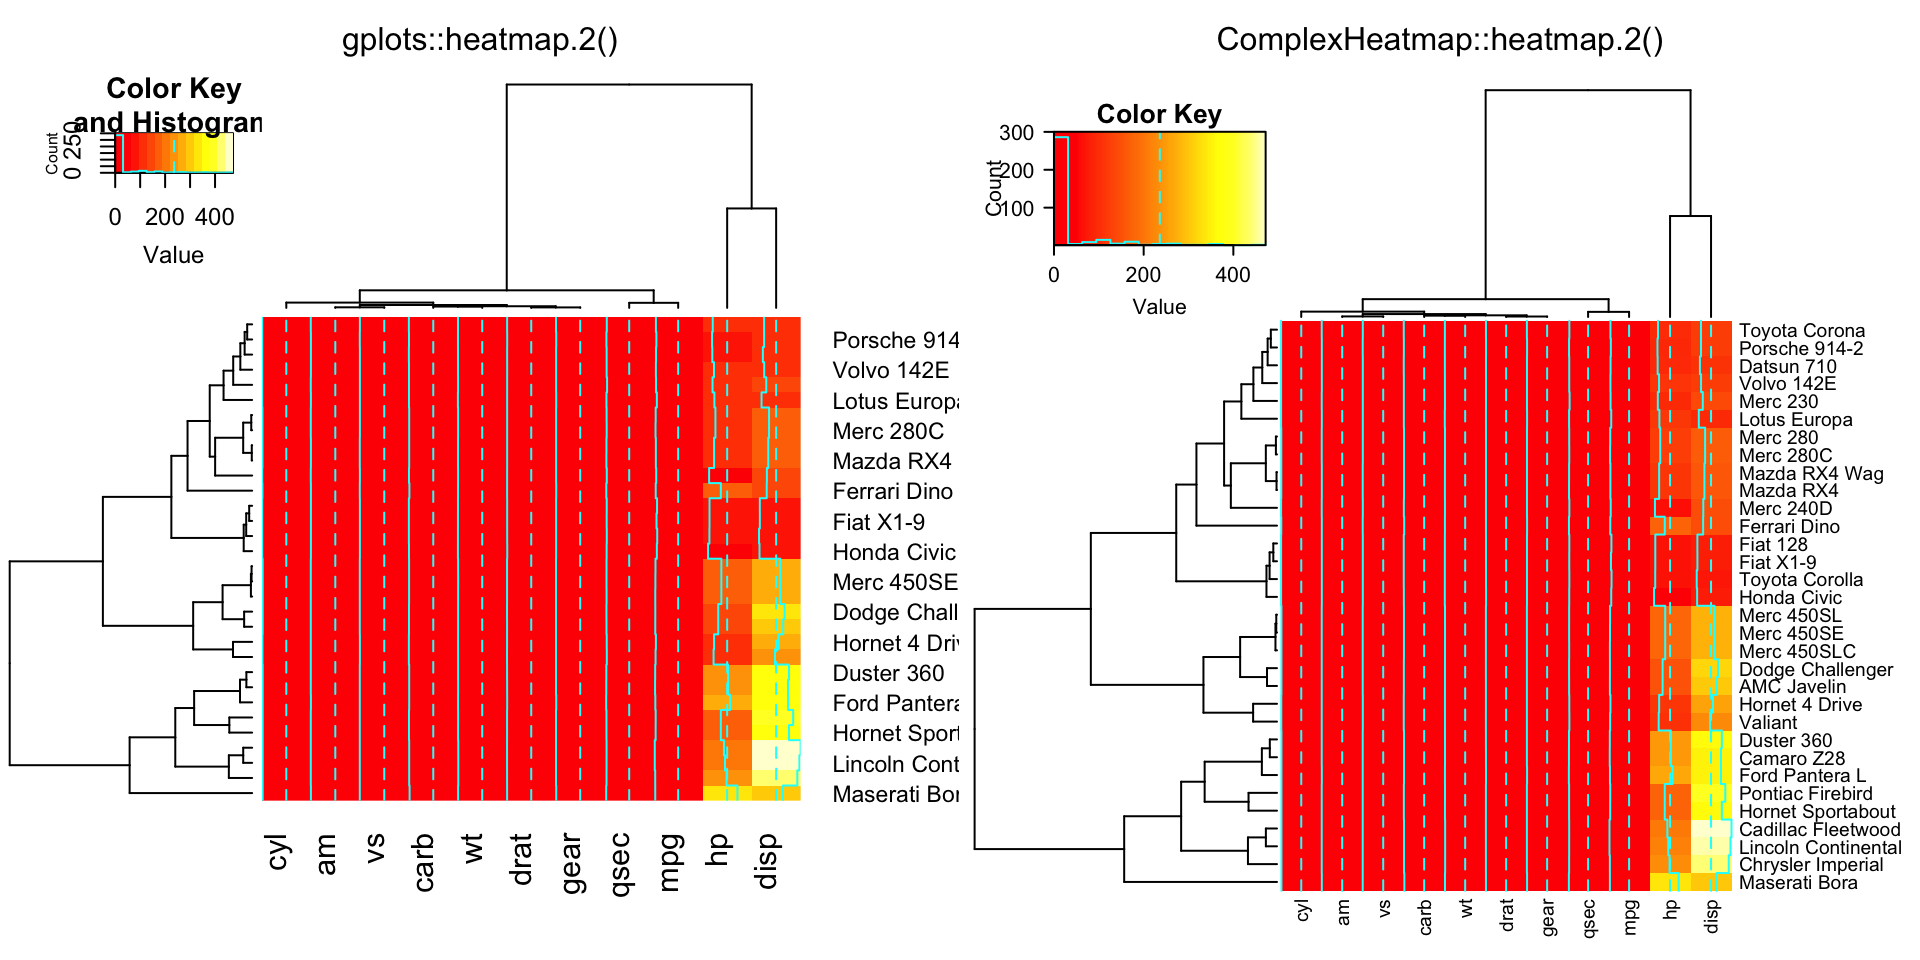
compare_heatmap.2(x, dendrogram = "none")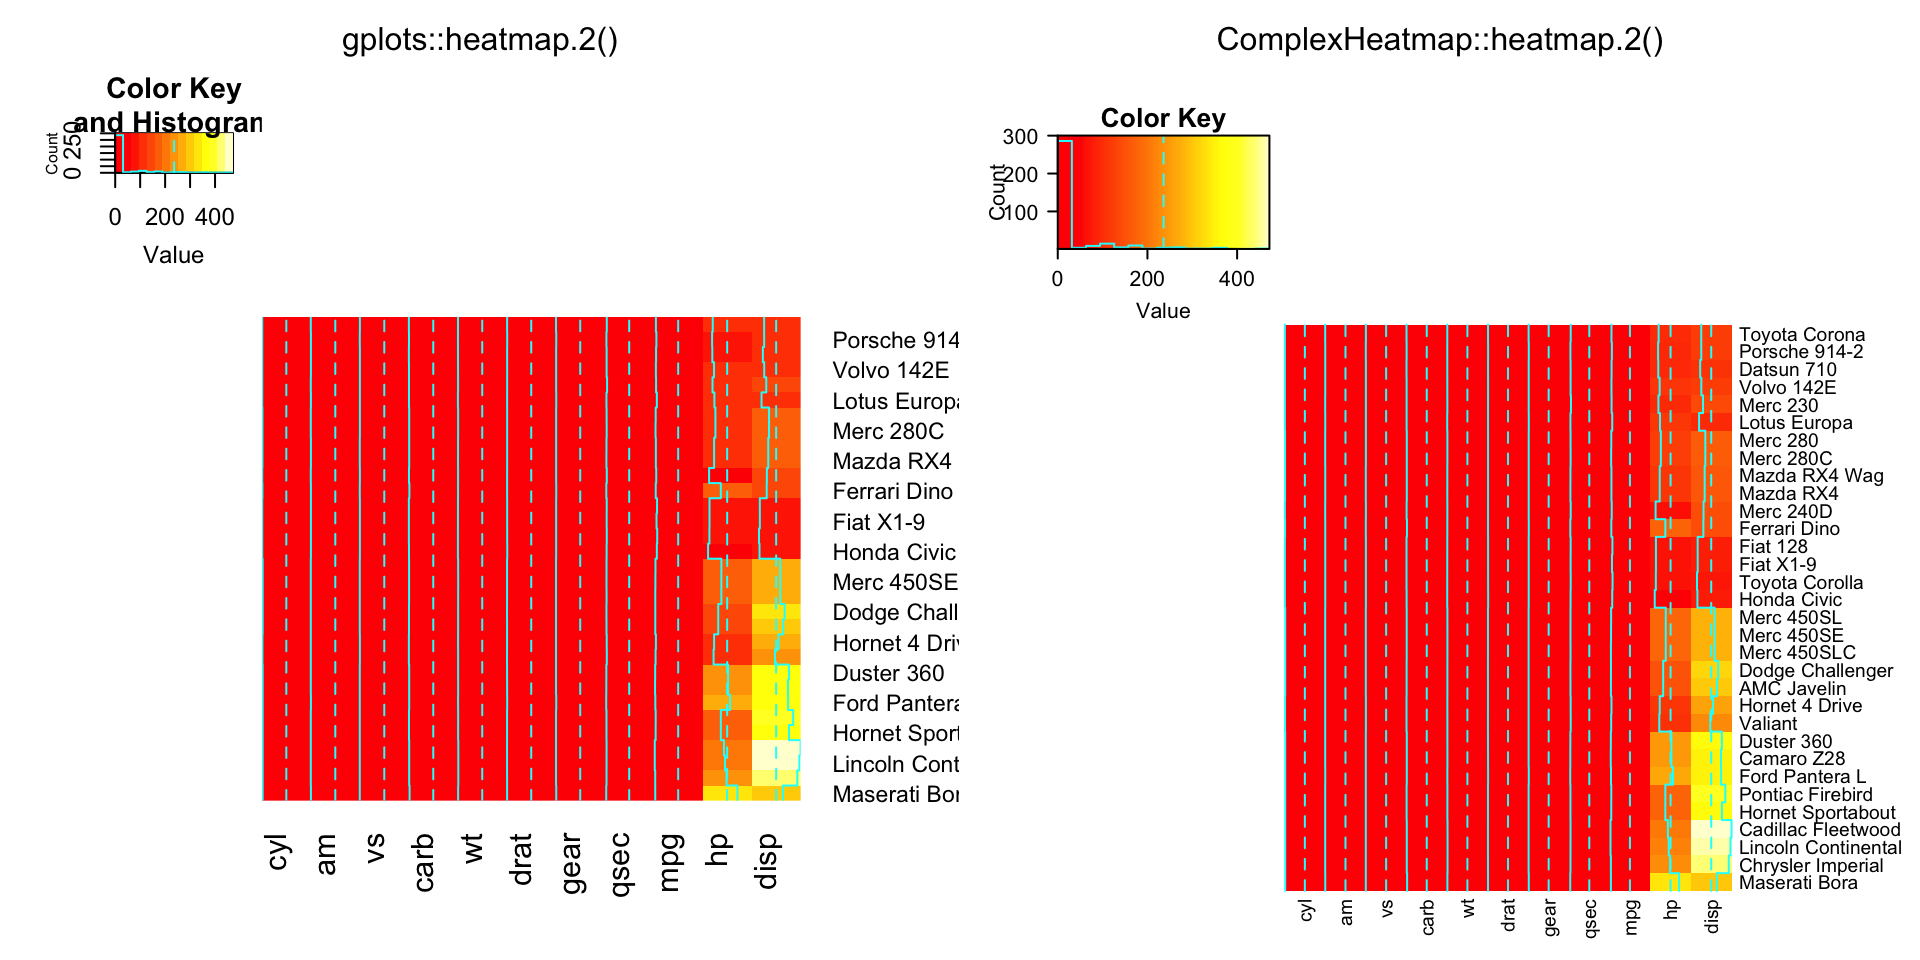
compare_heatmap.2(x, dendrogram = "row")
compare_heatmap.2(x, dendrogram = "col")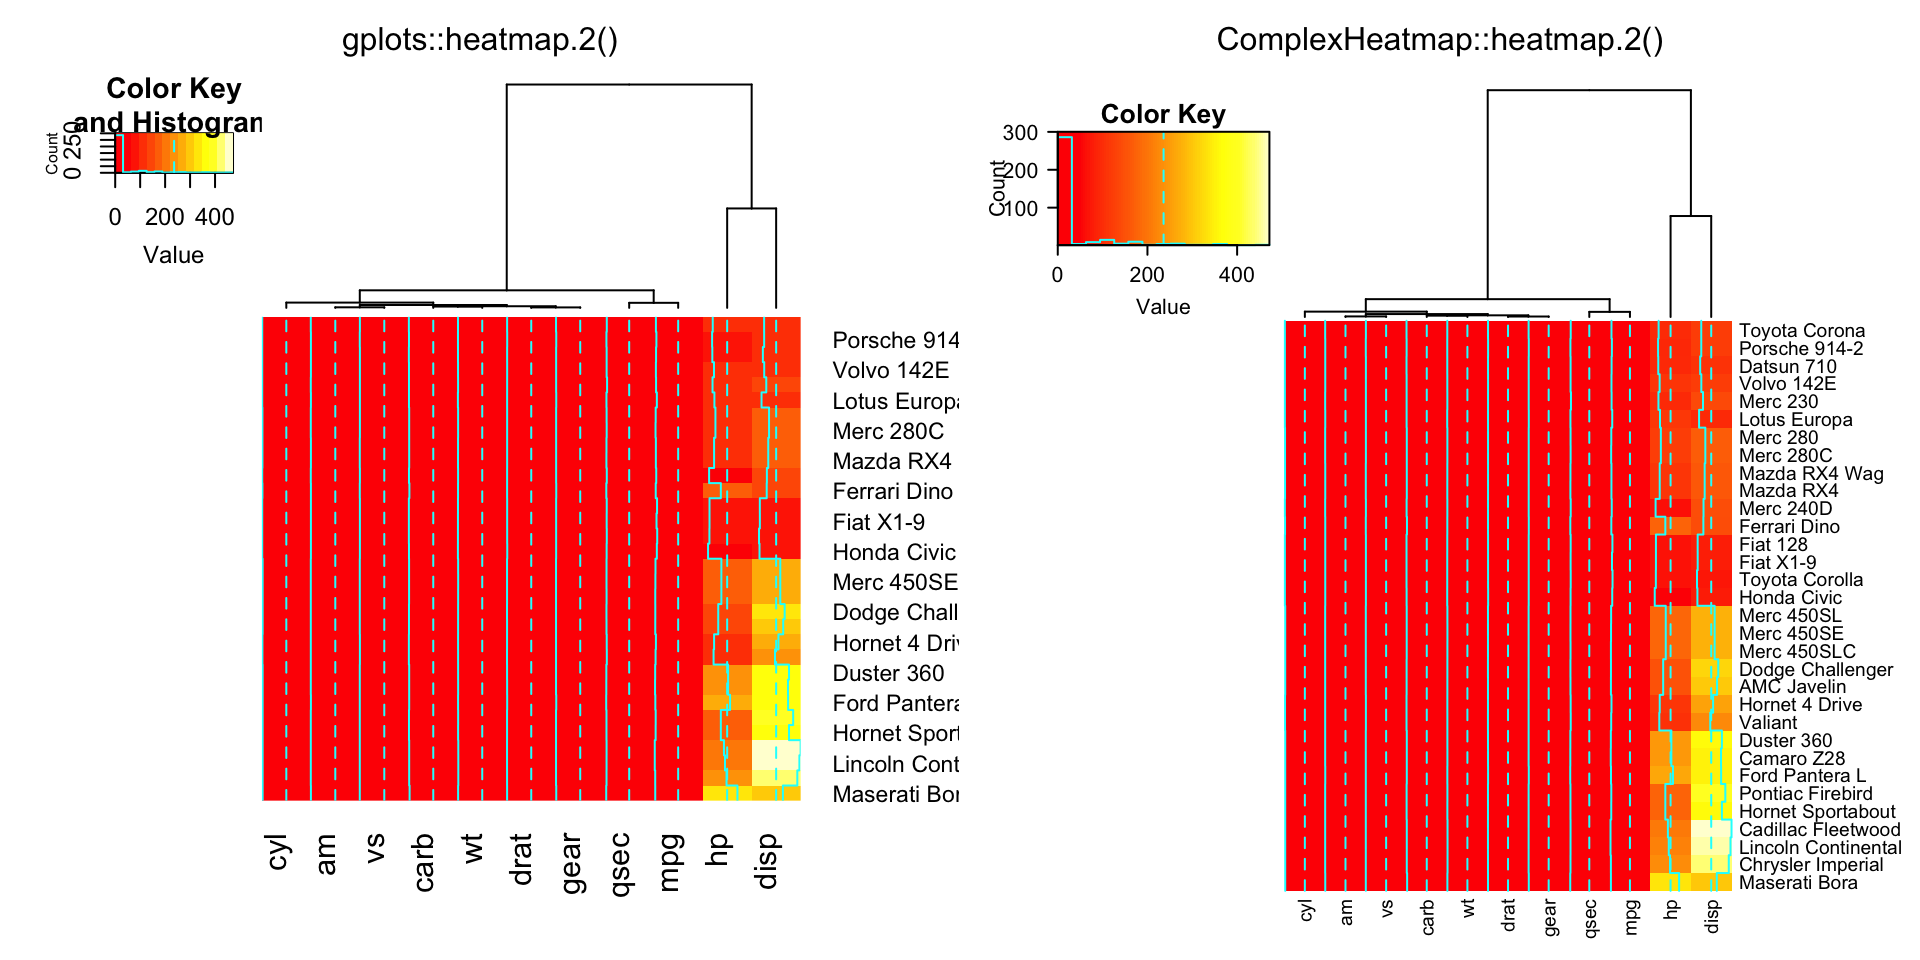
compare_heatmap.2(x, Rowv = FALSE, dendrogram = "both")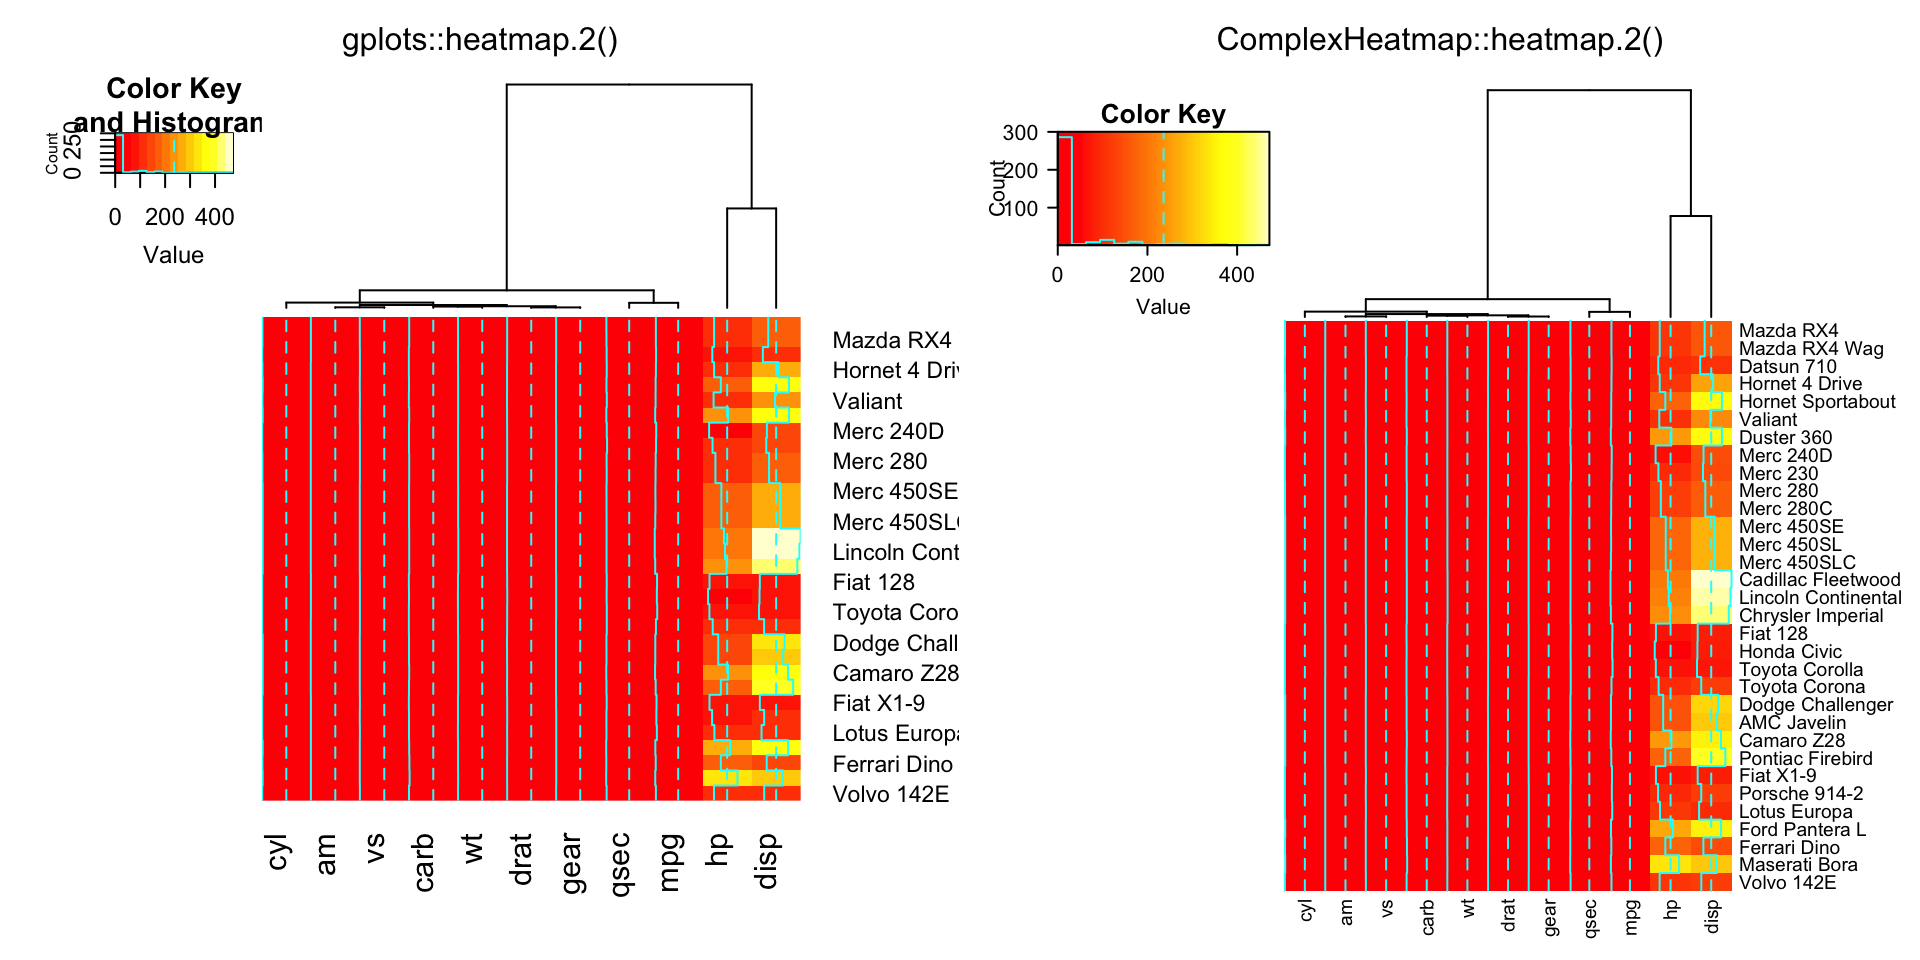
compare_heatmap.2(x, Rowv = NULL, dendrogram = "both")
compare_heatmap.2(x, Colv = FALSE, dendrogram = "both")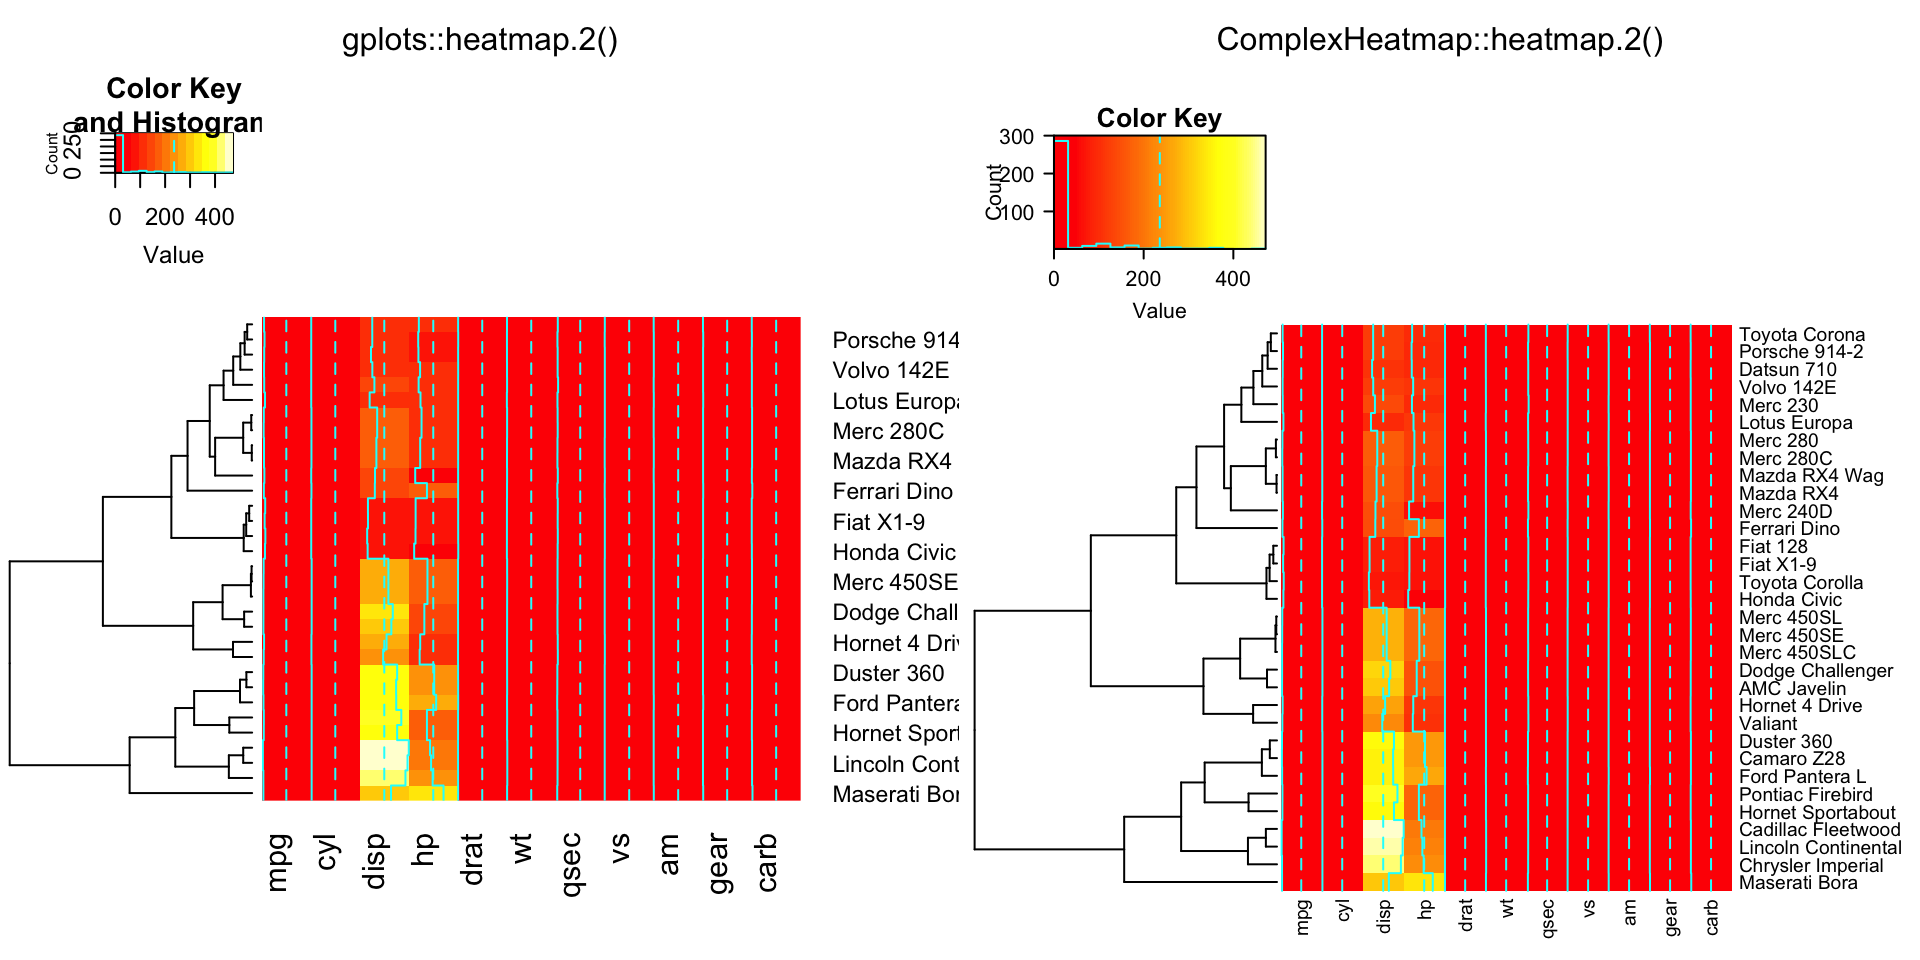
compare_heatmap.2(x, reorderfun = function(d, w) reorder(d, w, agglo.FUN = mean))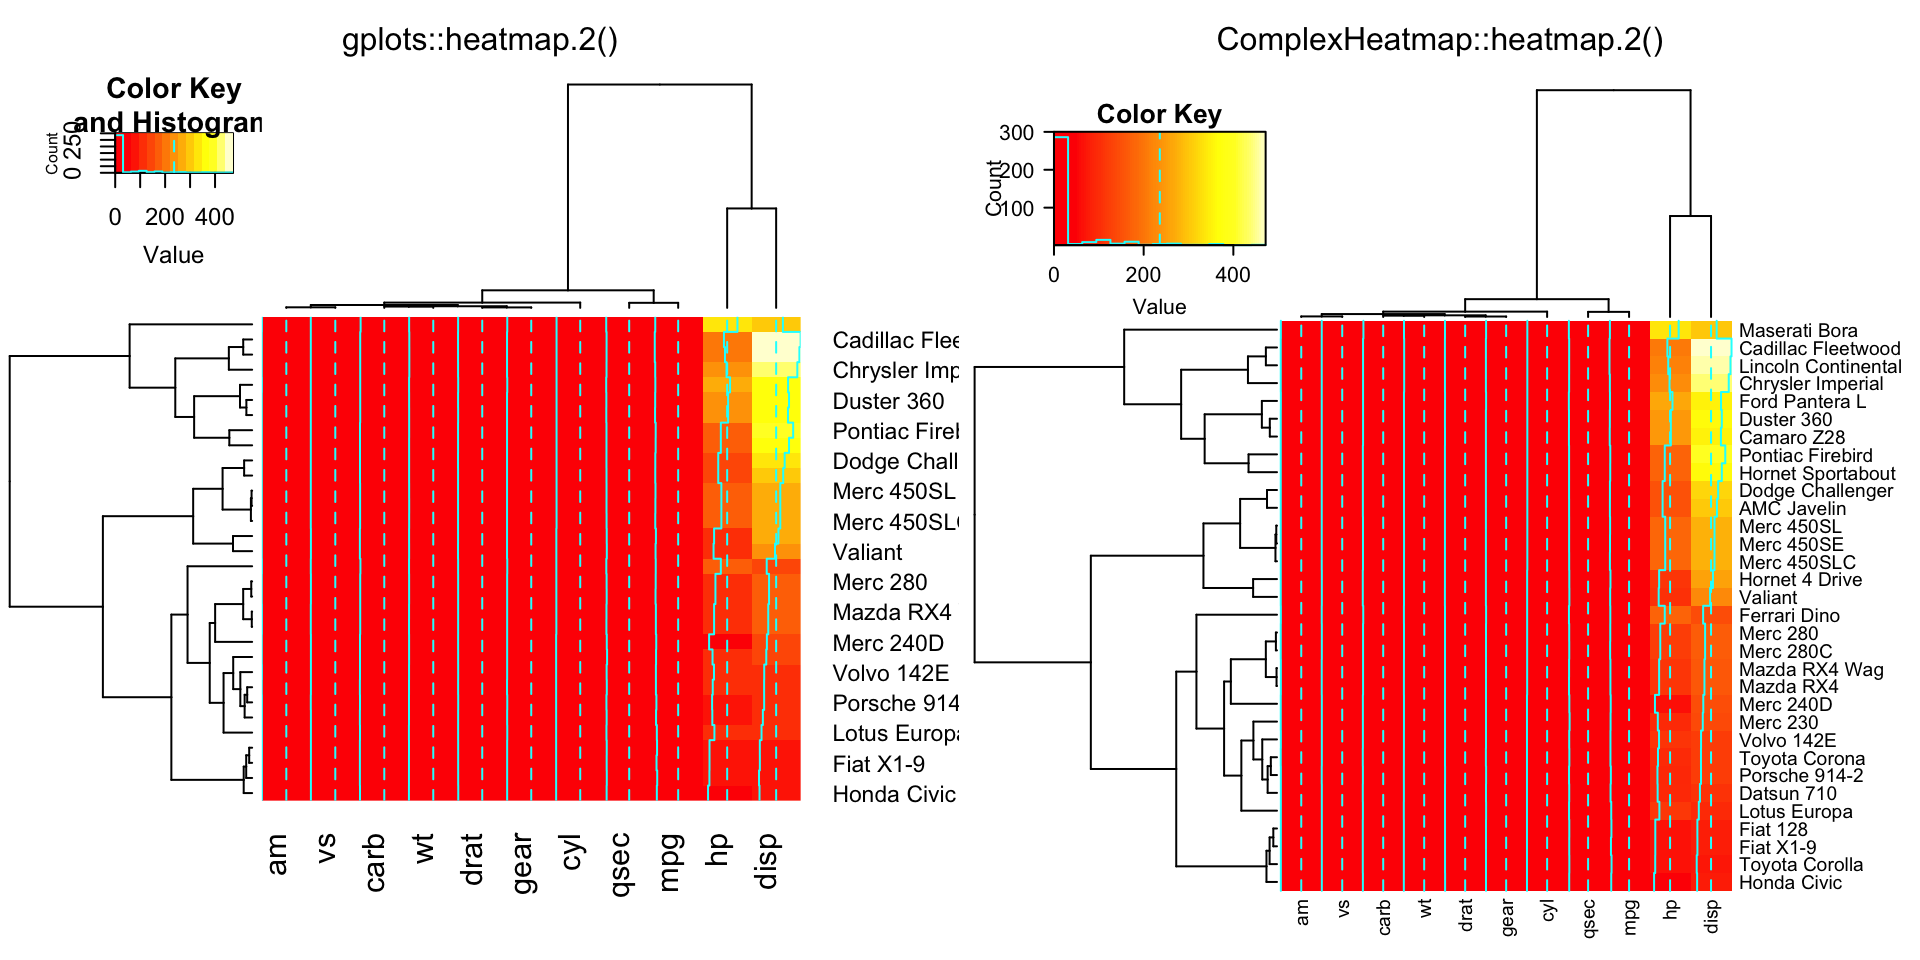
compare_heatmap.2(x, col = gplots::bluered, scale = "column", tracecol = "#303030")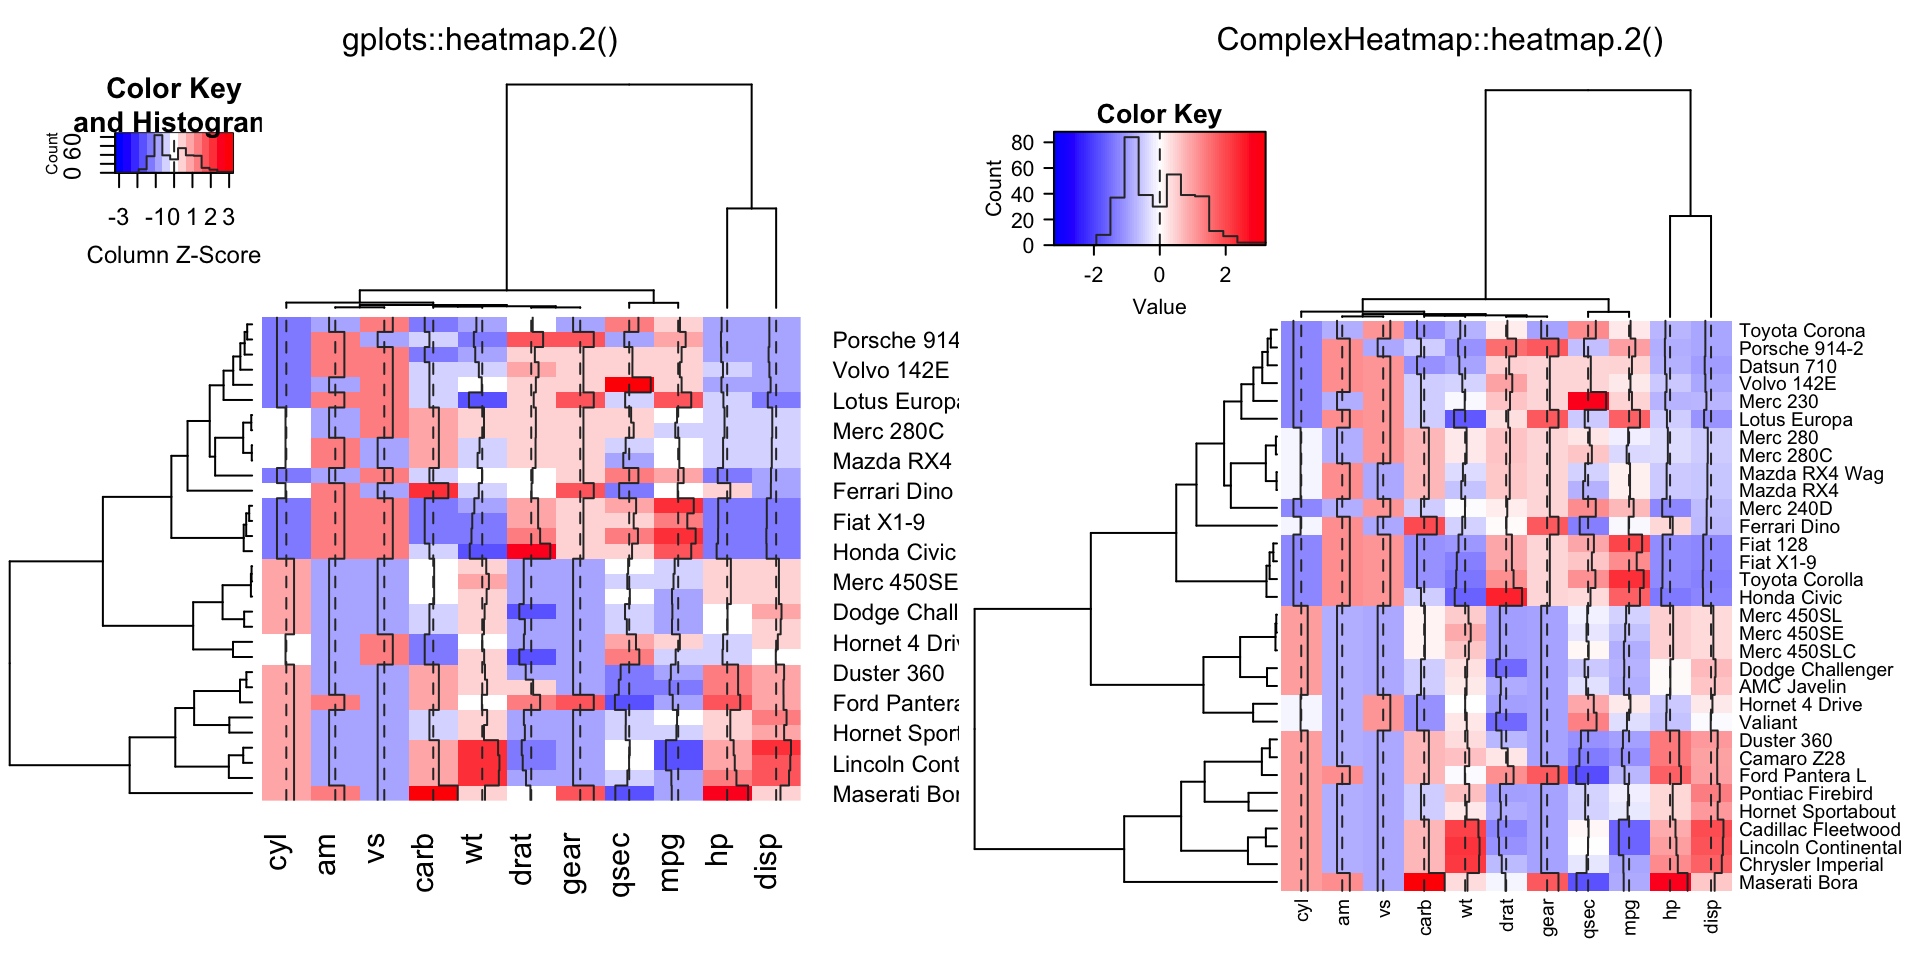
compare_heatmap.2(x, col = cm.colors(255), scale = "column",
         RowSideColors = rc, ColSideColors = cc, margin = c(5, 10),
         xlab = "specification variables", ylab = "Car Models",
         main = "heatmap(<Mtcars data>, ..., scale=\"column\")",
         tracecol = "green", density = "density")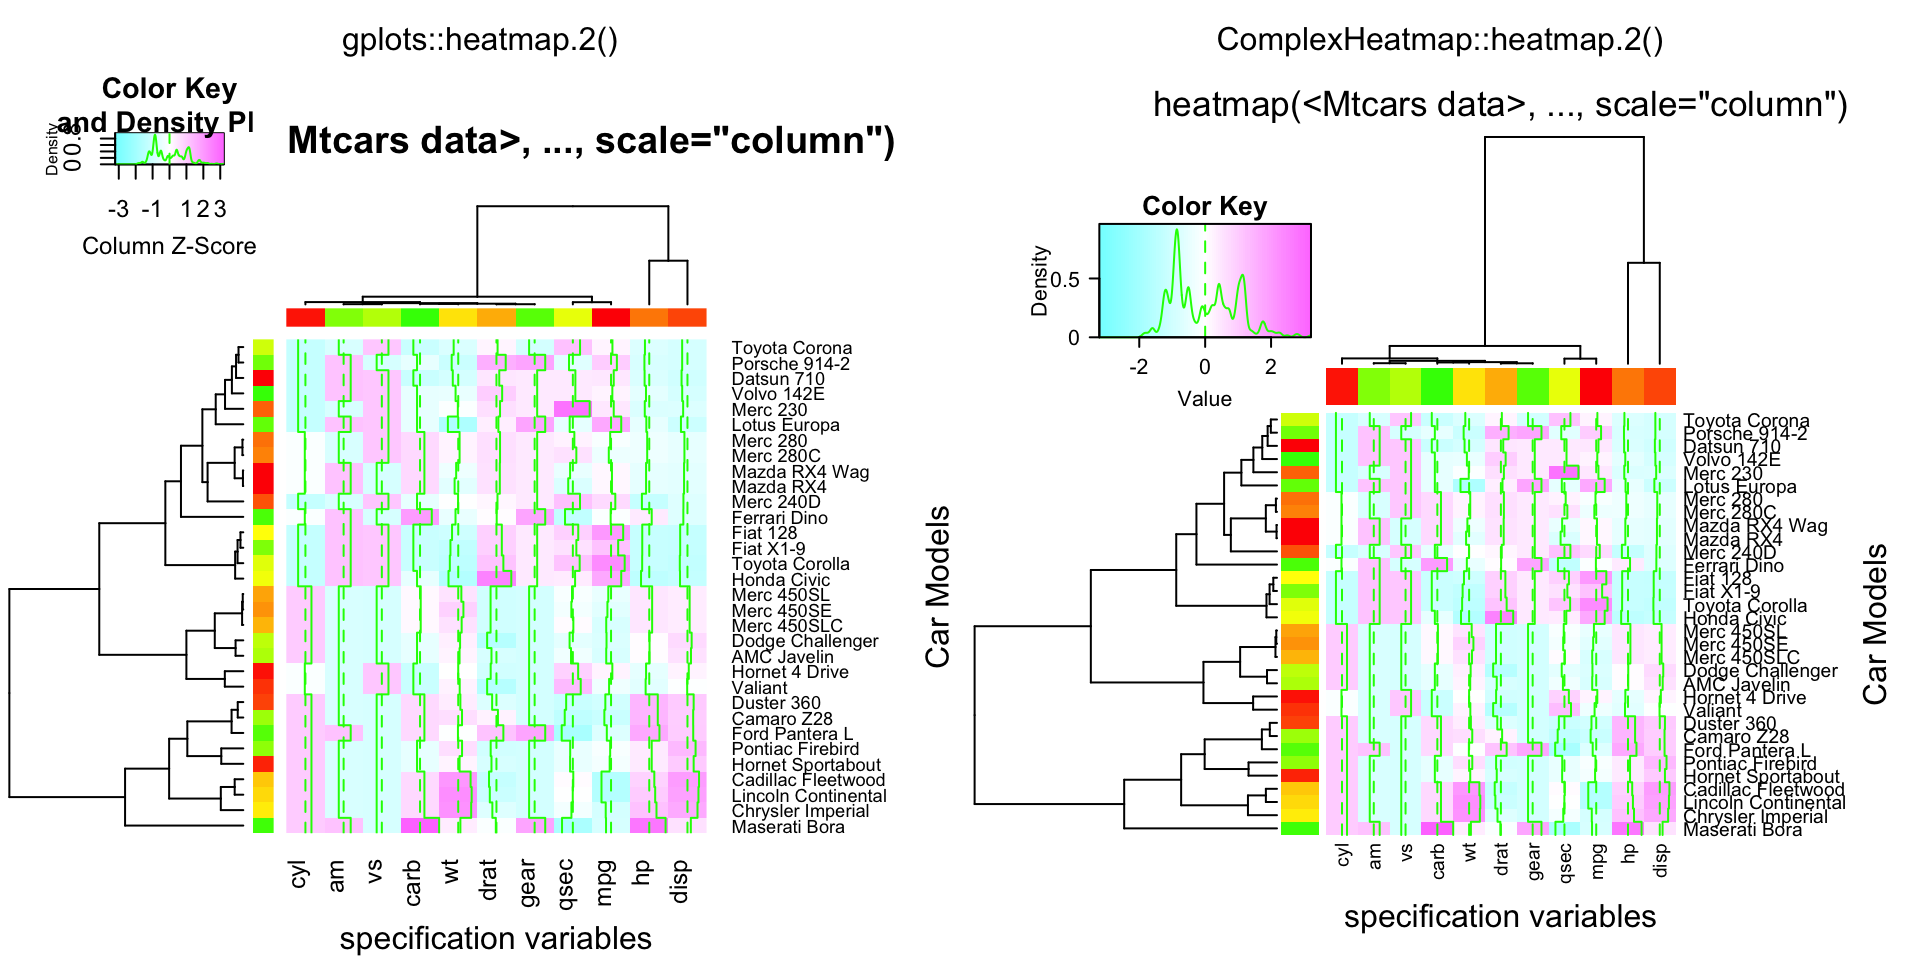
compare_heatmap.2(x, col = cm.colors(255), scale = "column",
         RowSideColors = rc, ColSideColors = cc, margin = c(5, 10),
         xlab = "specification variables", ylab = "Car Models",
         main = "heatmap(<Mtcars data>, ..., scale=\"column\")",
         tracecol = "green", density = "density", colRow = rc, colCol = cc,
         srtCol = 45, adjCol = c(0.5,1))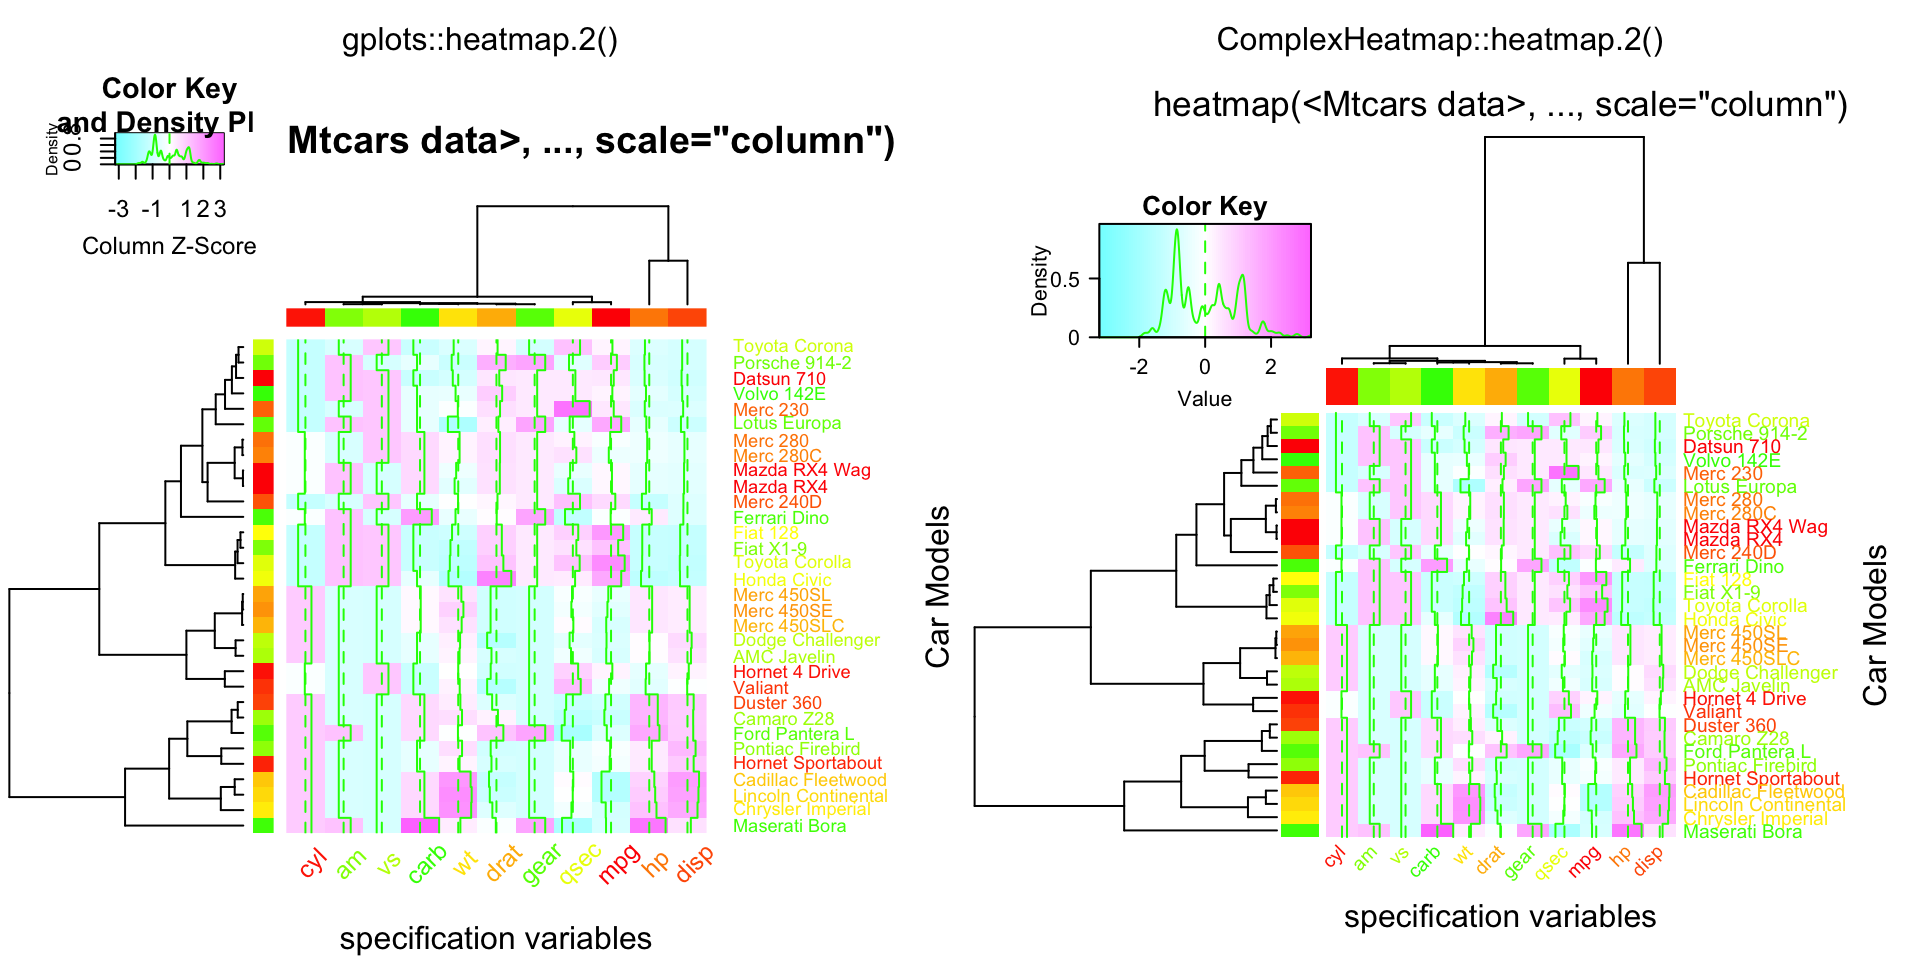
data(attitude)
Ca = cor(attitude)

compare_heatmap.2(Ca, symm = TRUE, margin = c(6, 6), trace = "none" )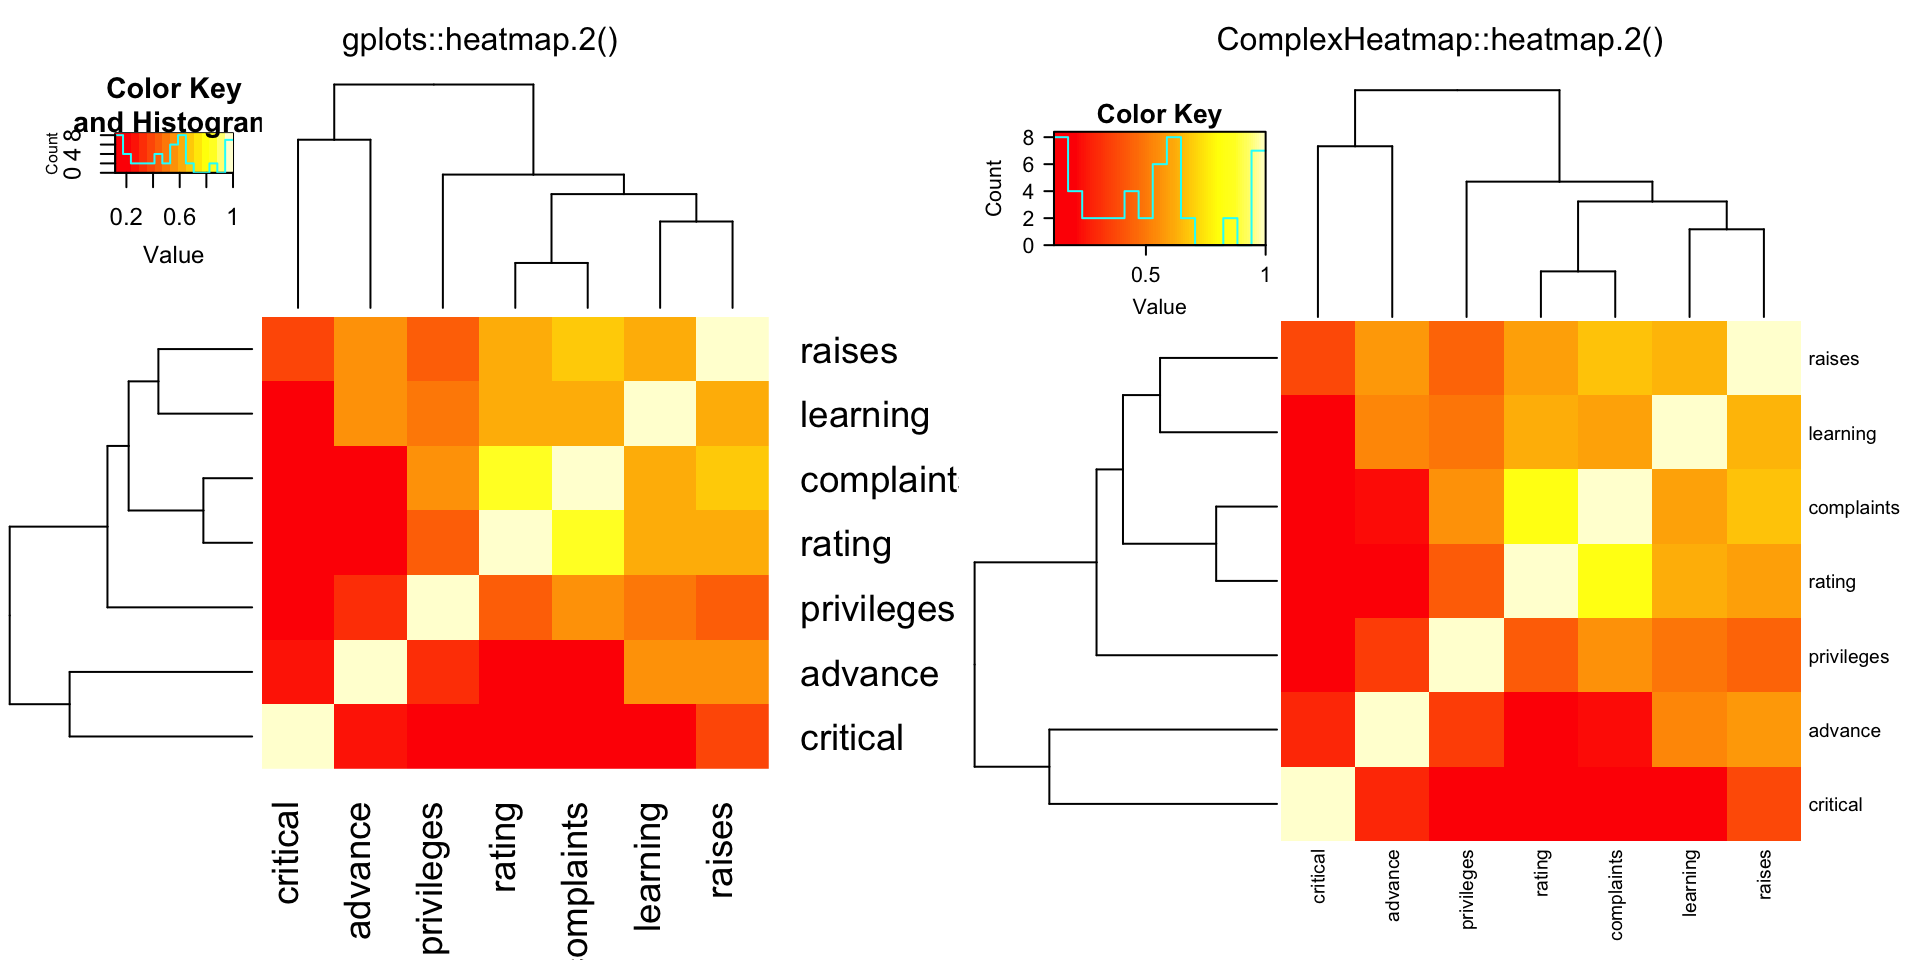
compare_heatmap.2(Ca, Rowv = FALSE, symm = TRUE, margin = c(6, 6), trace = "none" )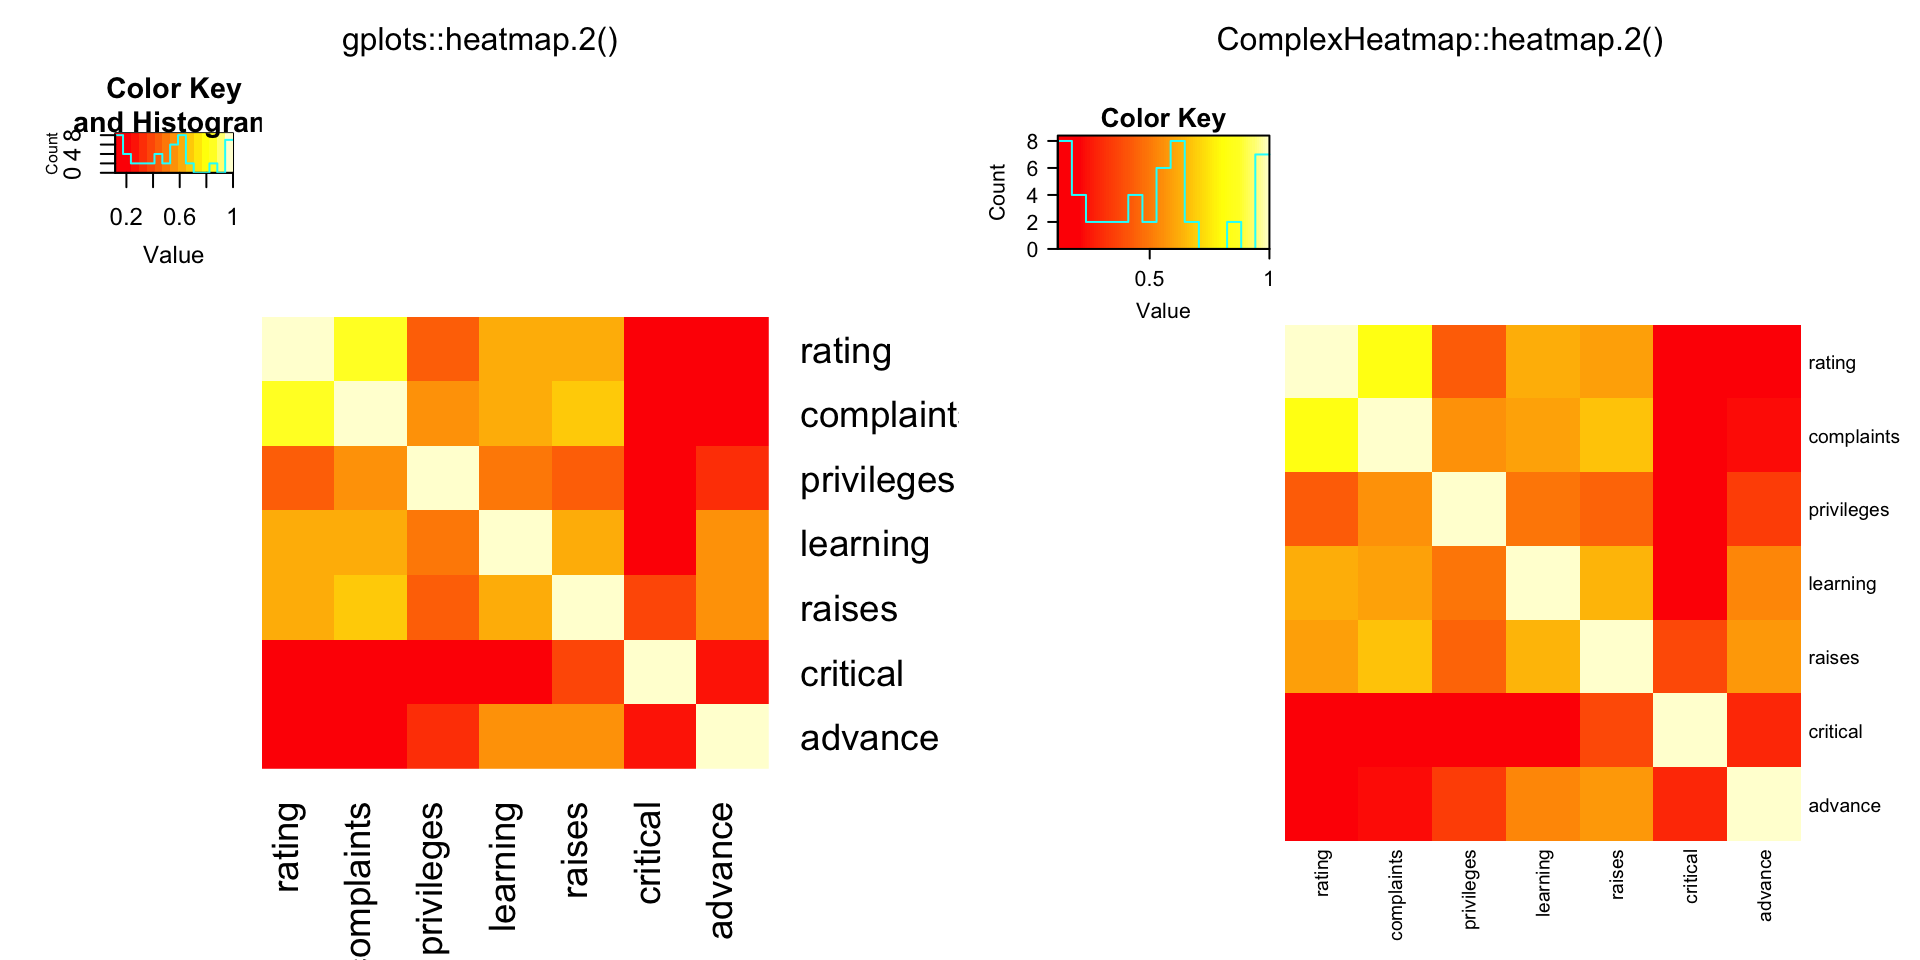
data(USJudgeRatings)
cU = cor(USJudgeRatings)

compare_heatmap.2(cU, Rowv = FALSE, symm = TRUE, col = topo.colors(16),
              distfun = function(c) as.dist(1 - c), trace = "none")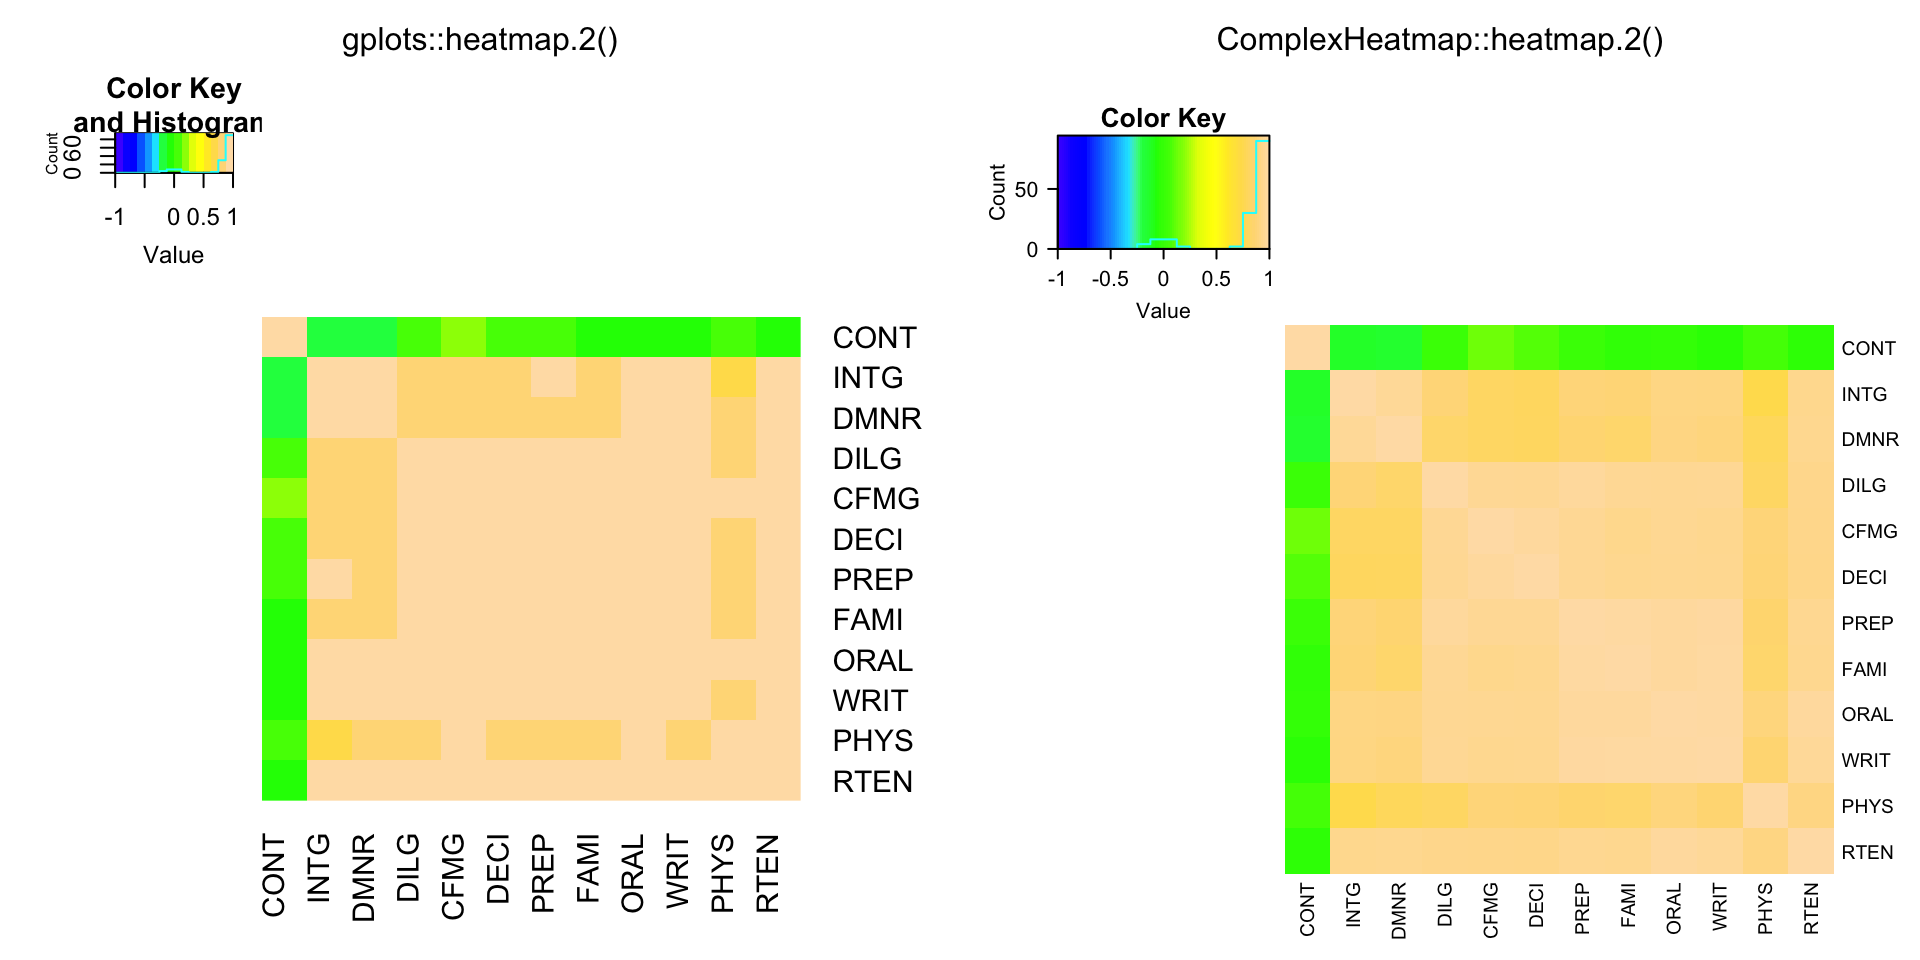
hM = format(round(cU, 2))
compare_heatmap.2(cU, Rowv = FALSE, symm = TRUE, col = rev(heat.colors(16)),
             distfun = function(c) as.dist(1 - c), trace = "none",
             cellnote = hM)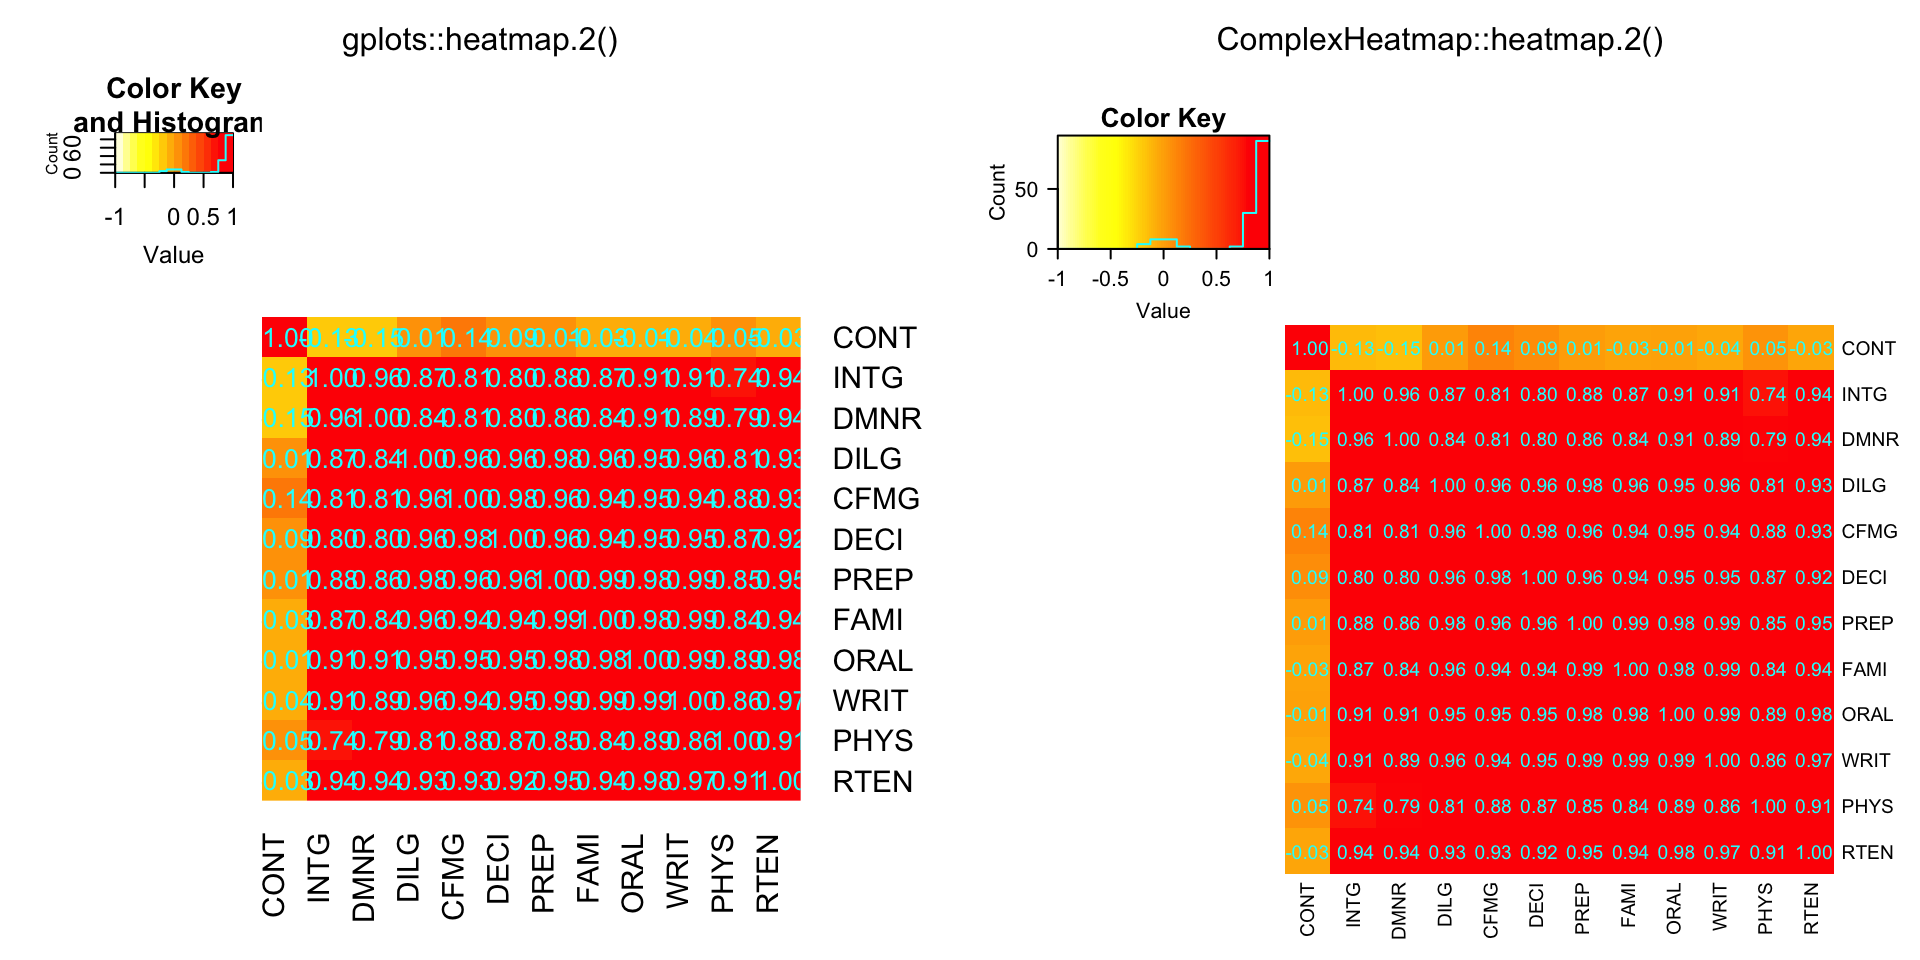
library(affy)
data(SpikeIn)
pms = SpikeIn@pm

compare_heatmap.2(pms, col = rev(heat.colors(16)), main = "SpikeIn@pm",
              xlab = "Relative Concentration", ylab = "Probeset",
              scale = "row")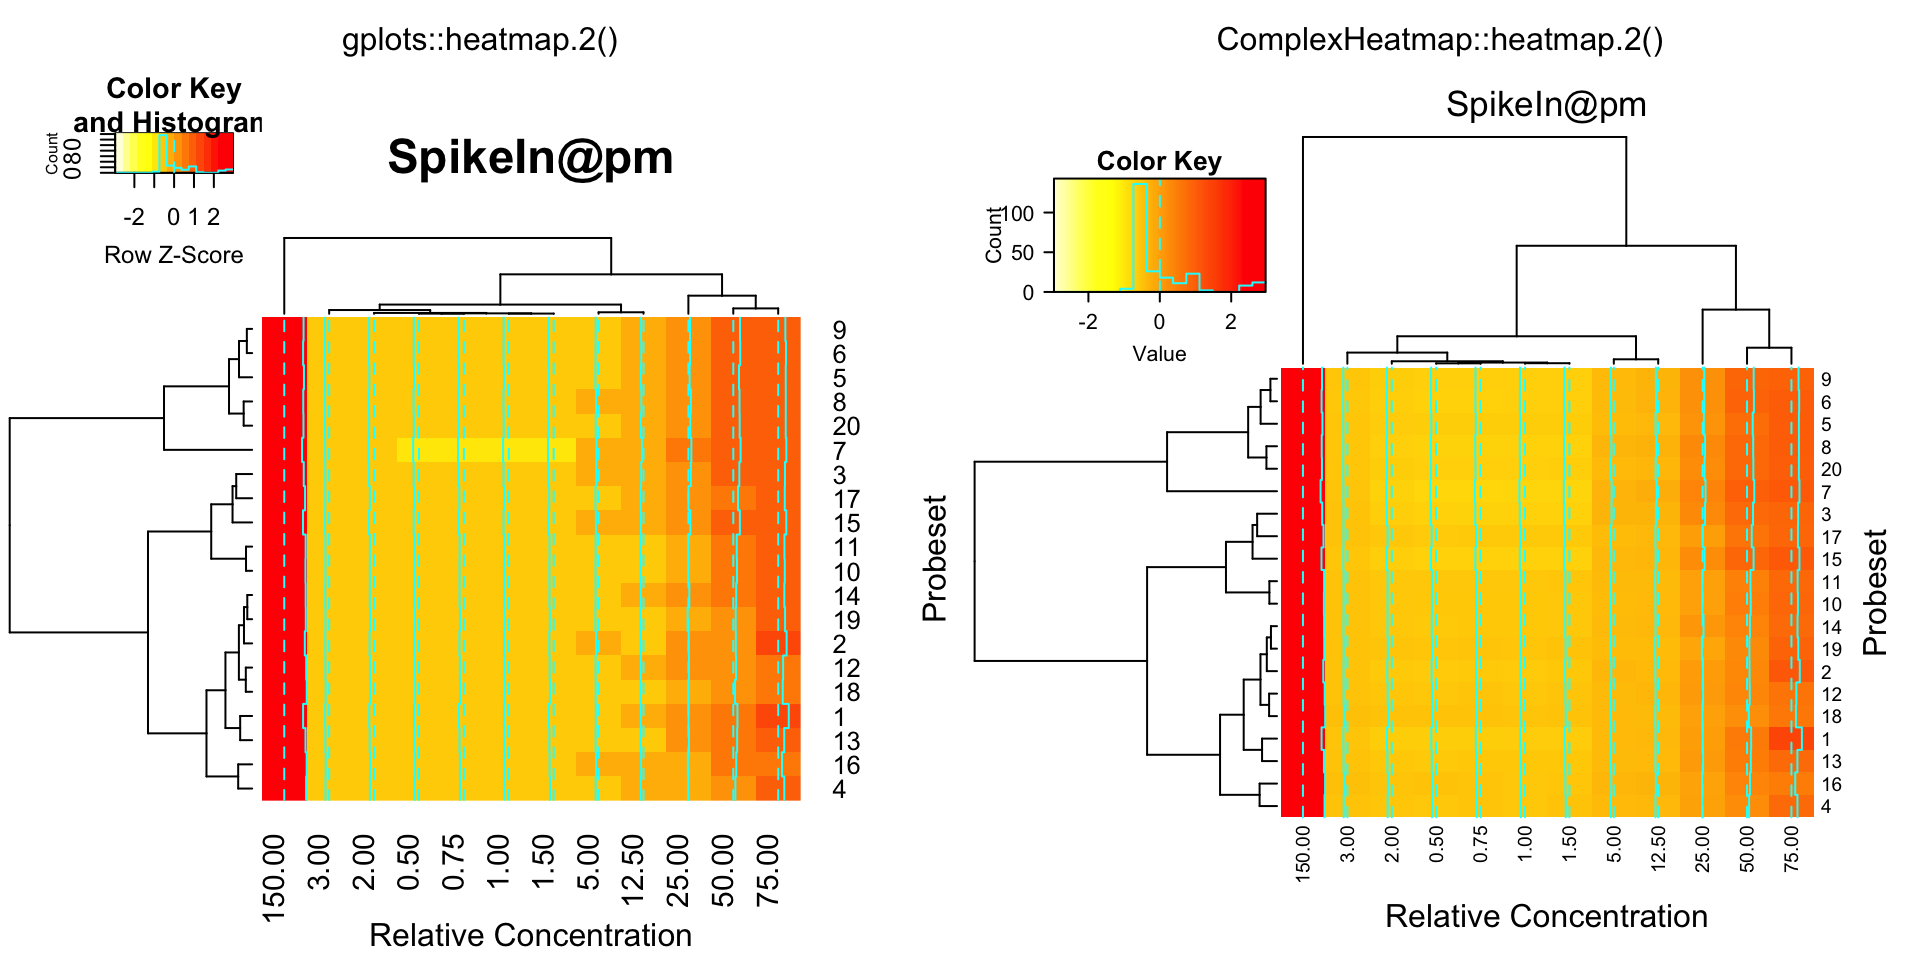
data = pms / pms[, "12.50"]
data = ifelse(data > 1, data, -1 / data)
compare_heatmap.2(data, breaks = 16, col = gplots::redgreen, tracecol = "blue",
               main = "SpikeIn@pm Fold Changes\nrelative to 12.50 sample",
               xlab = "Relative Concentration", ylab = "Probeset")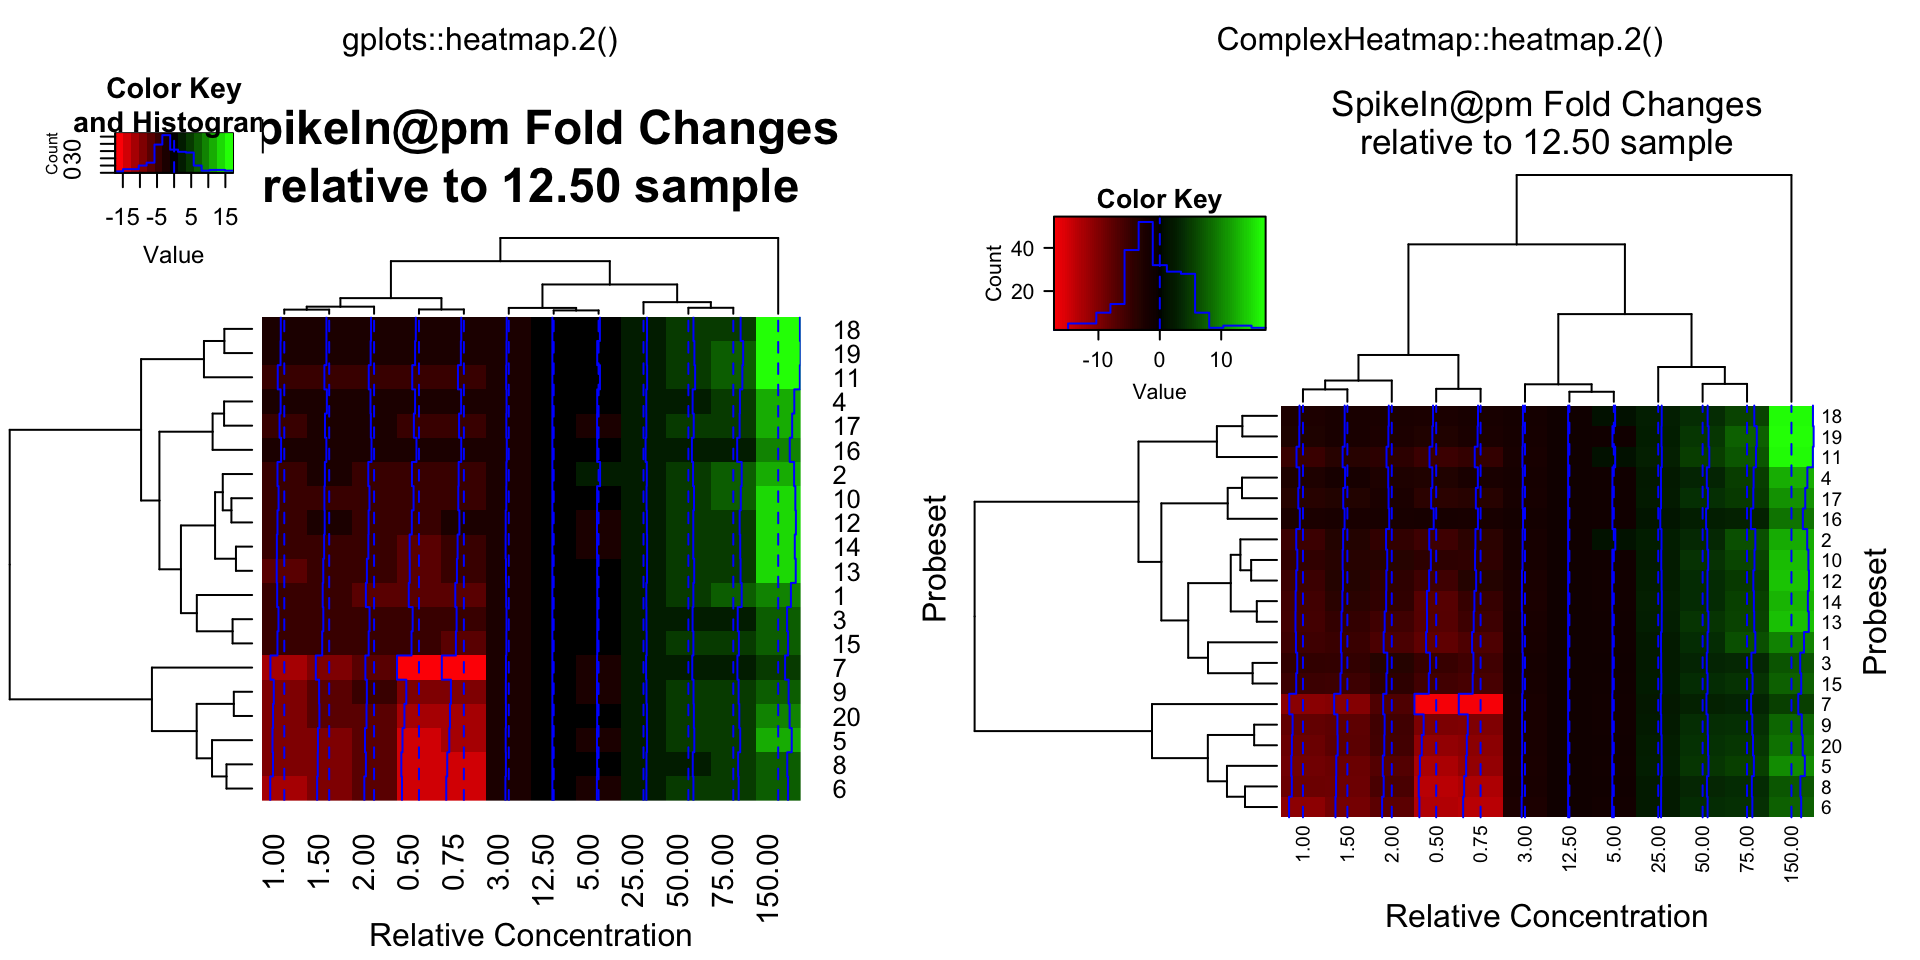
SessionInfo
sessionInfo()## R version 4.0.2 (2020-06-22)
## Platform: x86_64-apple-darwin17.0 (64-bit)
## Running under: macOS Catalina 10.15.5
##
## Matrix products: default
## BLAS: /Library/Frameworks/R.framework/Versions/4.0/Resources/lib/libRblas.dylib
## LAPACK: /Library/Frameworks/R.framework/Versions/4.0/Resources/lib/libRlapack.dylib
##
## locale:
## [1] en_GB.UTF-8/en_GB.UTF-8/en_GB.UTF-8/C/en_GB.UTF-8/en_GB.UTF-8
##
## attached base packages:
## [1] parallel grid stats graphics grDevices utils datasets methods base
##
## other attached packages:
## [1] affy_1.66.0 Biobase_2.48.0 BiocGenerics_0.34.0
## [4] ComplexHeatmap_2.7.1.1012 knitr_1.30
##
## loaded via a namespace (and not attached):
## [1] Rcpp_1.0.5 BiocManager_1.30.10 compiler_4.0.2 RColorBrewer_1.1-2
## [5] zlibbioc_1.34.0 bitops_1.0-6 tools_4.0.2 digest_0.6.27
## [9] preprocessCore_1.50.0 evaluate_0.14 clue_0.3-57 png_0.1-7
## [13] rlang_0.4.8 magick_2.5.2 yaml_2.2.1 blogdown_0.17
## [17] xfun_0.19 stringr_1.4.0 cluster_2.1.0 GlobalOptions_0.1.2
## [21] S4Vectors_0.26.1 gridGraphics_0.5-0 gtools_3.8.2 caTools_1.18.0
## [25] IRanges_2.22.2 stats4_4.0.2 GetoptLong_1.0.4 rmarkdown_2.5
## [29] bookdown_0.21 magrittr_2.0.1 gplots_3.1.0 matrixStats_0.57.0
## [33] htmltools_0.5.0 shape_1.4.5 circlize_0.4.12.1004 colorspace_2.0-0
## [37] KernSmooth_2.23-18 stringi_1.5.3 crayon_1.3.4 rjson_0.2.20
## [41] affyio_1.58.0 Cairo_1.5-12.2